In Census 2021, respondents aged 16 years and over were asked for their full job titles (for their main job, or if not working their last main job) and the main activity of their employer. The answers they gave were coded using the Standard Occupational Classification 2020. Bury’s figures are very comparable to those for England and Wales.
The data published included occupational data broken down into 104 minor groups. These were combined into the following 9 high-level occupational categories:
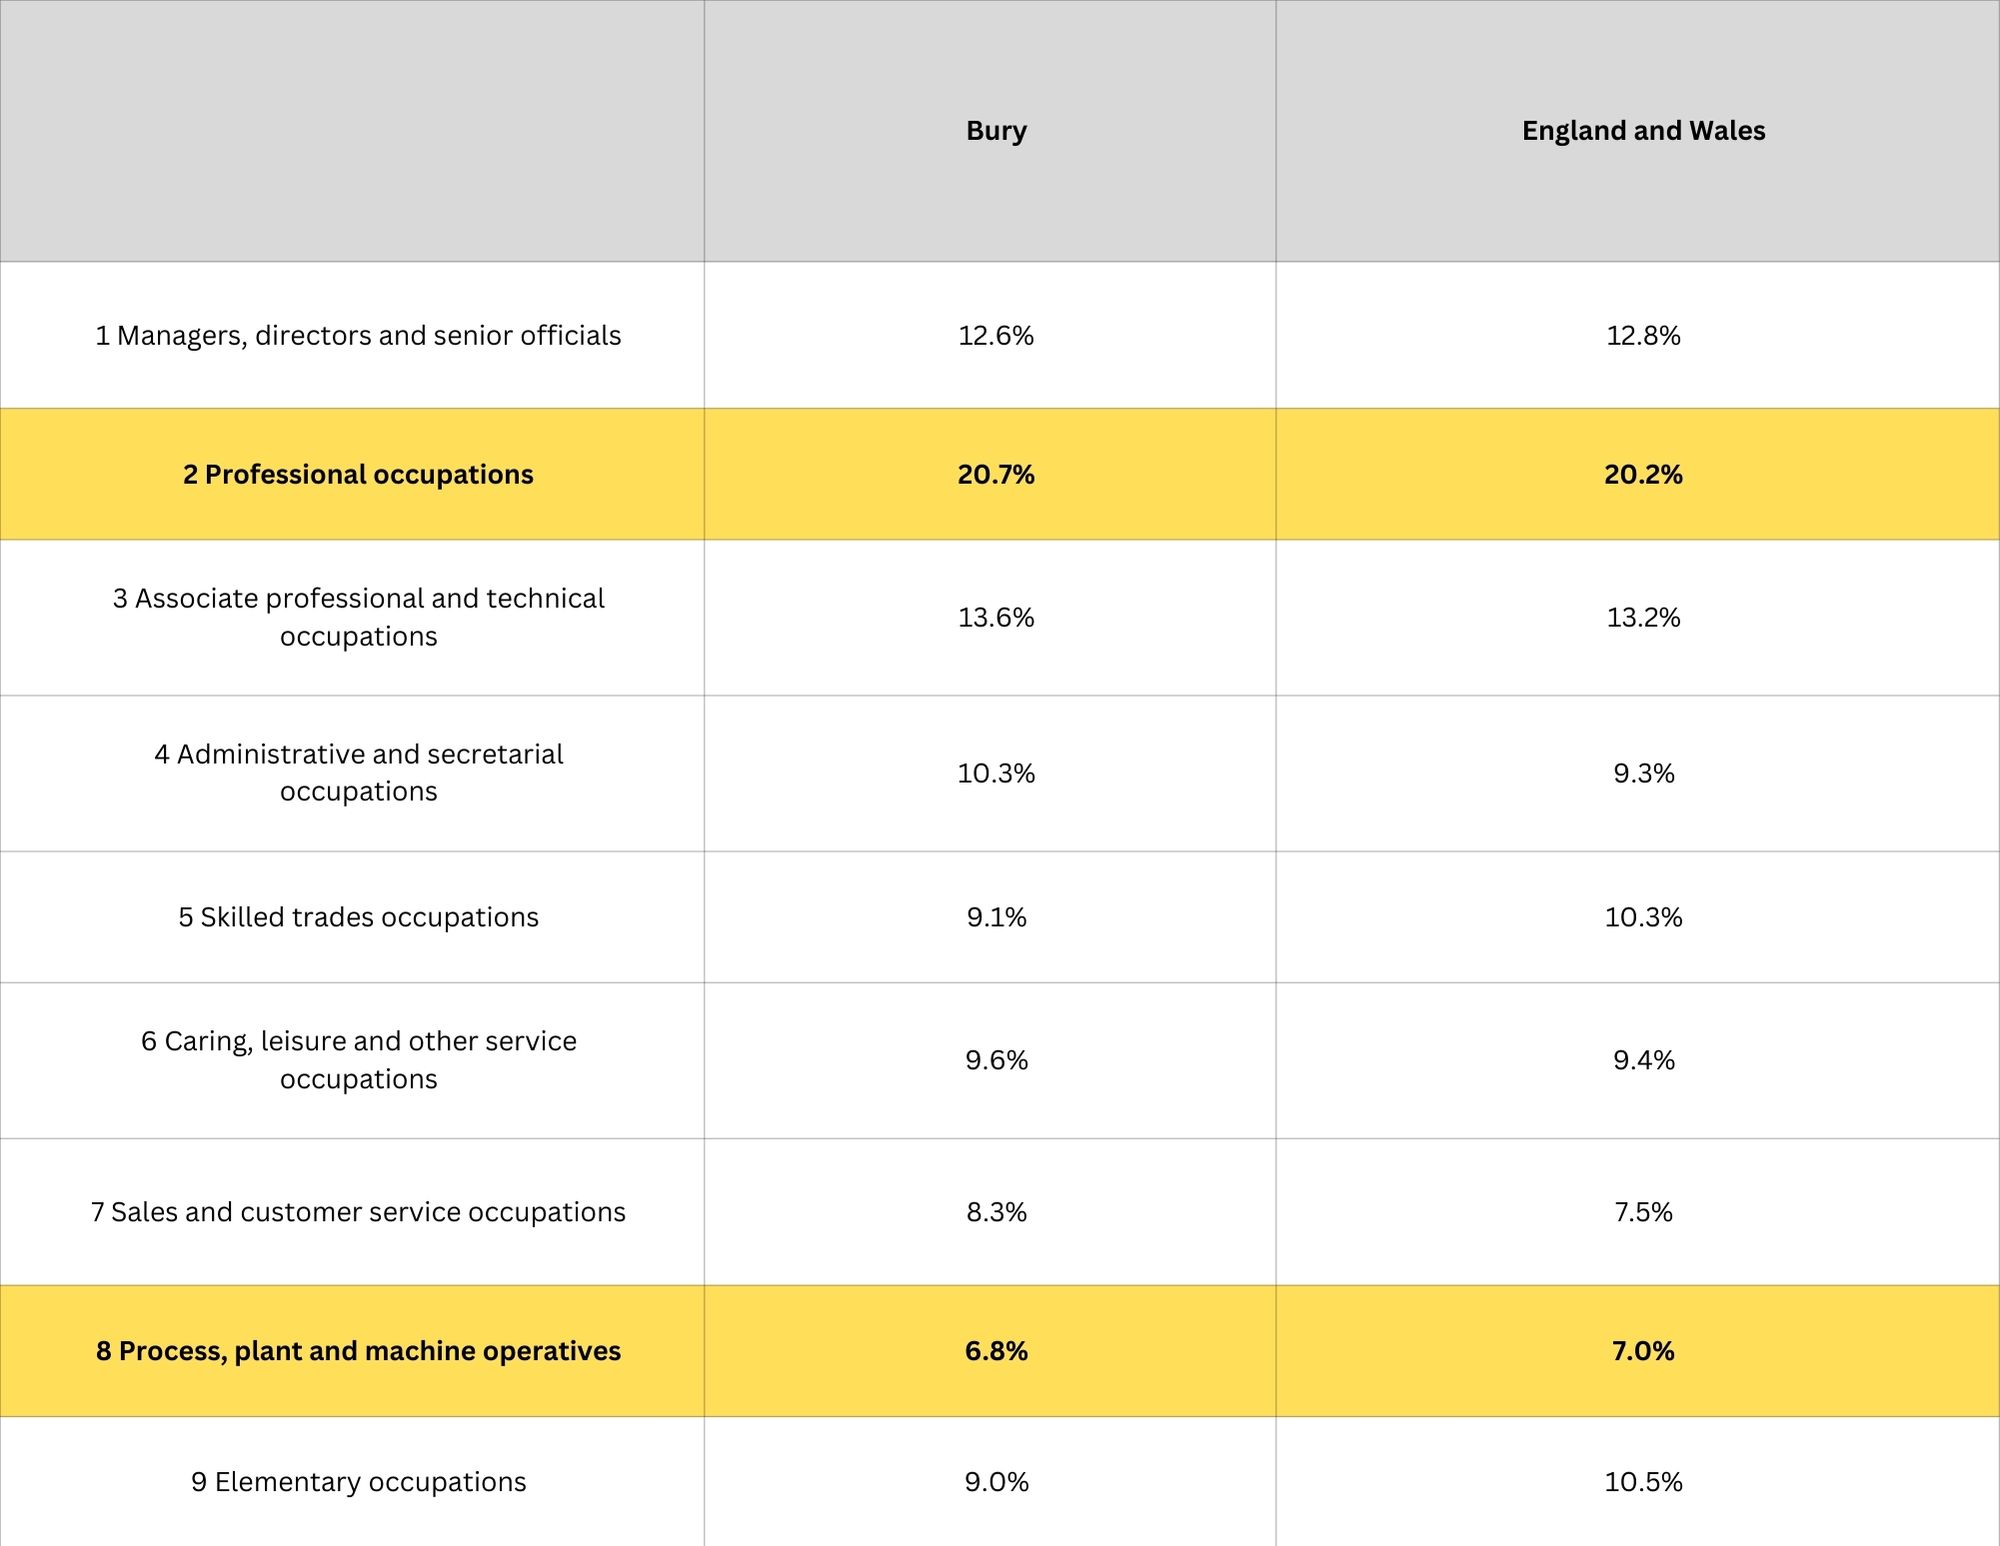
The broad category occupation with the highest percentage for both England & Wales and Bury was professional occupations. The category with the lowest percentage was also the same for both England & Wales and Bury – process, plant and machine operatives.
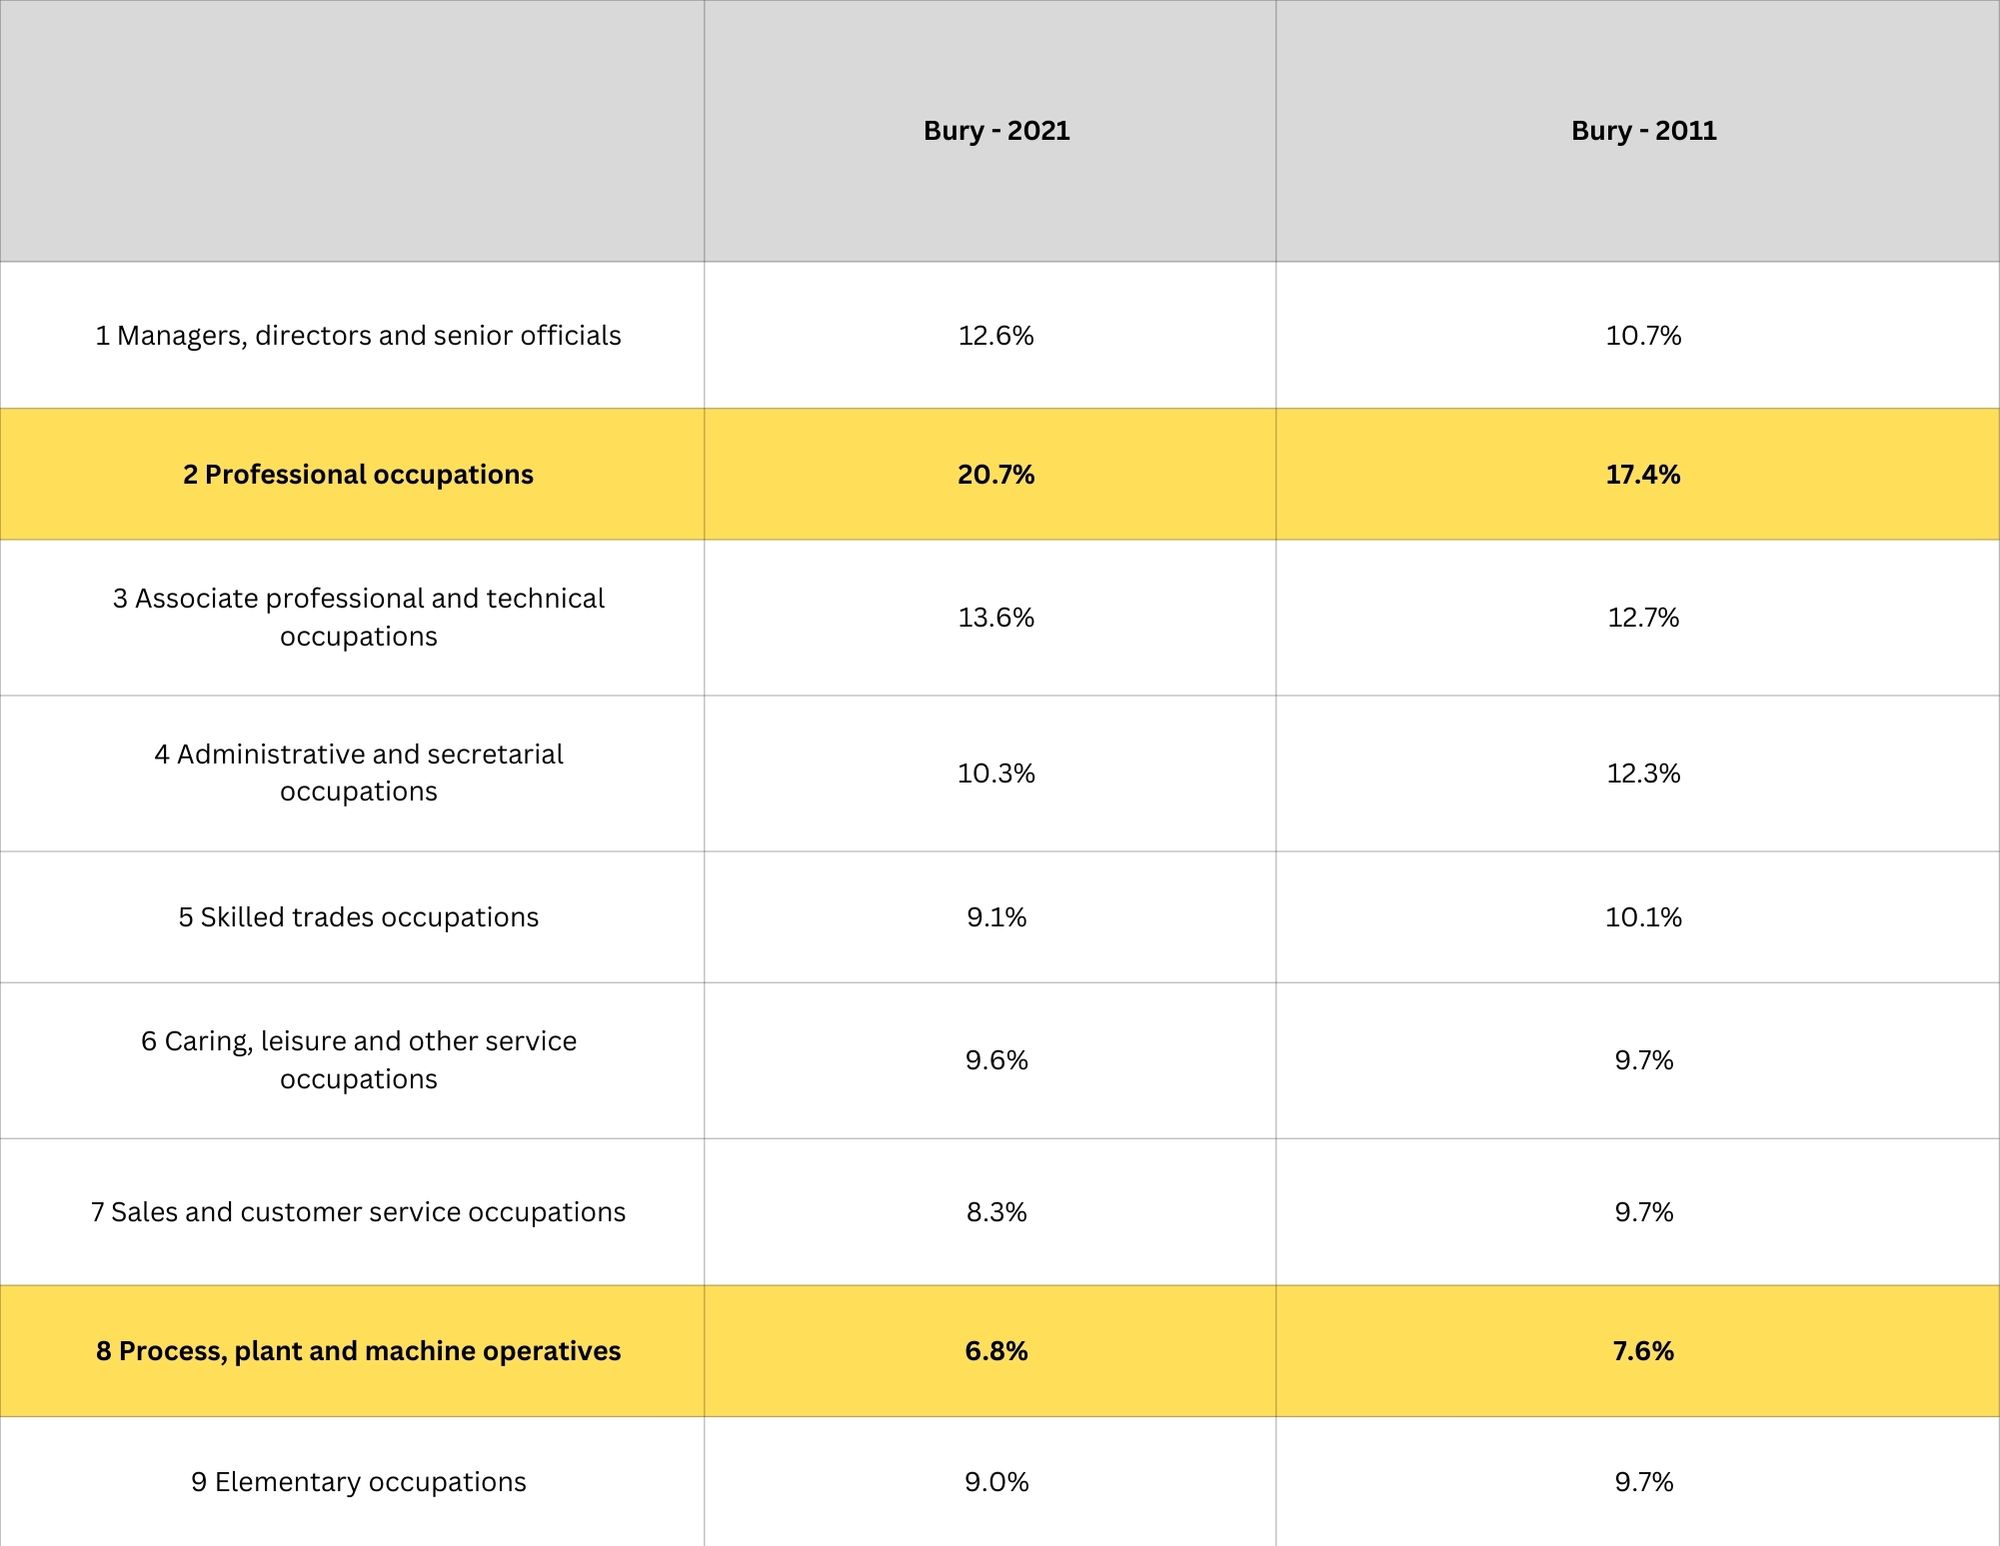
The table below compares the 9 categories for Bury in 2021 with 2011.
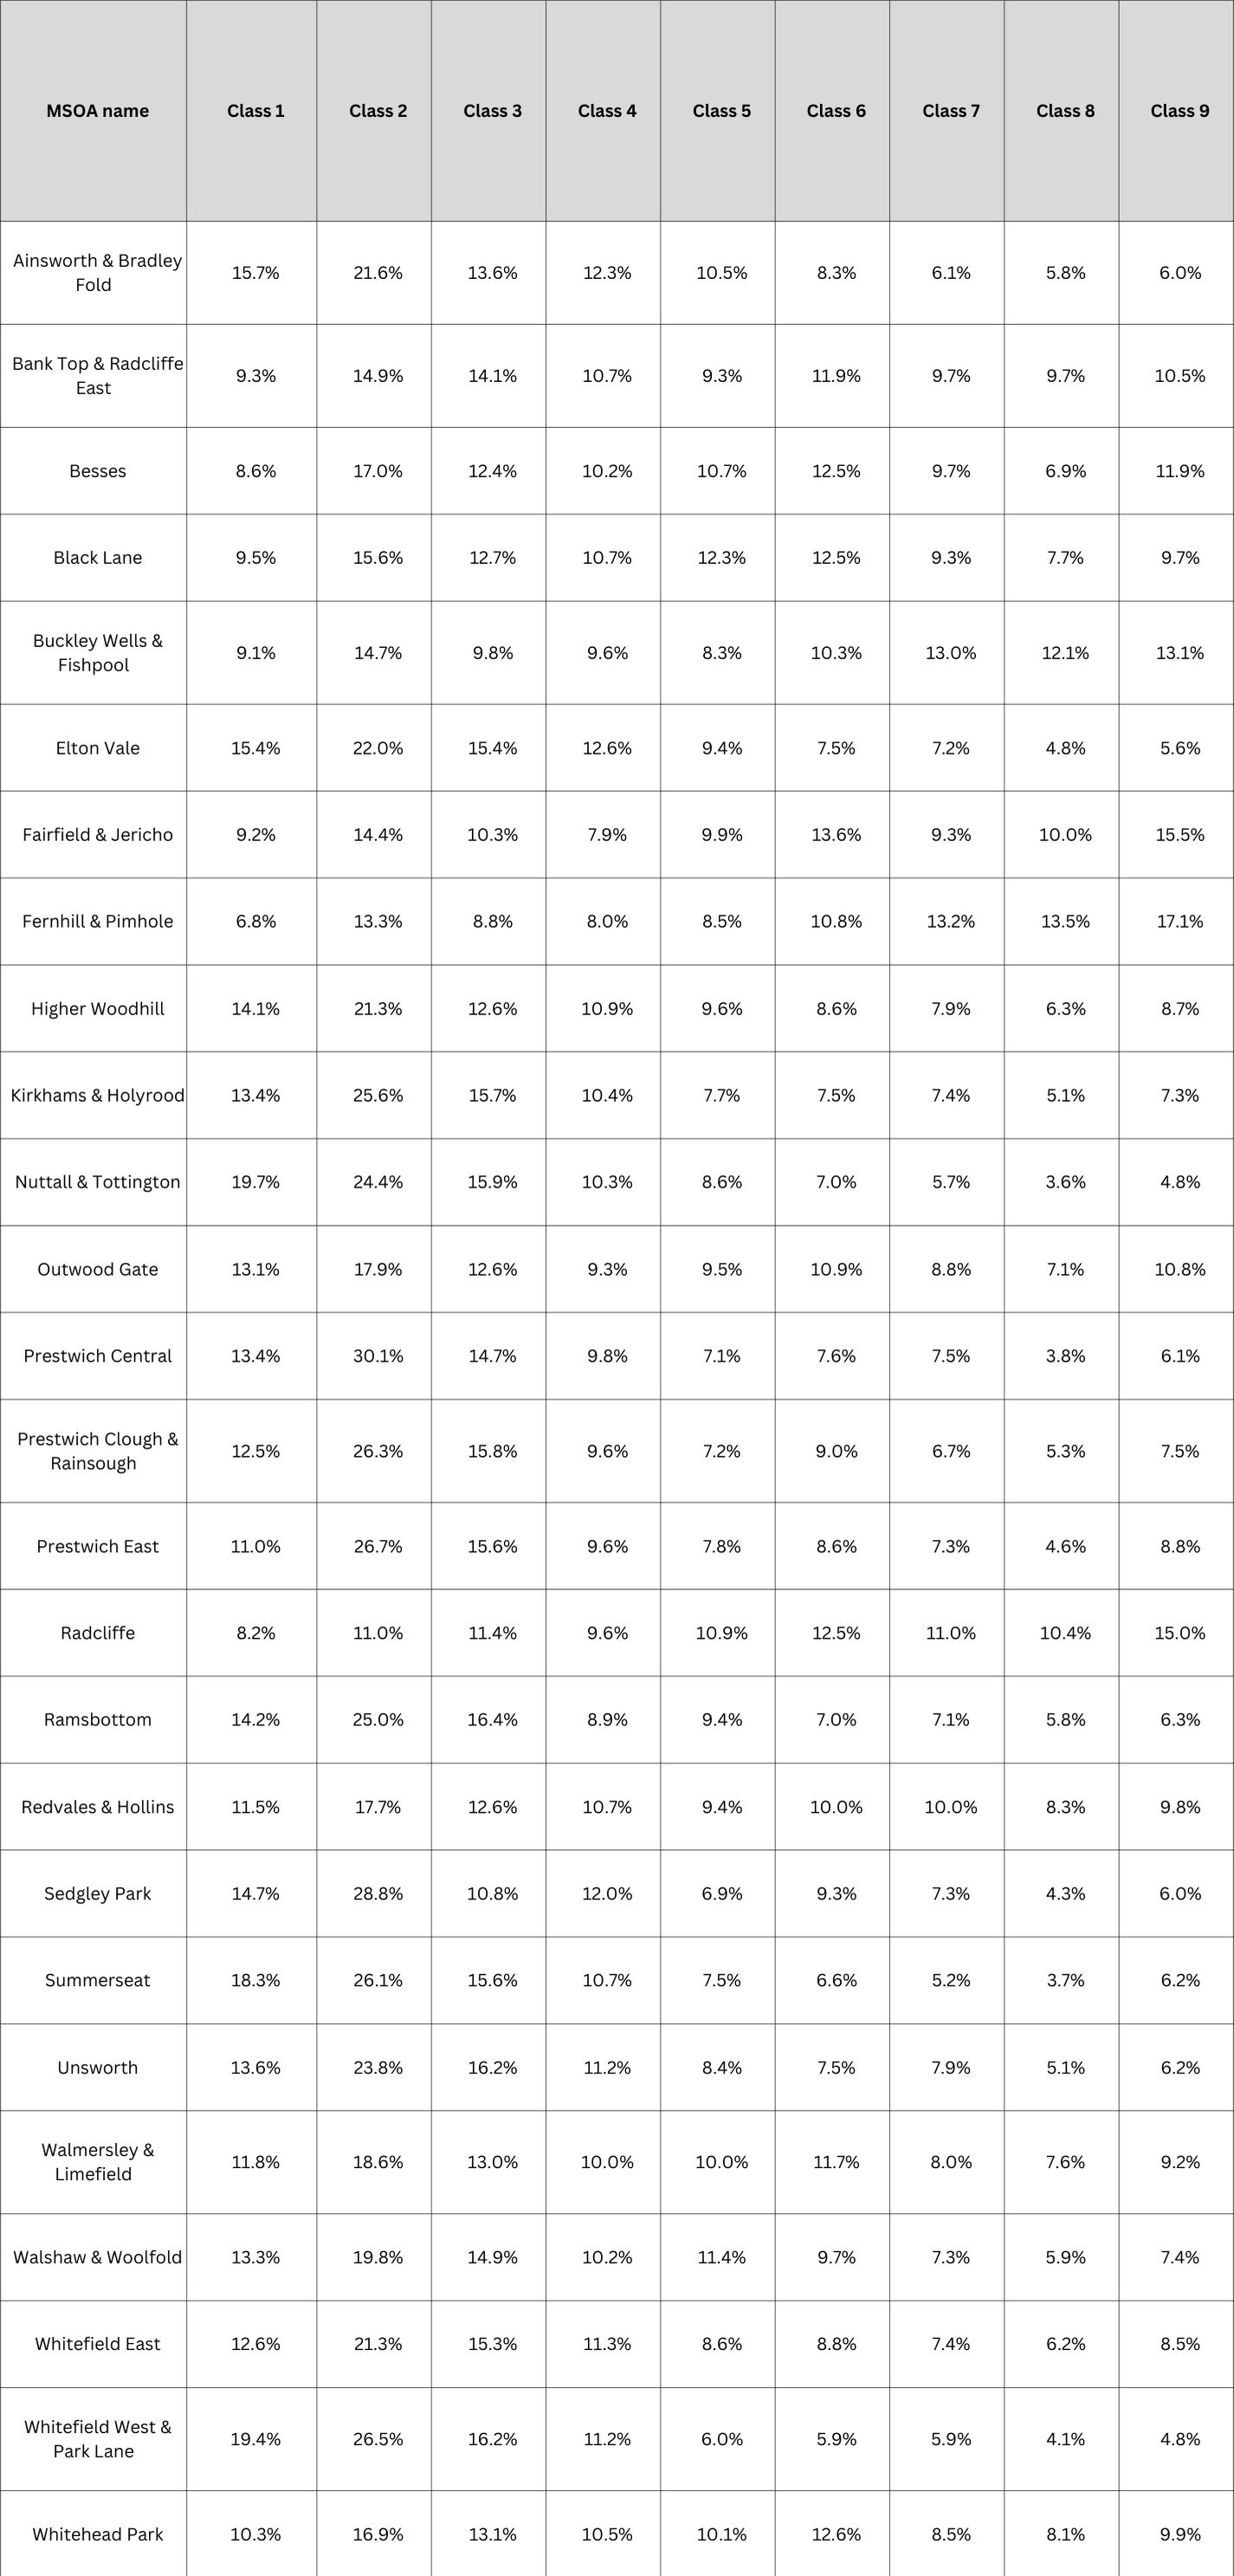
The table below shows occupation by MSOA in Bury.
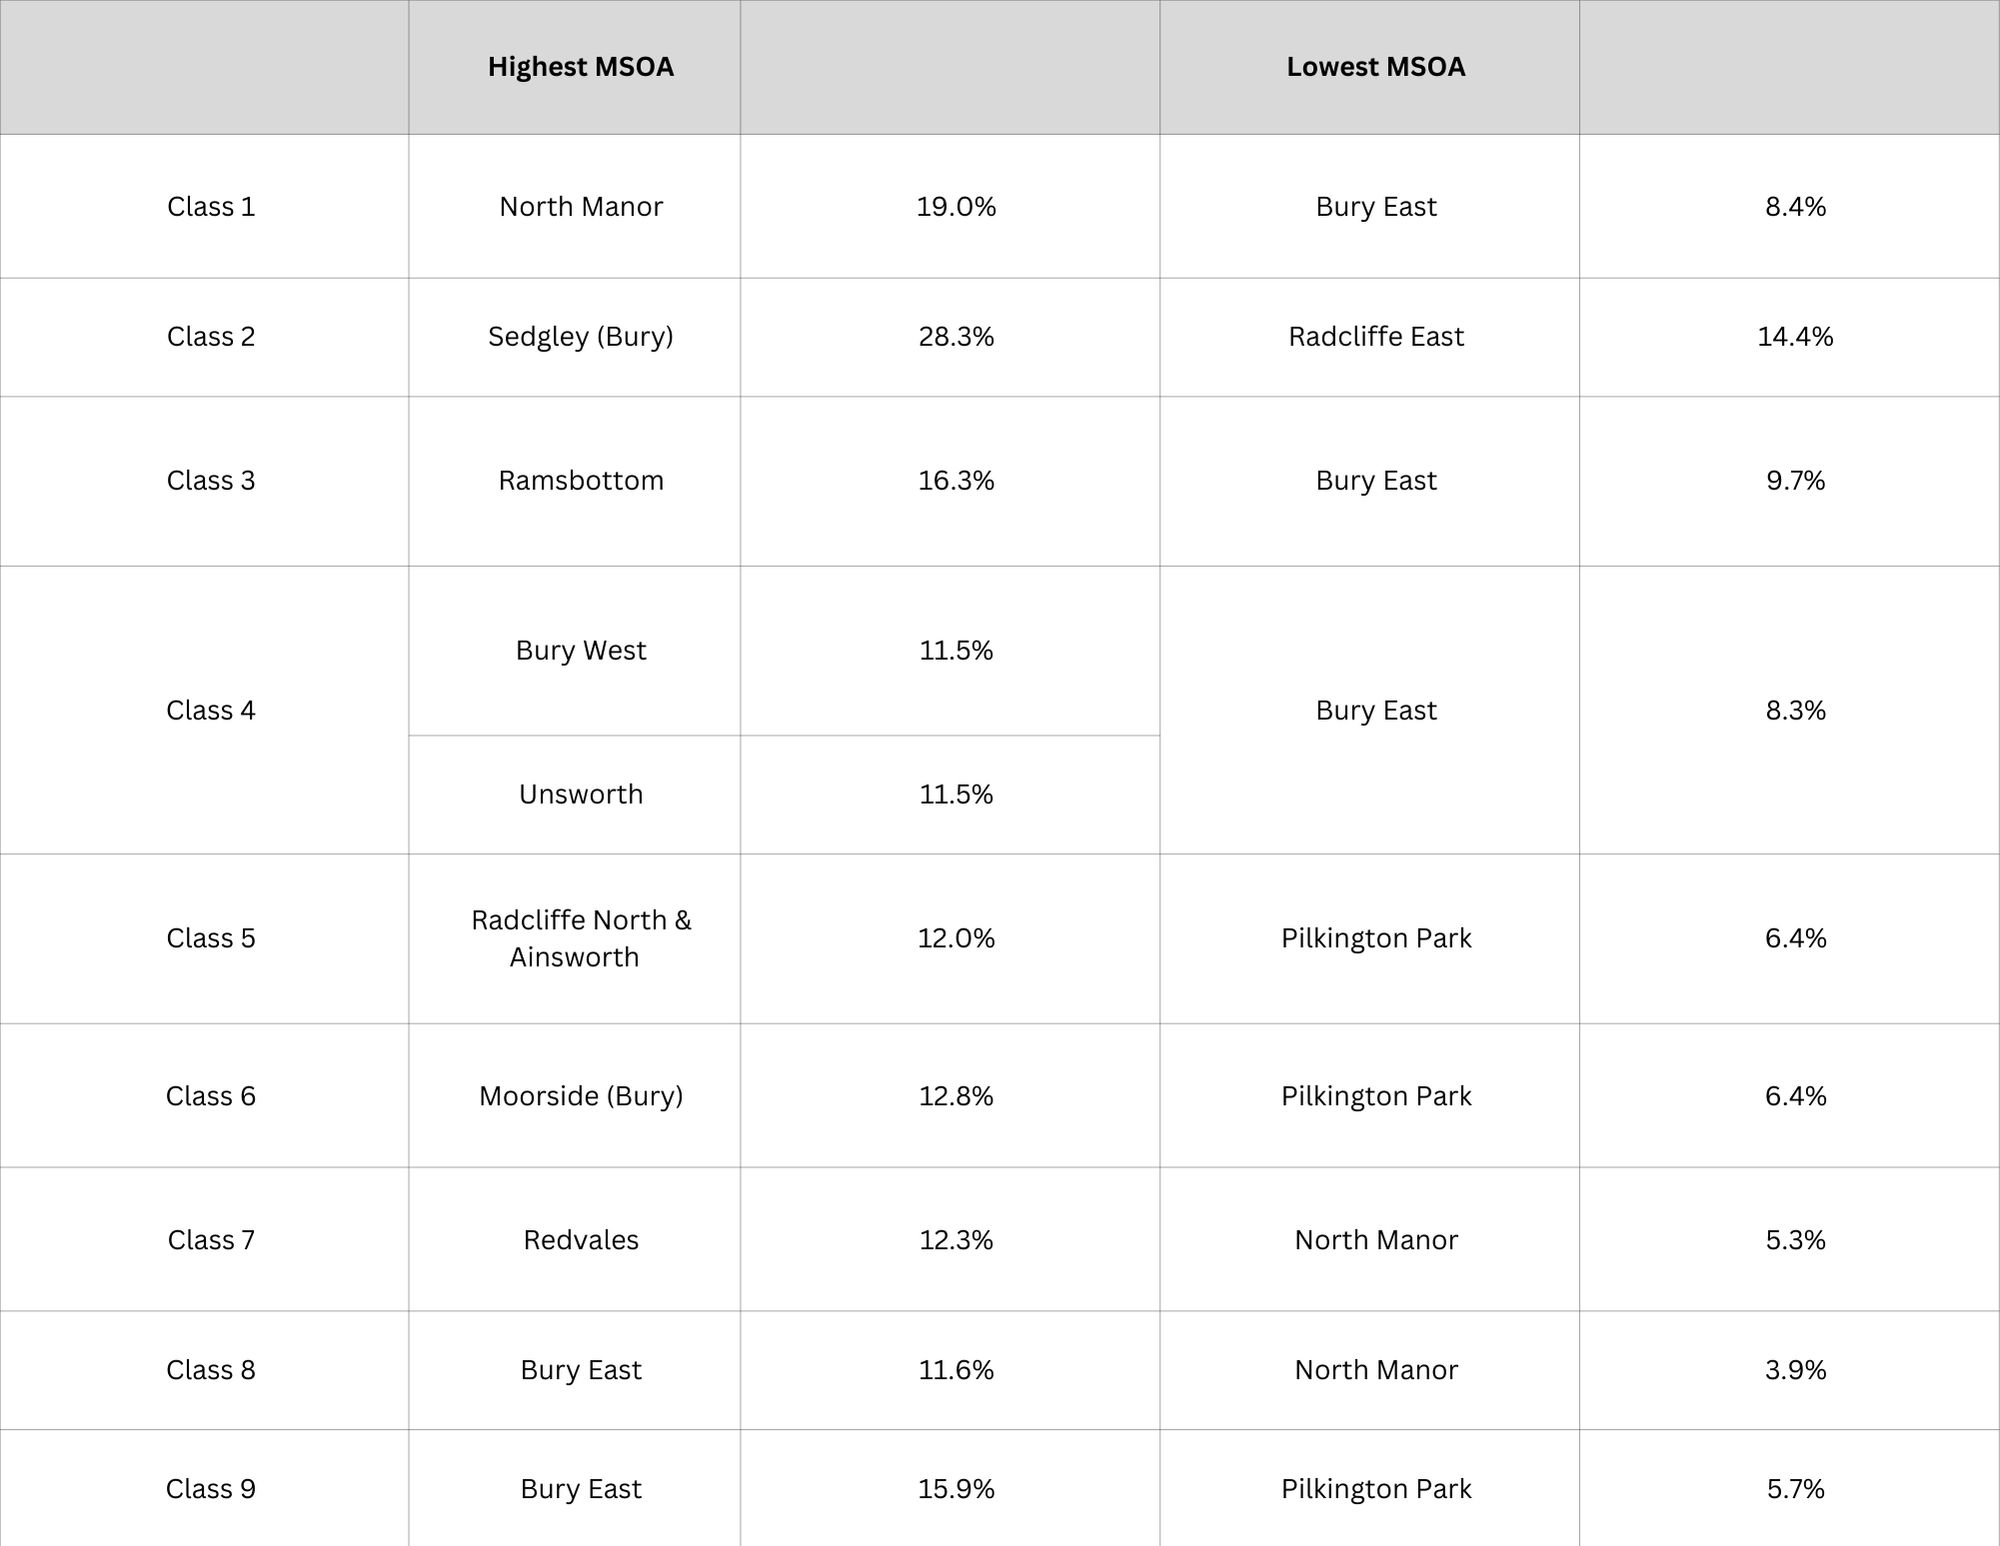
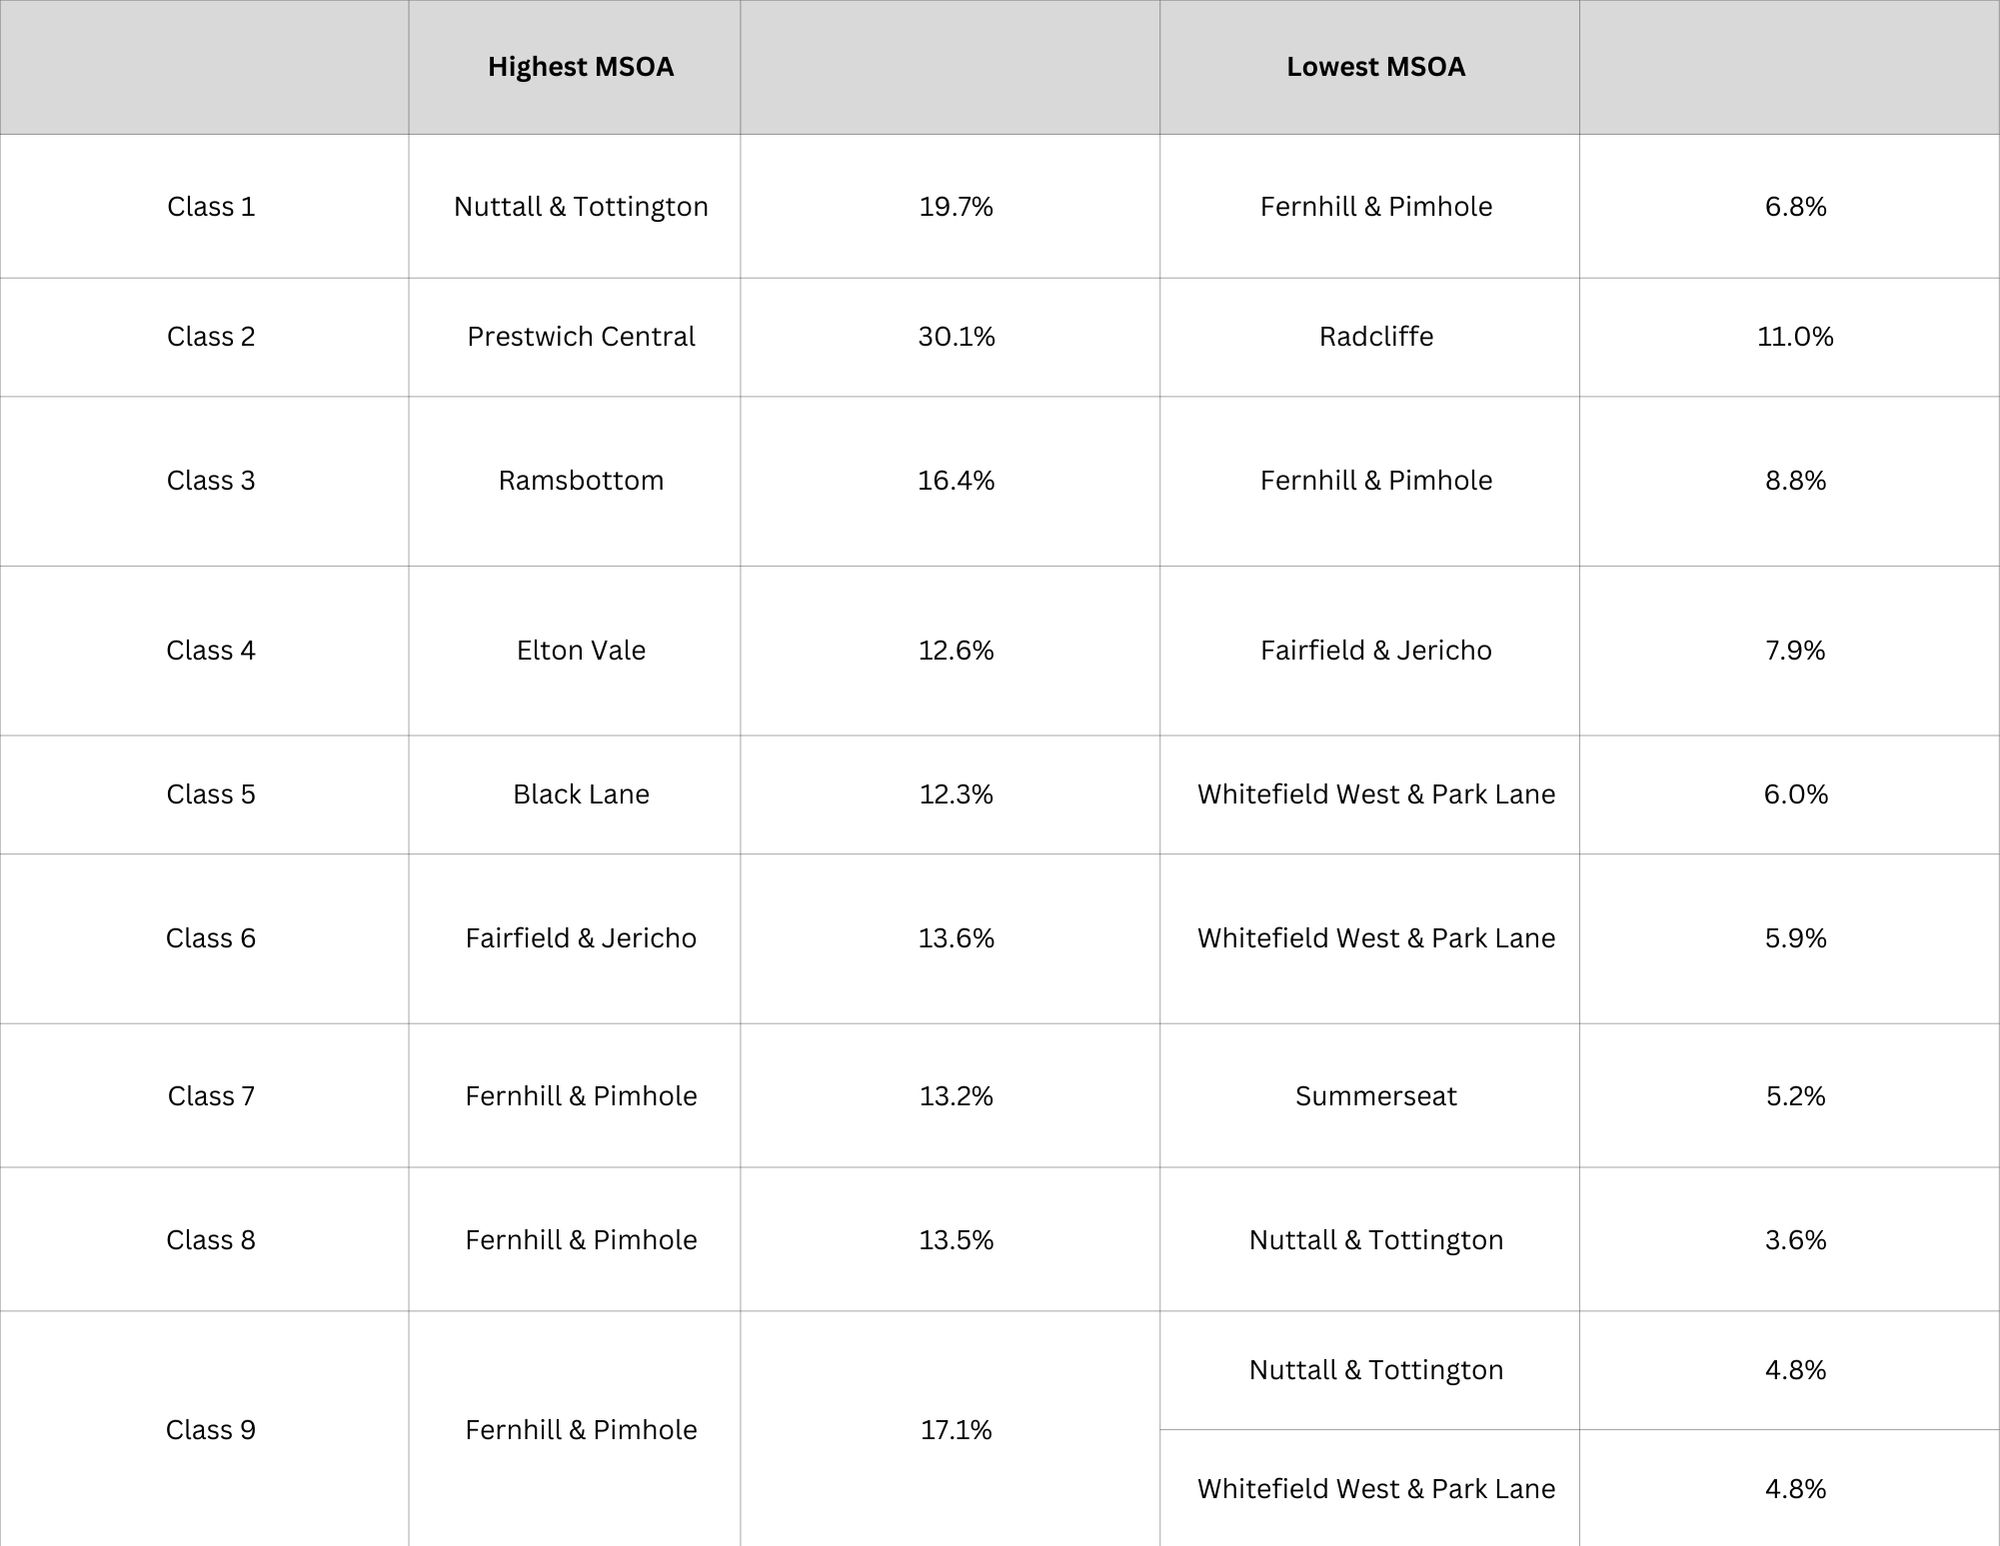
The MSOAs with the highest and lowest percentages for each occupation are shown below.
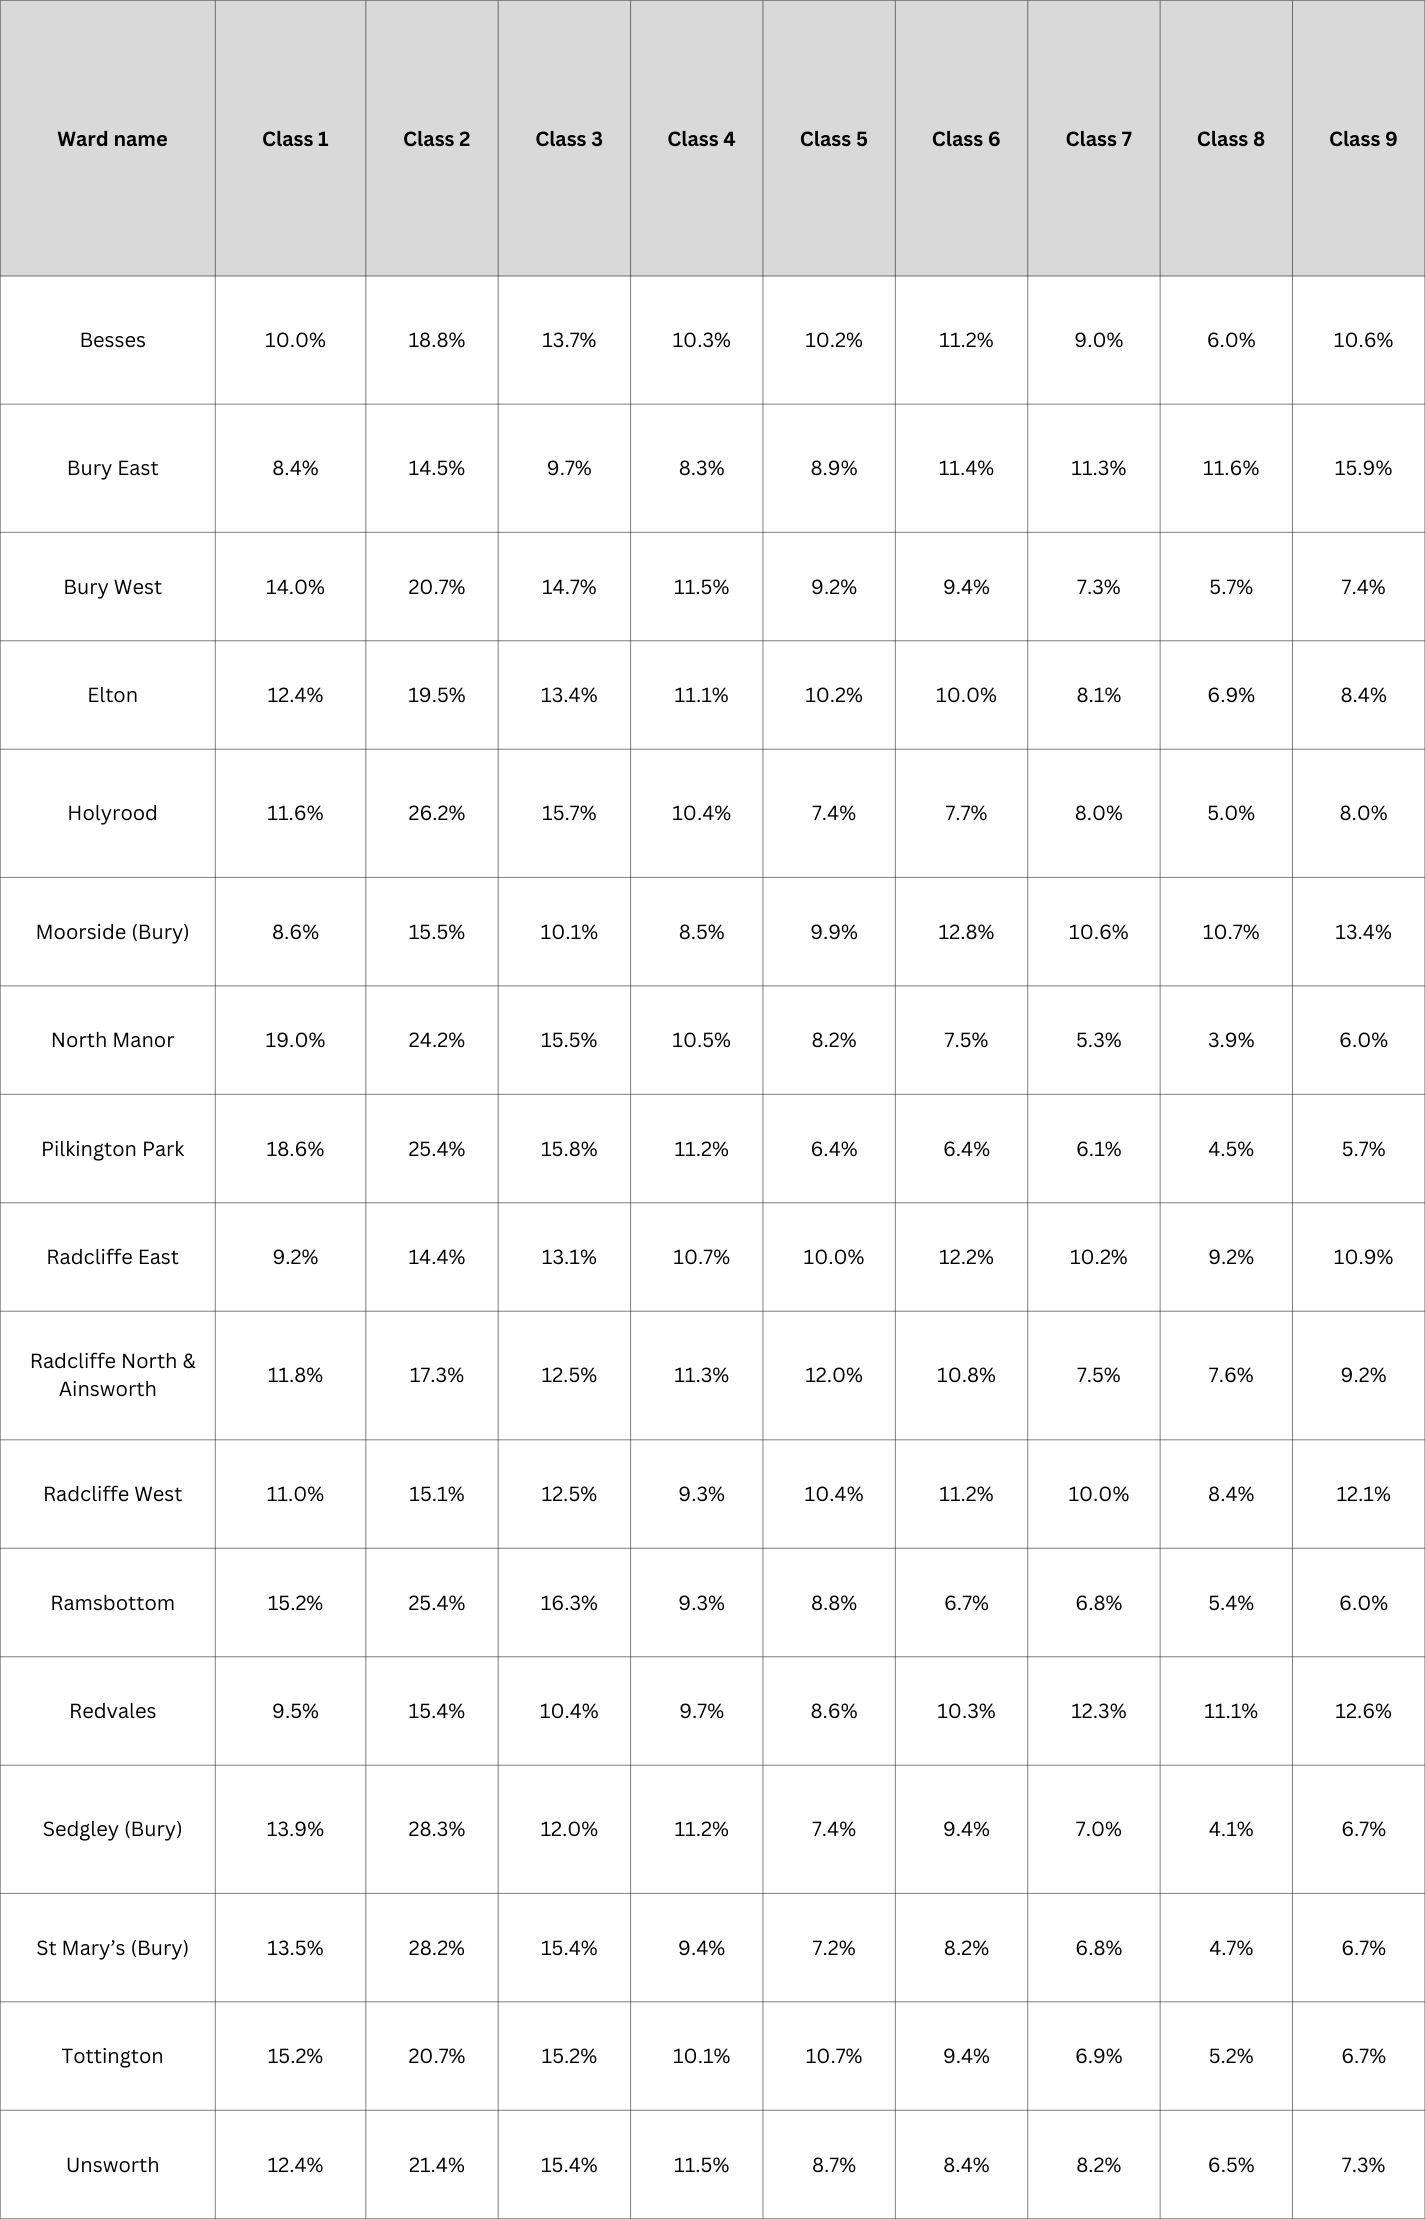
The table below shows occupation by ward.
The wards with the highest and lowest percentages for each occupation are shown below.