Age
Age
Age
-
 Age: An overview of the age profile of Bury's resident population and breakdown across broad age groups.
An overview of the age profile of Bury’s resident population is presented here, followed by the breakdown across broad age groups such as babies & infants, children, young people, working age adults and older people.
Based on the results of the Census 2021, the most common age of people living in Bury is 56 years. The median age (age that divides a population into two numerically equally sized groups; that is, half the people are younger than this age and half are older) of people living in Bury is 40 years, similar to England and Wales and the same as the figure for Bury in the 2011 census.
Within Bury, Summerseat and Elton Vale are the areas with the highest median age of 51 years, whereas Sedgley Park has the lowest median age of 30 years. Table 1 below shows the median age for people living in each Middle Super Output Area (MSOA) in Bury.
Table 1: Median age in each MSOA in Bury (Census 2021)
-
.jpg) To download a copy of this table, please left click the button below or use the 'Related Files' section located at the bottom of the page.
To download a copy of this table, please left click the button below or use the 'Related Files' section located at the bottom of the page.
The age groups with the greatest health needs tend to be the very young and the very old. The under-5 population in Bury is estimated at 11,157 (5.8% of total) and the over-90 population at 1,445 (0.7% of total).
Table 2 below presents a more detailed breakdown of Bury’s resident population by gender and five-year age group using Census 2021 data. The most common age 5 year age categories in Bury are 30-34 age band for all population (7%), 55-59 age band for males (7% of total male population) and 30-34 age bands for females (7.2% of total female population).
Table 2: Resident population of Bury by gender and 5-year age group (Census 2021)
-
-(297-×-557-mm)-(397-×-557-mm)-(1).jpg) To download a copy of this table, please left click the button below or use the 'Related Files' section located at the bottom of the page.
To download a copy of this table, please left click the button below or use the 'Related Files' section located at the bottom of the page.
Figure 1 below presents the population pyramid for Bury and compares the age distribution of Bury with England. When compared to England, Bury has a higher percentage of both males and females aged 0 to 14, aged 35-39, 45-49, 55-59, and aged 70-74.
For all other age groups, the distribution is similar to England.
Figure 1: Population pyramid presenting the percentage composition by 5-year age group and gender of resident population in Bury compared with England (Census 2021)
-
-(1500-×-1400-px).jpg) To download a copy of this diagram, please left click the button below or use the 'Related Files' section located at the bottom of the page.
To download a copy of this diagram, please left click the button below or use the 'Related Files' section located at the bottom of the page.
Age Groups
Breakdown of the Bury population through the life course is presented next using broad age groups such as babies & infants, children, young people, working age adults and older people. All results presented here are from Census 2021.
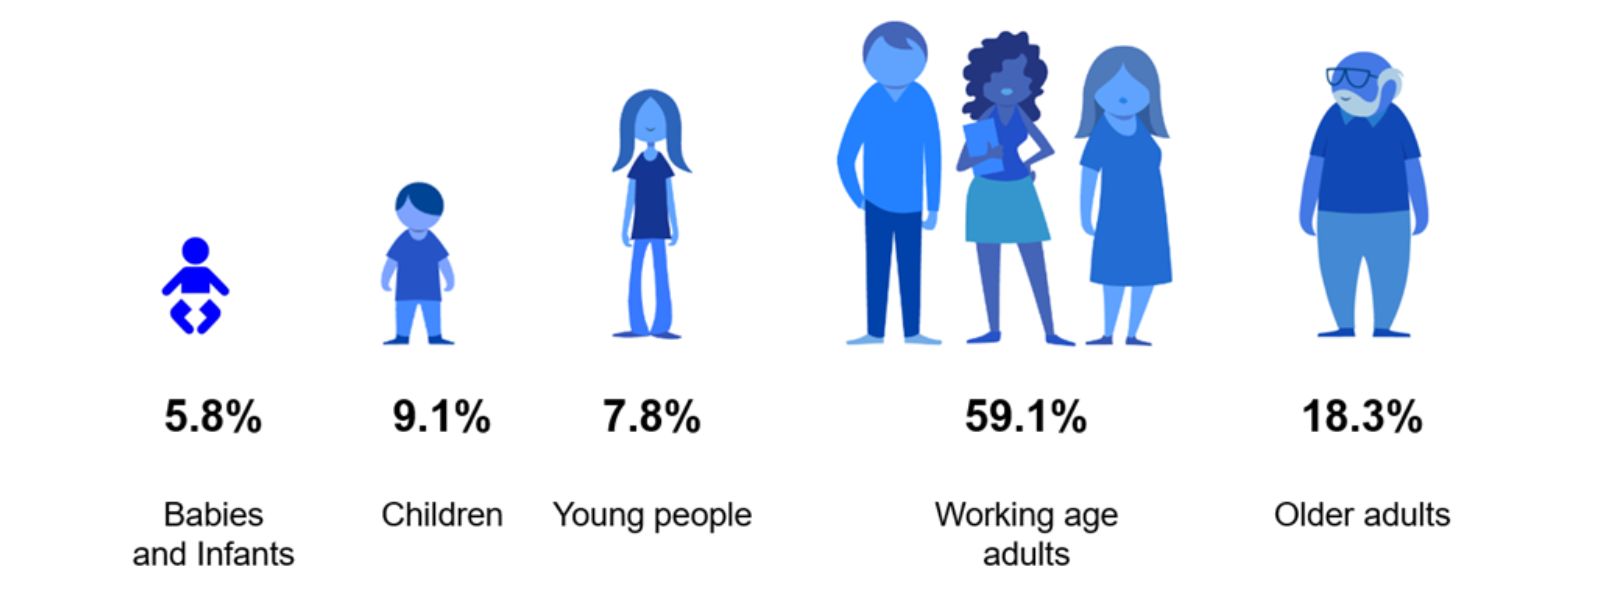
Over half (59%) of Bury’s resident population is of working age (18-64 years), 5.8% are babies and infants (0-4 years), 9.1% are children (5-11 years), 7.8% are young people (12-17 years) and 18.3% are older adults (65+ years) (Figure 2).
Figure 2: Percentage of Bury population by broad age groups (Census 2021)
-
 To download a copy of this diagram, please left click the button below or use the 'Related Files' section located at the bottom of the page.
Babies & infants (0-4 years of age)
Bury has 11,157 babies and infants (0-4 years of age) in 2021. Babies and infants represent 5.8% of the total population in Bury similar to England average of 5.4%. Sedgley park has the highest proportion of babies and infant, where 9.1% of total population are under 5 years of age, whereas the lowest proportion (3.3%) of under 5 years of age is in Summerseat. Figure 3 below presents the proportion of population aged 0-4 years living in each Middle Super Output Area (MSOA) in Bury as a percentage of the total population in that MSOA.
Figure 3: Proportion of population aged 0-4 years living in each Middle Super Output Area (MSOA) in Bury as a percentage of the total population in that MSOA (Census 2021)
-
-in-Bury-as-a-percentage-of-the-total-population-in-that-MSOA-(Census-2021).jpg) To download a copy of this diagram, please left click the button below or use the 'Related Files' section located at the bottom of the page.
To download a copy of this diagram, please left click the button below or use the 'Related Files' section located at the bottom of the page.
Children (5-11 years of age)
There are 17,688 children (5-11 year olds) representing 9.1% of the population in Bury higher than the England average of 7.2%. Sedgley park has the highest proportion of children (15.3%), whereas the lowest proportion is in Elton Vale and Nuttall & Tottington (7.4%). Figure 4 below presents the proportion of population aged 5-11 years living in each Middle Super Output Area (MSOA) in Bury as a percentage of the total population in that MSOA.
Figure 4: Proportion of population aged 5-11 years living in each Middle Super Output Area (MSOA) in Bury as a percentage of the total population in that MSOA (Census 2021)
-
-in-Bury-as-a-percentage-of-the-total-population-in-that-MSOA-(Census-2021).jpg) To download a copy of this diagram, please left click the button below or use the 'Related Files' section located at the bottom of the page.
To download a copy of this diagram, please left click the button below or use the 'Related Files' section located at the bottom of the page.
Young People (12-17 years)
There are 15,031 young people in Bury, accounting for 7.8% of the total population in the borough slightly higher than England average of 7%. The highest proportion of young people is in Sedgley park with 27.5% of the population aged 12-17 years, nearly 3.5 times higher than the average for Bury, followed by Prestwich Central (15.4%). Kirkhams and Holyrood and Whitefield East (6.3) have the lowest proportion of young people. Figure 5 below presents the proportion of population aged 12-17 years living in each Middle Super Output Area (MSOA) in Bury as a percentage of the total population in that MSOA.
Figure 5: Proportion of population aged 12-17 years living in each Middle Super Output Area (MSOA) in Bury as a percentage of the total population in that MSOA (Census 2021)
-
-in-Bury-as-a-percentage-of-the-total-population-in-that-MSOA-(Census-2021).jpg) To download a copy of this diagram, please left click the button below or use the 'Related Files' section located at the bottom of the page.
To download a copy of this diagram, please left click the button below or use the 'Related Files' section located at the bottom of the page.
Working age adults (18-64 years)
Bury has 114,526 (59.1%) working age adults, slightly lower than England average of 60.7%. Fernhill and Primhole has the highest proportion (63.5%) of population aged 18-64 years and Elton Vale and Sommerset (50.6%) have the lowest proportion of working age adults. Figure 6 below presents the proportion of population aged 18-64 years living in each Middle Super Output Area (MSOA) in Bury as a percentage of the total population in that MSOA.
Figure 6: Proportion of population aged 18-64 years living in each Middle Super Output Area (MSOA) in Bury as a percentage of the total population in that MSOA (Census 2021)
-
-in-Bury-as-a-percentage-of-the-total-population-in-that-MSOA-(Census-2021).jpg) To download a copy of this diagram, please left click the button below or use the 'Related Files' section located at the bottom of the page.
To download a copy of this diagram, please left click the button below or use the 'Related Files' section located at the bottom of the page.
Older adults (65 years and over)
There are 35,447 (18.3%) older adults in Bury, similar to England average of 18.4%. Elton Vale (31.3%) and Summerseat (31.1%) have the highest proportion and Fernhill and Pimhole (9.6%) have the lowest proportion of older adults in Bury. Figure 7 below presents the proportion of population aged 65 years and over living in each Middle Super Output Area (MSOA) in Bury as a percentage of the total population in that MSOA.
Figure 7: Proportion of population aged 65 years and over living in each Middle Super Output Area (MSOA) in Bury as a percentage of the total population in that MSOA (Census 2021)
-
-in-Bury-as-a-percentage-of-the-total-population-in-that-MSOA-(Census-2021).jpg) To download a copy of this diagram, please left click the button below or use the 'Related Files' section located at the bottom of the page.
To download a copy of this diagram, please left click the button below or use the 'Related Files' section located at the bottom of the page.
Population change in Bury comparing Census 2021 to Census 2011
The resident population of Bury is estimated to have increased by 4.7%, from around 185,100 in 2011 to 193,800 in 2021, slightly lower than growth of Northwest (5.2%) and England (6.6%). Nearby areas like Salford and Manchester have seen their populations increase by around 15.4% and 9.7%, respectively, while others such as Blackburn with Darwen saw an increase of 5.0% and Rossendale saw smaller growth (4.1%).
The population change in Bury is not uniform across all age groups. Table 3 below presents Bury ‘s population by broad age group with percentage change across these groups and comparison with England between Census 2011 and Census 2021.
Table 3: Bury‘s population by broad age group with percentage change across these groups and comparison with England between Census 2011 and Census 2021.
-
.jpg) To download a copy of this table, please left click the button below or use the 'Related Files' section located at the bottom of the page.
To download a copy of this table, please left click the button below or use the 'Related Files' section located at the bottom of the page.
Bury population has continued to age. Census 2021 results show that there has been an increase of 19.8% in people aged 65 years and over in Bury similar to 20.1% seen in England. Bury’s working age population has increased slightly (0.8%) compared with a 3.9% increase across England. The largest percentage change was a 20.1% increase in the 65 years and over age group, followed by a 13.6% increase in 5-11 years age group. Conversely there was a percentage decrease in the number of babies and infants (-7.3%).