Alcohol
Alcohol
Alcohol
Alcohol
Alcohol misuse is the fifth biggest cause of death, ill health, and disability across all ages, and the biggest cause among 15–49-year-olds in the UK. Alcohol causes more than 60 medical conditions, including: mouth, throat, stomach, liver and breast cancers, high blood pressure, cirrhosis of the liver, and depression. Alcohol is also an important contributor to health inequalities: alcohol-related mortality increases with increasing deprivation and is higher in men than women.
Alcohol consumption, risky drinking, and deaths linked to alcohol increased nationally during the COVID-19 pandemic, particularly among people from lower socioeconomic positions and among women (Jackson et al, 2022; Angus et al, 2023). Alcohol-related illness and deaths are therefore likely to increase in the coming years.
This section provides information on the picture for Bury regarding alcohol, and how Bury compares to England and the North West. It summarises headline measures of alcohol-related deaths, alcohol-related illnesses and hospital admissions, and on measures of alcohol treatment access and success.
Risk
According to the NHS website, in order to keep health risks from alcohol to a low level if you drink most weeks, men and women are advised not to drink more than 14 units a week on a regular basis.
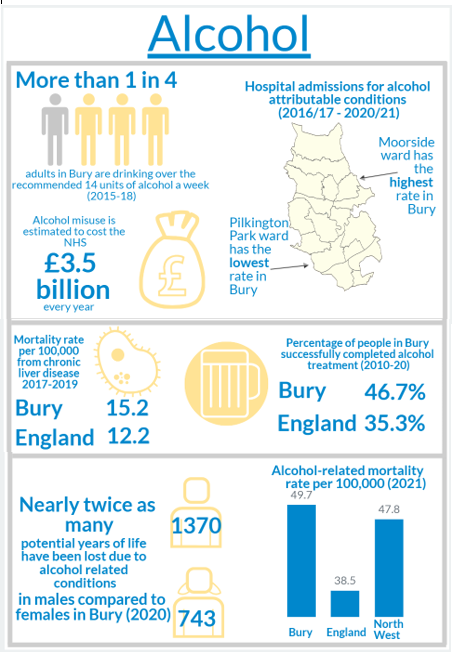
28.6% of adults in Bury drink over the recommended 14 units of alcohol a week (2015-18), which is statistically similar to the figure for England of 22.8% and for the North West of 25.7% (Public Health Profiles). Although it is considered not significantly different to the figures seen nationally and regionally, it is important to note that more than 1 in 4 adults in Bury are drinking over the recommended amount of alcohol.
Alcohol related mortality
Bury is significantly worse than England and worse than the North West region for alcohol-related mortality for 2021. This refers to deaths from alcohol-related conditions, all ages, and is a directly age-standardised rate per 100,000 population. Deaths from alcohol-related conditions are based on underlying cause of death, registered in the calendar year for all ages. Each alcohol related death is assigned an alcohol attributable fraction based on underlying cause of death (and all cause of deaths fields for the conditions: ethanol poisoning, methanol poisoning, toxic effect of alcohol). Table 1 below illustrates the rates of alcohol-related mortality in Bury, England and the North West. This indicator is currently only presenting data for 2021, as previous time periods are not currently available to allow a comparison over time. This is due to the fact that the official population estimates for mid-2012 to mid-2020 will be revised, in order to incorporate the data now available from Census 2021. Once revised populations for mid-2012 to mid-2020 are published, the updated back series for this indicator will be published (Local Alcohol Profiles for England).
Table 1: Alcohol-related mortality (Persons) for Bury and England, 2021. Directly standardised rate – per 100,000

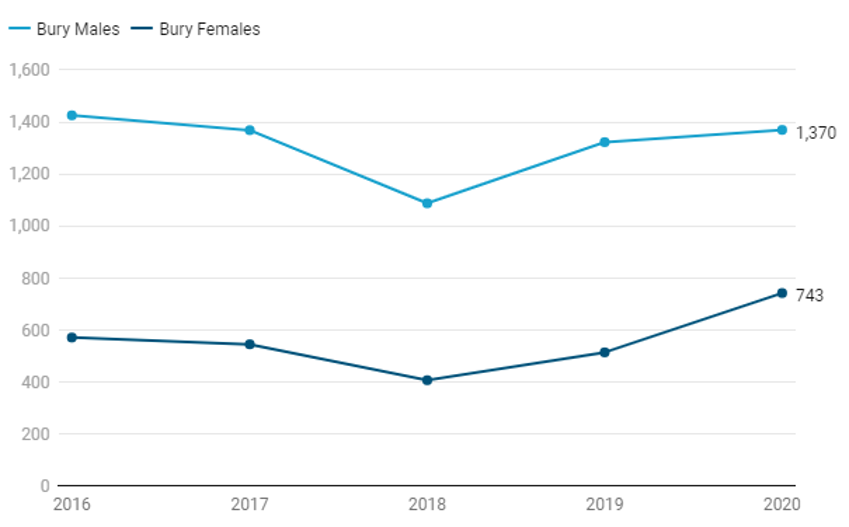
There is a significant difference in the potential years of life lost (PYLL) due to alcohol-related conditions between males and females in Bury, consistent with the trend seen across both England and the North West region. PYLL is a measure of the potential number of years lost when a person dies prematurely. The basic concept of PYLL is that deaths at younger ages are weighted more heavily than those at older ages (Public Health Profiles). Figure 2 below shows that since 2016, more than twice as many lost potential years of life due to alcohol-related conditions in males than females in Bury. Despite an initial decrease in potential years of life lost between 2016-2018, there has since been an increase in Bury for both males and females in this measure.
Figure 2: Potential years of life lost due to alcohol-related conditions, Bury 2016-2020, Males and Females. Directly standardised rate – per 100,000
Liver disease is one of the top causes of death in England and people are dying from it at younger ages. Most liver disease is preventable and much is influenced by alcohol consumption and obesity prevalence. Bury is not significantly different to England and the North West region for mortality from chronic liver disease. Table 2 below illustrates that the rate of mortality from chronic liver disease in Bury has been declining since a spike in 2014-16, with the exception of a slight increase in 2017-19. The increase in 2017-19 is inconsistent with the trend seen both nationally and regionally, where both rates decreased slightly (Public Health Profiles).
Table 2: Mortality from chronic liver disease (Persons, 3 year range) Directly standardised rate – per 100,000

The mortality rate for those aged under 75 from alcoholic liver disease is not significantly different in Bury than England (directly standardised rate per 100,000) (Public Health Profiles). The rate has been decreasing steadily in Bury since 2014-16, consistent with the trend seen in the North West. The figure for England increased slightly for the period 2015-17 but has remained the same since then, however it remains lower than the rate seen in Bury.
Alcohol-related hospital admissions
Alcohol consumption is a contributing factor to hospital admissions and deaths from a diverse range of conditions. Alcohol misuse is estimated to cost the NHS about £3.5 billion per year and society as a whole £21 billion annually.
Bury is significantly better than England for admission episodes for alcohol-specific conditions for 2021/22 (Public Health Profiles). This refers to admissions to hospital where the primary diagnosis or any of the secondary diagnoses are an alcohol-specific (i.e. wholly attributable to alcohol) condition and is a directly age standardised rate per 100,000 population. Table 3 below illustrates the figures for admission episodes for alcohol-specific conditions. This indicator is currently only presenting data for 2021, as previous time periods are not currently available to allow a comparison over time. This is due to the fact that the official population estimates for mid-2012 to mid-2020 will be revised, in order to incorporate the data now available from Census 2021. Once revised populations for mid-2012 to mid-2020 are published, the updated back series for this indicator will be published (Public Health Profiles).
Table 3: Admission episodes for alcohol-specific conditions (Persons), Bury and England, 2021/22. Directly standardised rate – per 100,000

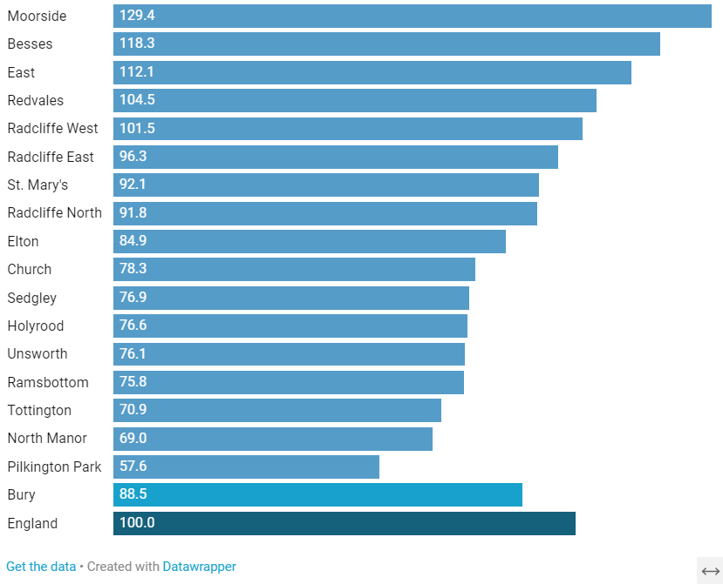
Geographical variations exist in rates of hospital stays for hospital admissions for alcohol attributable conditions within Bury, as illustrated in Figure 3 below. Fingertips provides small area data for hospital admissions for alcohol attributable conditions. However, there is a caveat that there are concerns about the data quality of this indicator due to the fact that there are significant differences across the country in the coding of cancer patients in the Hospital Episode Statistics. Since cancer admissions form part of the overarching alcohol-related admission national indicators, the inconsistent recording across the country for cancer patients has some implication for these headline measures. (Public Health Profiles). Rates for electoral wards within Bury are compared to England (with the England value set at 100). For the time period 2016/17 – 2020/21, Moorside and Besses wards are both significantly worse than England for this measure, whereas nine wards (Elton down to Pilkington Park in the bar chart below) are significantly better than England.
Figure 3: Hospital admissions for alcohol attributable conditions (Narrow definition), Wards in Bury, 2016/17 – 2020/21. Indirectly standardised ratio (per 100)
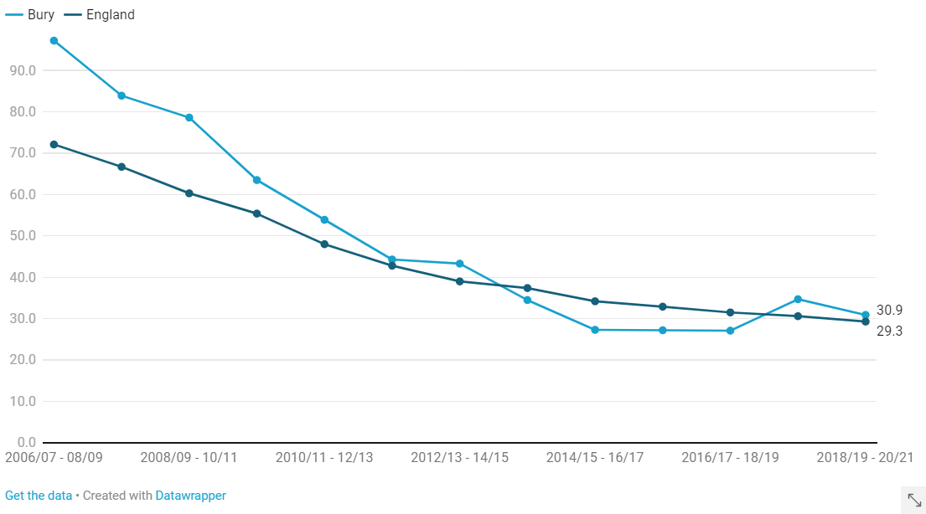
Admission episodes for alcohol-specific conditions for under 18s is not significantly different in Bury when compared to England for 2018/19 – 2020/21. Figure 4 below illustrates that Bury was initially significantly worse than England in 2006/07 – 2008/09, however it has consistently mirrored the downward trend seen nationally and is now statistically similar to England in this measure. Admission episodes in under 18s for alcohol-specific conditions in Bury has consistently remained lower than rates in the North West, which was decreasing until an upward turn in 2017/18 – 2019/20.
Figure 4: Admission episodes for alcohol-specific conditions - Under 18s (Persons) Bury and England, 2006/07 – 2020/21. Crude rate – per 100,000
Alcohol-related illnesses and harms
Bury is significantly better than England for the rate of admission episodes for mental and behavioural disorders due to use of alcohol (Broad definition), as illustrated in Table 4 below. This refers to admissions to hospital where the primary diagnosis or any of the secondary diagnoses are an alcohol-attributable mental and behavioural disorders due to use of alcohol code, and is a directly age standardised rate per 100,000 population. The broad definition means it is a measure of hospital admissions where either the primary diagnosis (main reason for admission) or one of the secondary (contributory) diagnoses is an alcohol-related condition. This represents a Broad measure of alcohol-related admissions but is sensitive to changes in coding practice over time. In general, the Broad measure gives an indication of the full impact of alcohol on hospital admissions and the burden placed on the NHS. Bury has the fifth lowest rate of admission episodes for this measure when compared to its statistical neighbours (Public Health Profiles).
Table 4: Admission episodes for mental and behavioural disorders due to use of alcohol (Broad) (Persons), Directly standardised rate - per 100,000, Bury and England, 2021/22

Bury is statistically similar to England for 2021/22 for the admission rate for intentional self-poisoning by and exposure to alcohol (Narrow) (Persons), with 27.5 per 100,000 and 33.7 per 100,000 respectively. This refers to admissions to hospital where the secondary diagnoses is an alcohol-attributable intentional self-poisoning by and exposure to alcohol code, and is a directly age standardised rate per 100,000 population. A Narrow definition means that it is a measure of hospital admissions where the primary diagnosis (main reason for admission) is an alcohol-related condition. This represents a Narrower measure. Since every hospital admission must have a primary diagnosis it is less sensitive to coding practices but may also understate the part alcohol plays in the admission. Bury has the fourth lowest rate of admissions in this measure when compared to its statistical neighbours (Public Health Profiles). The rate of admissions to hospital for this measure is higher amongst females in Bury compared to males, as illustrated in Table 5 below (Public Health Profiles).
Table 5: Admission episodes for intentional self-poisoning by and exposure to alcohol (Narrow), Directly standardised rate - per 100,000, Males and Females in Bury, 2021/22

Bury is statistically similar to England for the rate of admission episodes for alcohol-related cardiovascular disease (Broad) for 2021/22, with Bury being 763 per 100,000 and England 759 per 100,000. This refers to admissions to hospital where the primary diagnosis or any of the secondary diagnoses are an alcohol-attributable cardiovascular disease code, and is a directly age standardised rate per 100,000 population. There is a significantly higher rate of admissions for this measure amongst males compared to females, consistent with the figures seen nationally as illustrated in Table 6 below (Public Health Profiles).
Table 6: Admission episodes for alcohol-related cardiovascular disease (Broad), Directly standardised rate - per 100,000, Males and Females in Bury and England, 2021/22

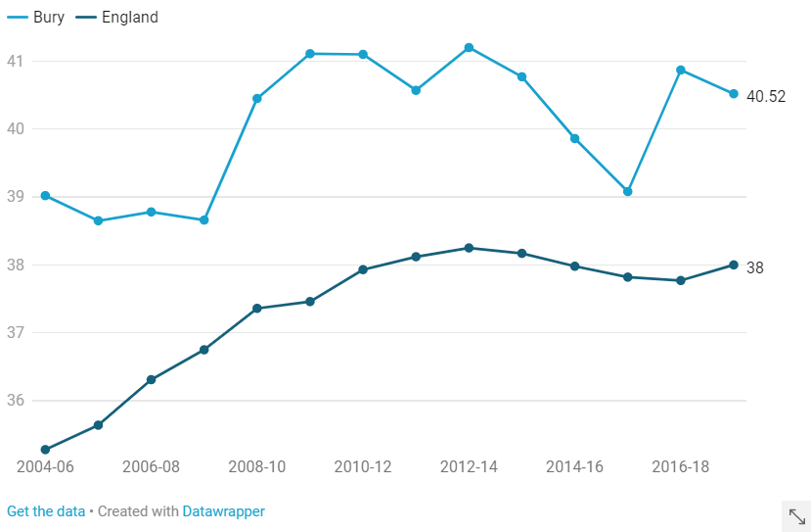
Bury remains statistically similar to England for incidence rate of alcohol-related cancer (Persons). This refers to a directly age standardised rate of new alcohol related cancers per 100,000. Figure 5 below illustrates the trend in Bury and England for this measure, showing that Bury has remained consistently higher than England but not significantly so (Public Health Profiles).
Figure 5: Incidence rate of alcohol-related cancer (Persons), Directly standardised rate - per 100,000, Bury and England, 2004-06 – 2017-19
Motor vehicle traffic accidents are a major cause of preventable deaths and morbidity, particularly in younger age groups. Alcohol consumption is responsible for around 15% of all deaths in reported road accidents. The legal limit in the UK is 35 micrograms of alcohol per 100ml of breath. However, any amount of alcohol affects your ability to drive safely. The effects can include slower reactions, increased stopping distance, poorer judgement of speed and distance and reduced field of vision, all increasing the risk of having an accident or fatality (Public Health Profiles).
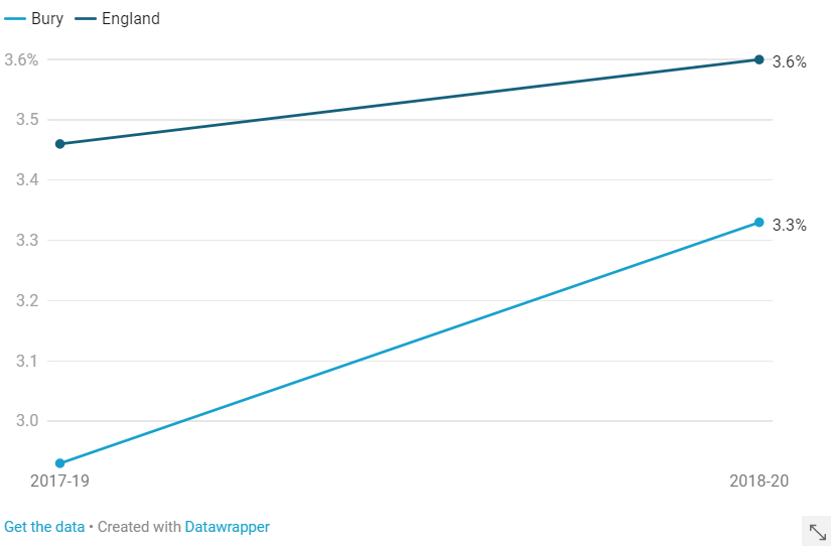
Bury remains statistically similar to England for the percentage of casualties in road traffic accidents where a failed breath test (or refusal to provide a sample) occurred. This refers to the percentage of casualties in reported accidents where a failed breath test (or refusal to provide a sample) occurred of those accidents where a motor vehicle was involved whether a driver or rider was breathalysed or not. Bury is the seventh lowest amongst its statistical neighbours in this measure. Figure 6 below illustrates that the percentage for this measure has increased in Bury, consistent with the trend seen nationally (Public Health Profiles).
Figure 6: Casualties in road traffic accidents where a failed breath test (or refusal to provide a sample) occurred, Proportion - %, Bury and England, 2017-19 – 2018-20
Treatment for alcohol misuse
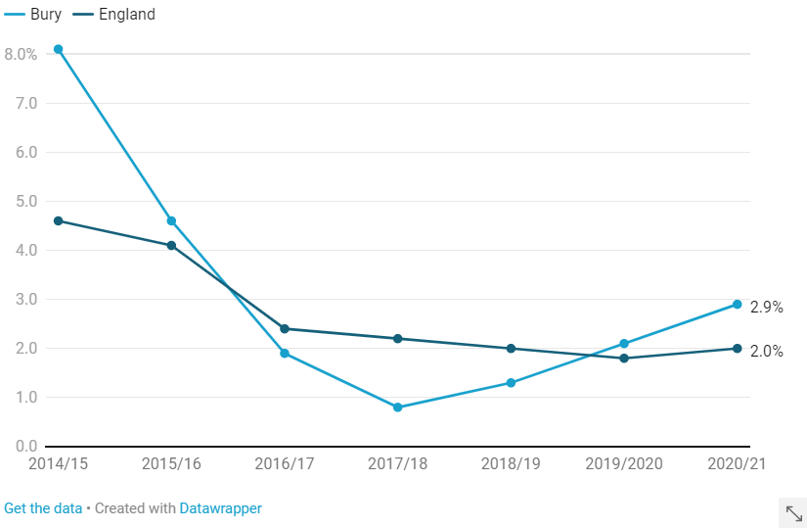
Bury has a higher proportion of people waiting more than three weeks for alcohol treatment when compared to England, although it is statistically similar. This refers to the proportion of first alcohol treatment interventions in the period where the person waited over 3 weeks to commence treatment. The method used in reporting this indicator was updated for 2014/15 to reflect changes made in the way PHE now reports the underpinning data to local areas so that the two are consistent. These changes reflect the fact that some people are receiving treatment for drugs and alcohol across a continuous pathway of care, while at the same time acknowledging that they are not on the road to recovery unless they complete treatment successfully for both. Figure 7 below illustrates the trend in Bury which has reduced significantly since 2014/15, although saw an increase in 2020/21 in line with the trend seen nationally (Public Health Profiles).
Figure 7: Proportion waiting more than 3 weeks for alcohol treatment, Proportion - %, Bury and England, 2014/15 – 2020/21
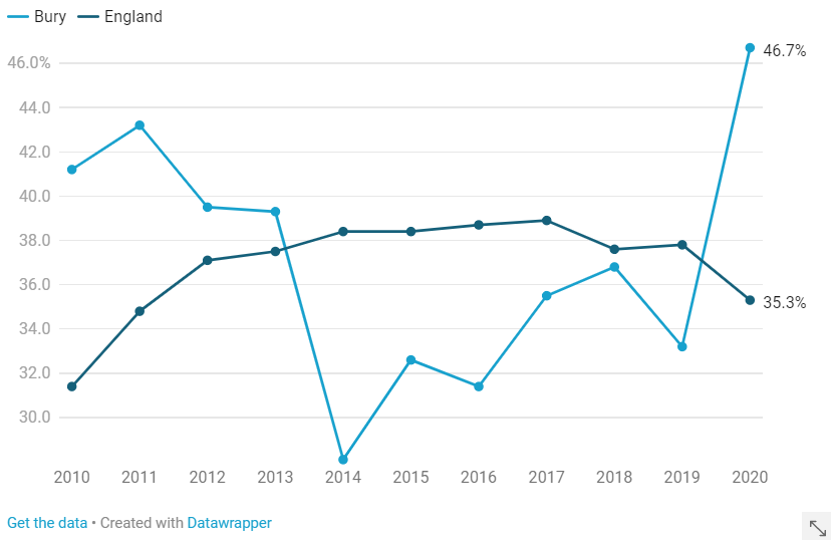
Bury is significantly better than England for the successful completion of alcohol treatment for 2020. This refers to the number of alcohol users that left structured treatment successfully (free of alcohol dependence) who do not then represent to treatment within 6 months as a percentage of the total number of alcohol users in structured treatment. Individuals achieving this outcome demonstrate a significant improvement in health and wellbeing in terms of increased longevity, reduced alcohol related illnesses and hospital admissions, improved parenting skills and improved psychological health. It will also reduce the harms to others caused by dependent drinking. Figure 8 below illustrates the trend seen in Bury, which saw a significant decrease for 2014-16 inconsistent with the trend nationally, but has since shown an increasing and getting better trend (Public Health Profiles).