Household Deprivation
Household Deprivation
Household Deprivation
Households were considered to be deprived if they met one or more of the following four dimensions of deprivation:
employment: where any member of a household, who is not a full-time student, is either unemployed or long-term sick;
education: no person in the household has at least five or more GCSE passes (grade A* to C or grade 4 and above) or equivalent qualifications, and no person aged 16 to 18 years is a full-time student;
health and disability: any person in the household has general health that is “bad” or “very bad” or has a long-term health problem;
housing: the household’s accommodation is either overcrowded, with an occupancy rating of negative 1 or less (implying that it has one fewer room or bedroom required for the number of occupants), or is in a shared dwelling, or has no central heating.
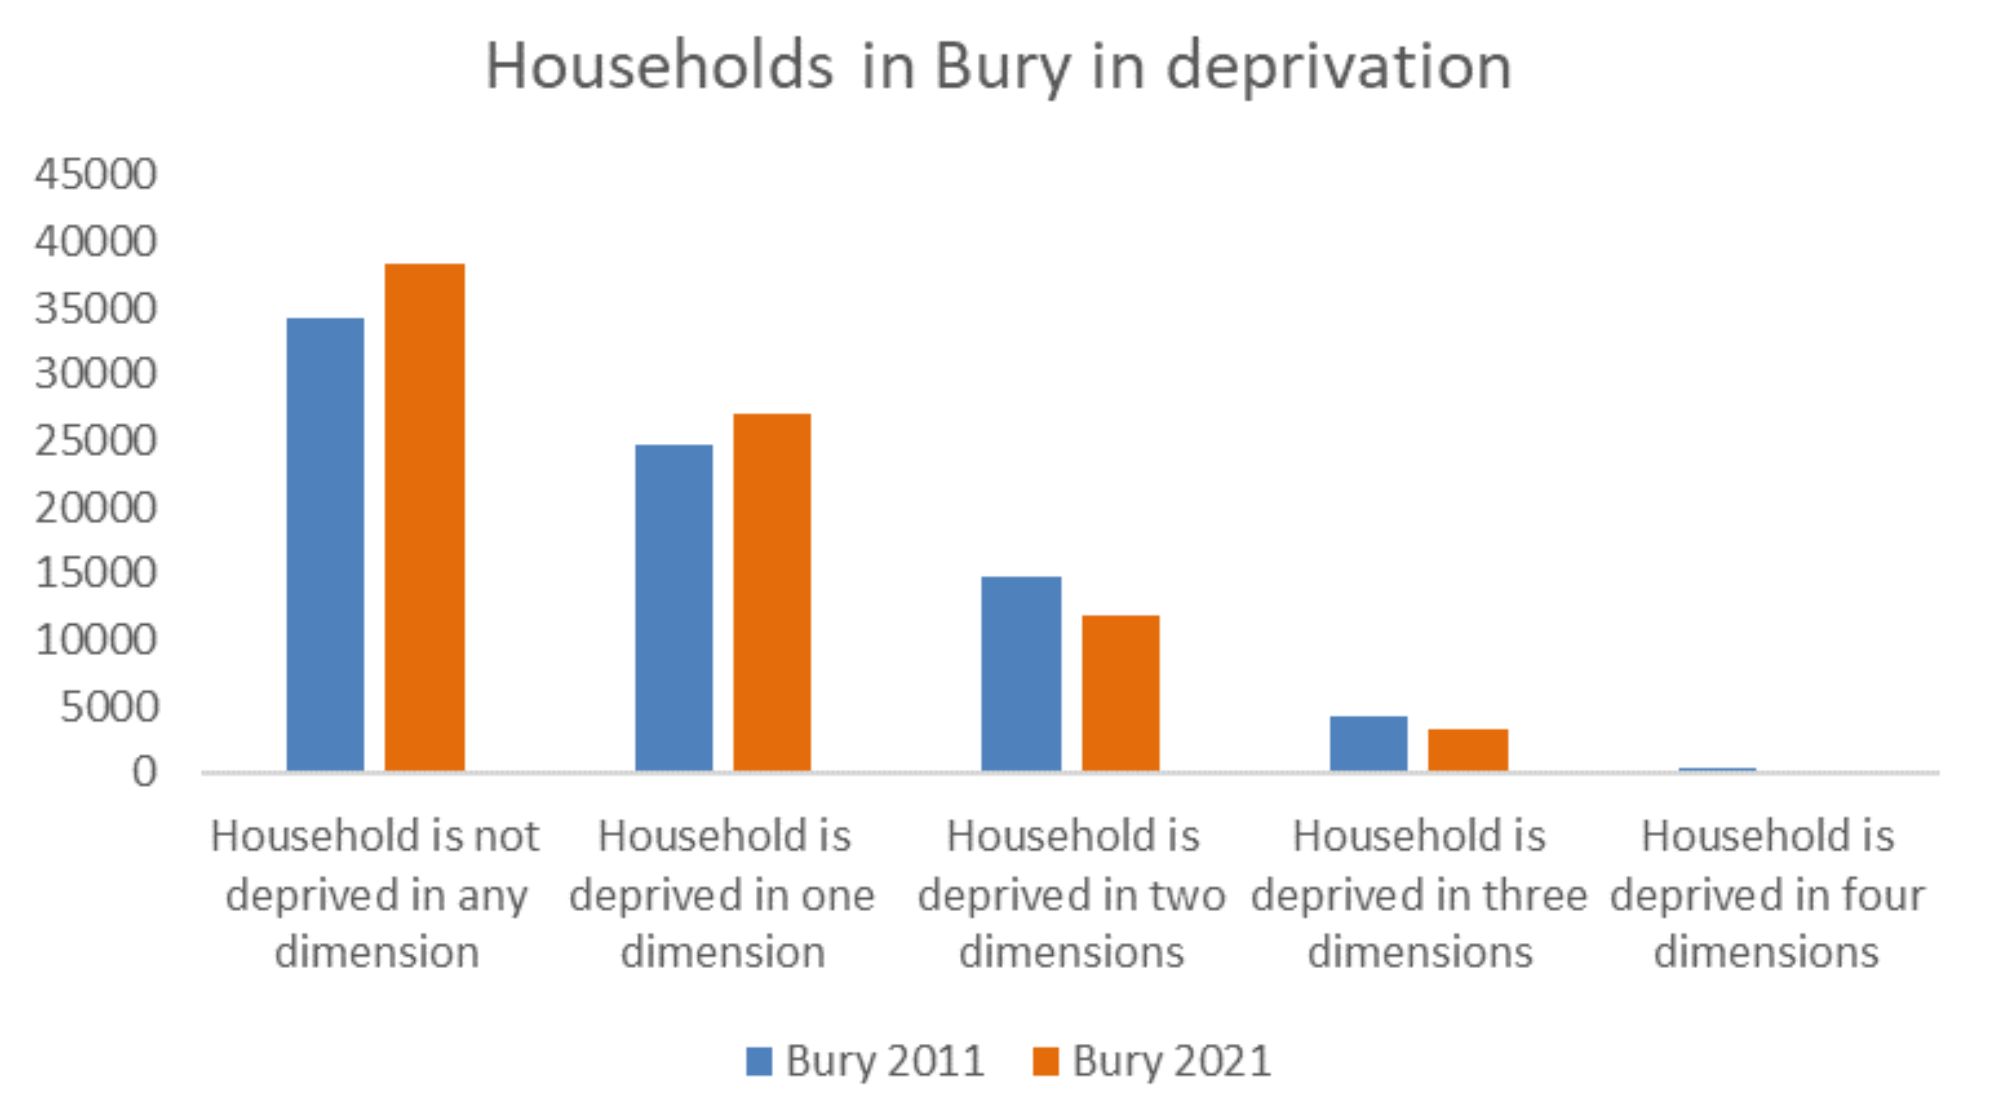
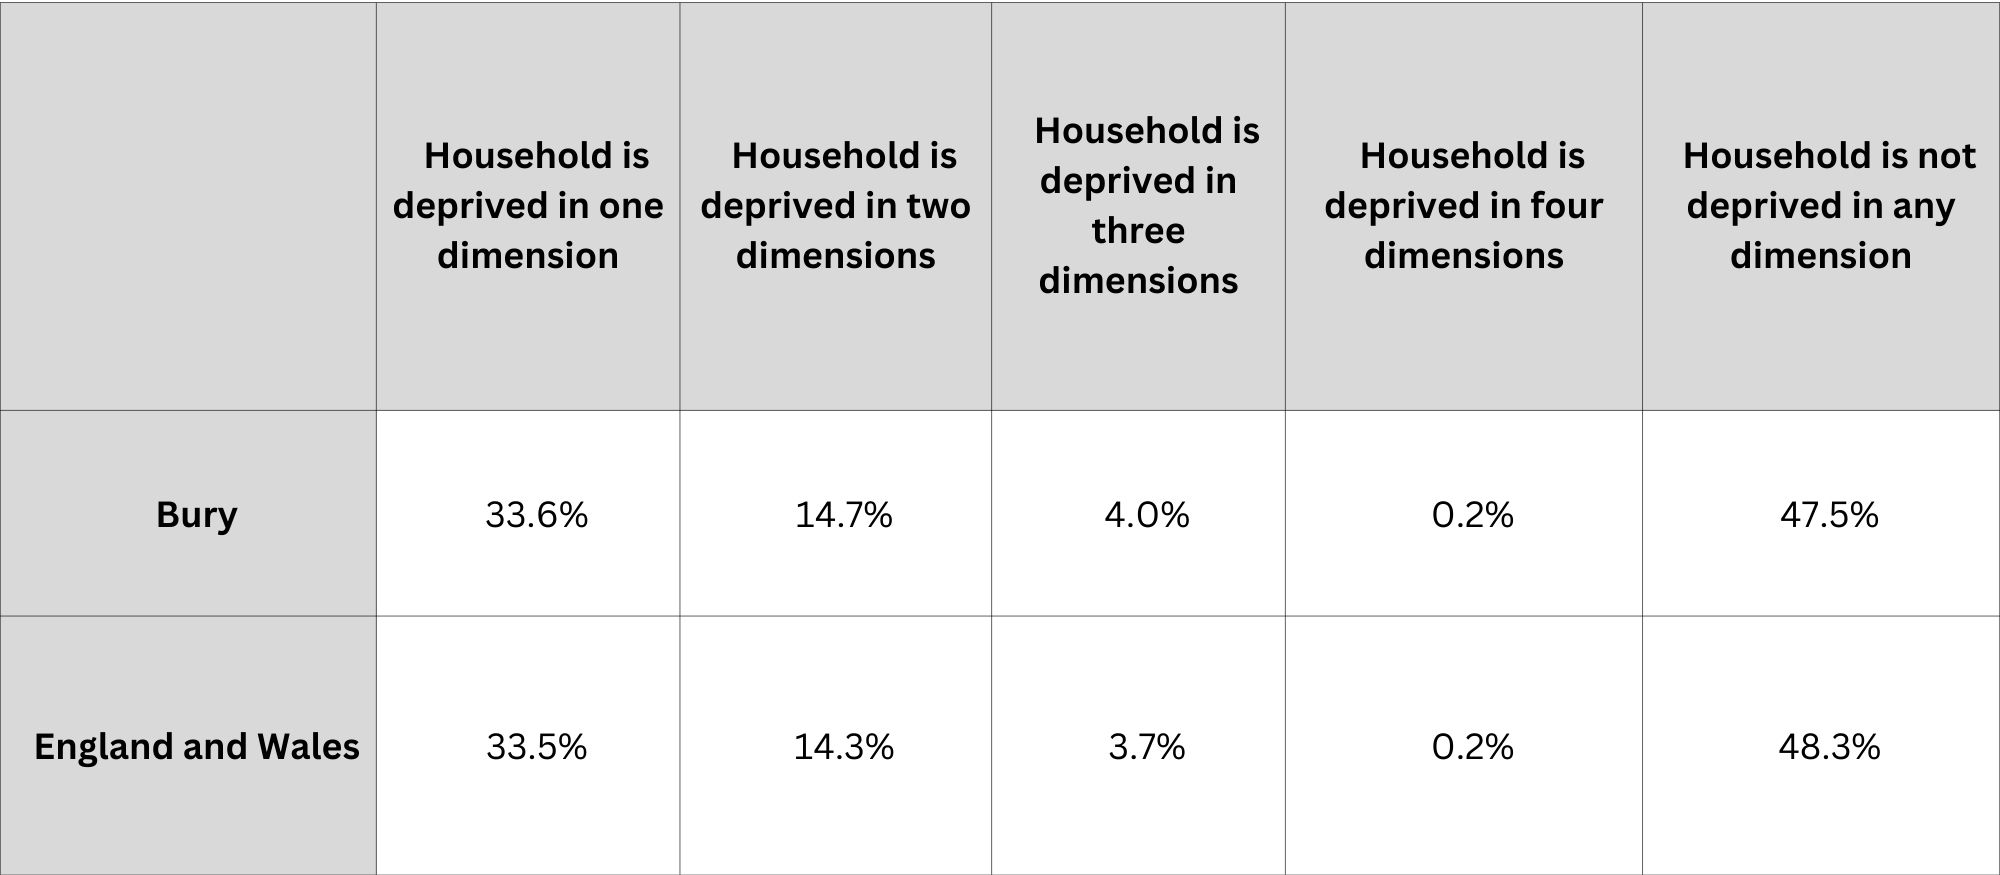
In Bury, 52.5% of households were deprived in at least one of these dimensions, similar to the figure of 51.7% of households in England and Wales according to the results from the 2021 census. This shows a decrease in Bury from the 2011 census, when 56.3% of households were deprived in at least one of the dimensions. There has also been a decrease from the 2011 census when there were 379 households in Bury deprived in four dimensions, compared to 173 in 2021. The graph below shows the difference in levels of deprivation in Bury from the 2011 census to the 2021 results.
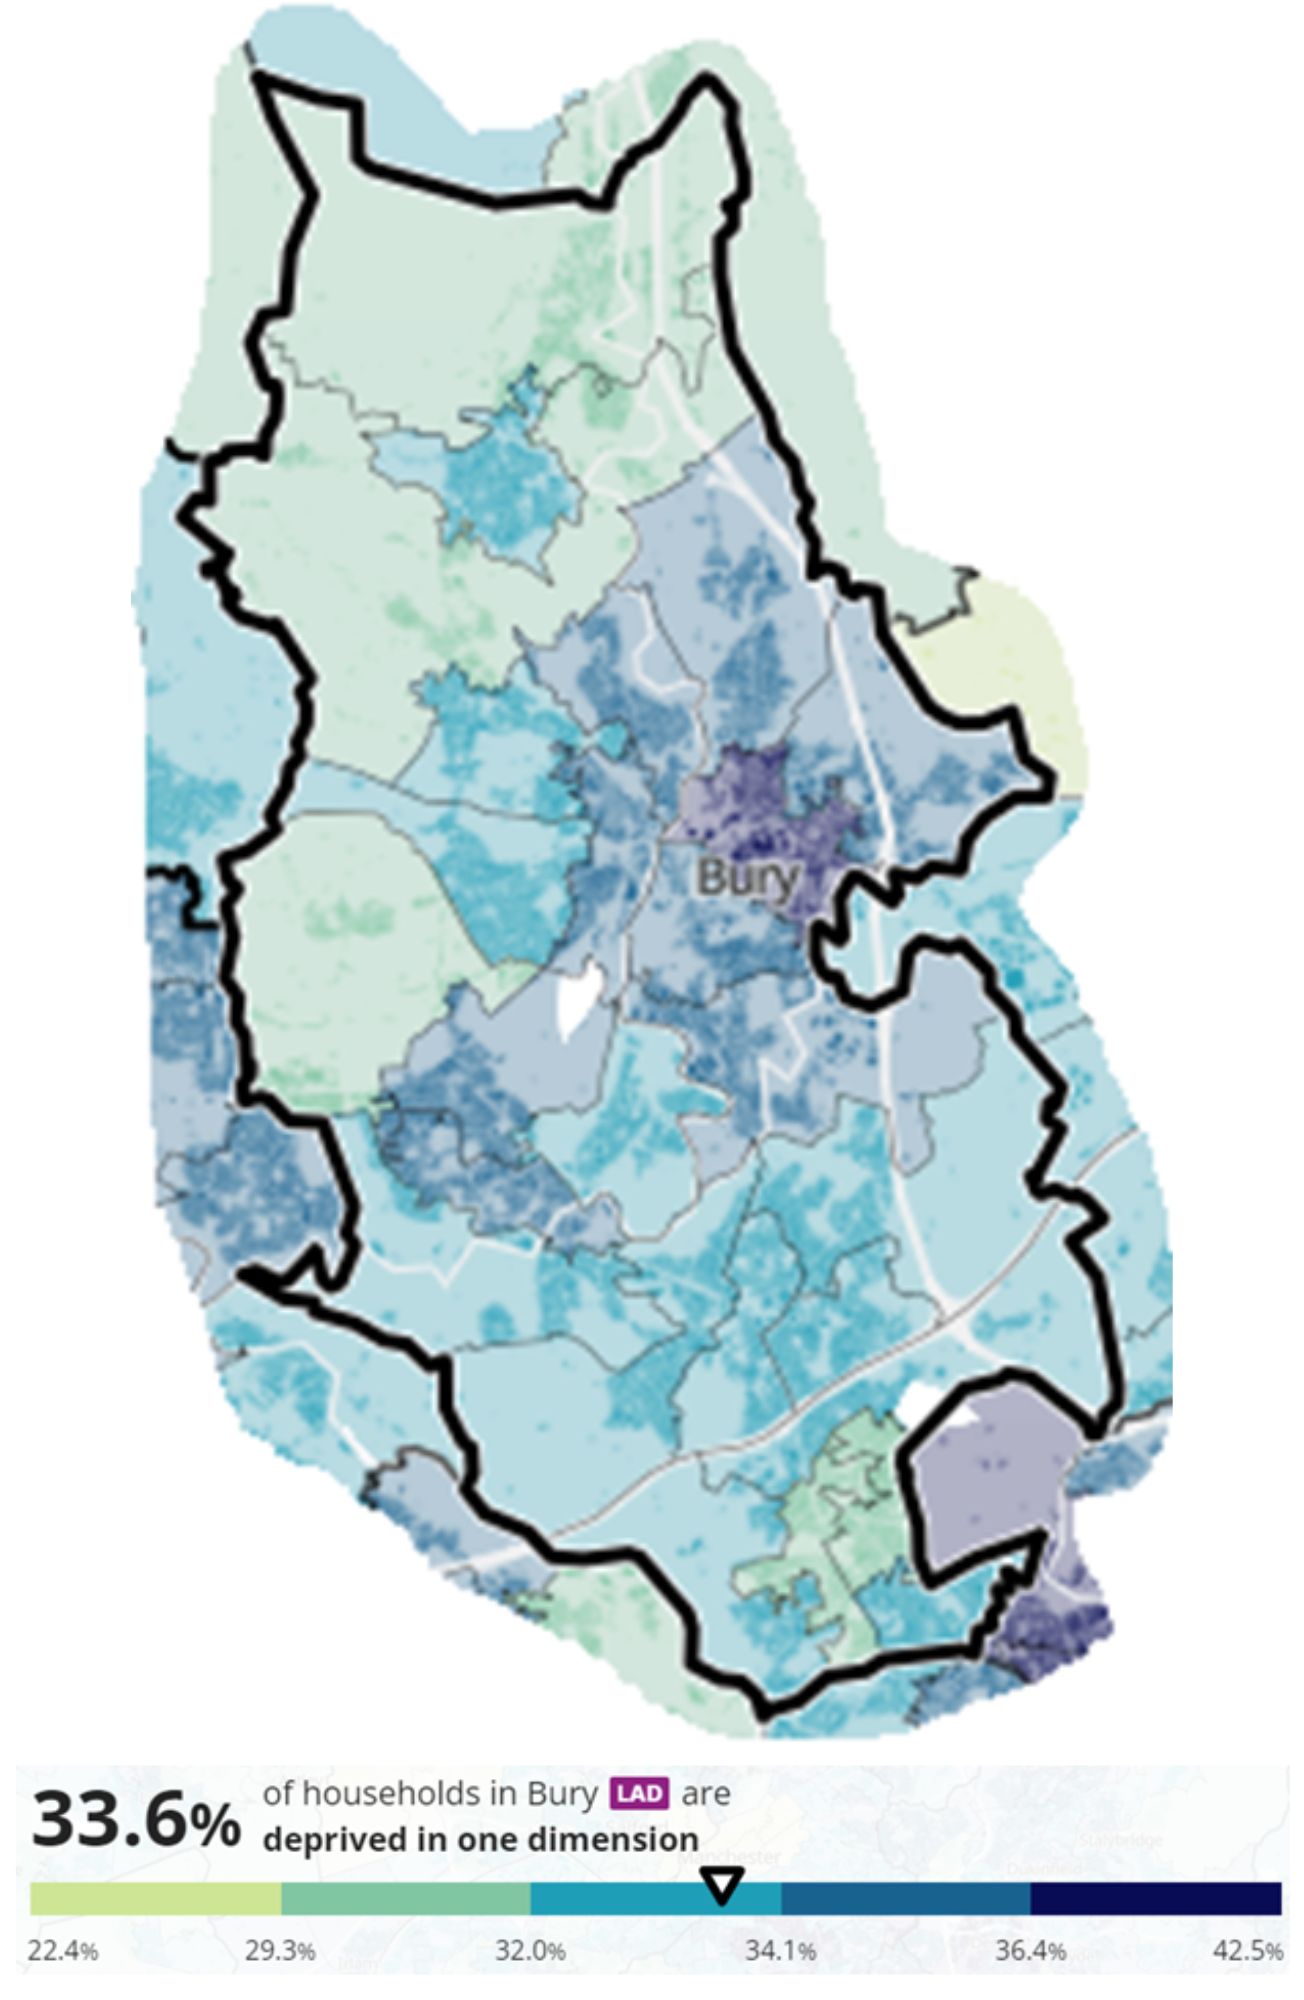
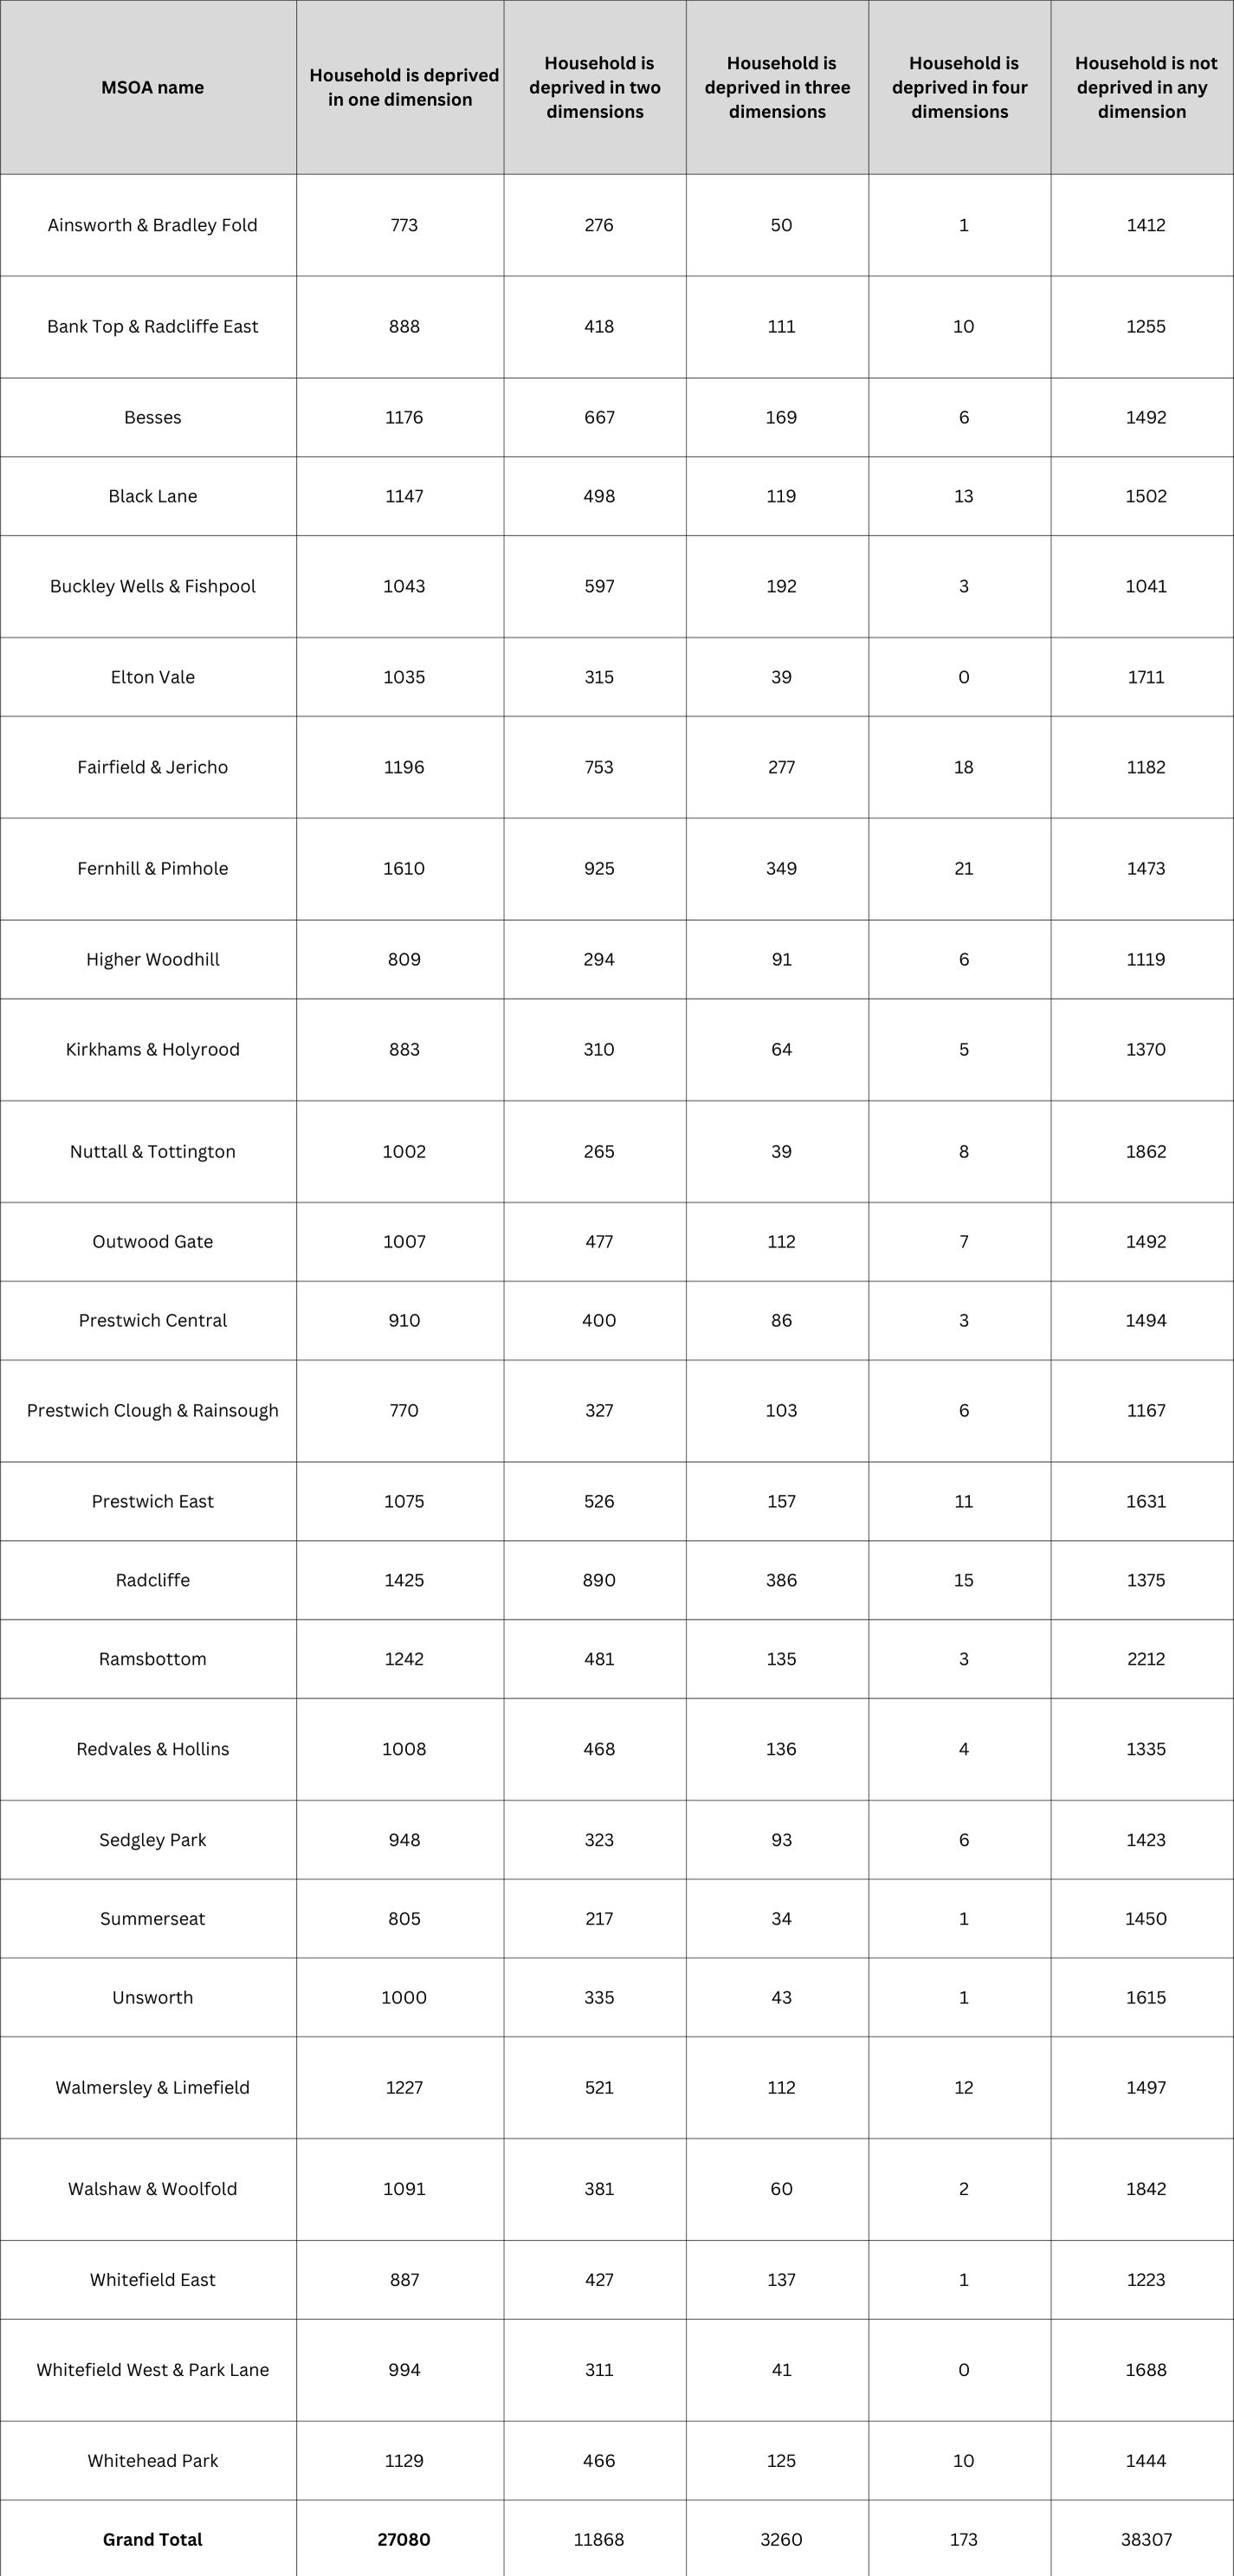
Within Bury, Fernhill and Pimhole has the highest levels of deprivation for one, two and four dimensions. Radcliffe has the highest levels of deprivation for three dimensions. Prestwich Clough & Rainsough has the lowest levels of deprivation for one dimension, Summerseat has the lowest levels for two and three dimensions of deprivation, and Elton Vale and Whitefield West & Park Lane are the only two MSOAs in Bury that have no households deprived in four dimensions. The map below shows the households in Bury that were deprived in one dimension by MSOA.
The table below shows the numbers of households in each level of deprivation by MSOA in Bury.
The table below shows the percentage of households in each level of deprivation by ward in Bury.
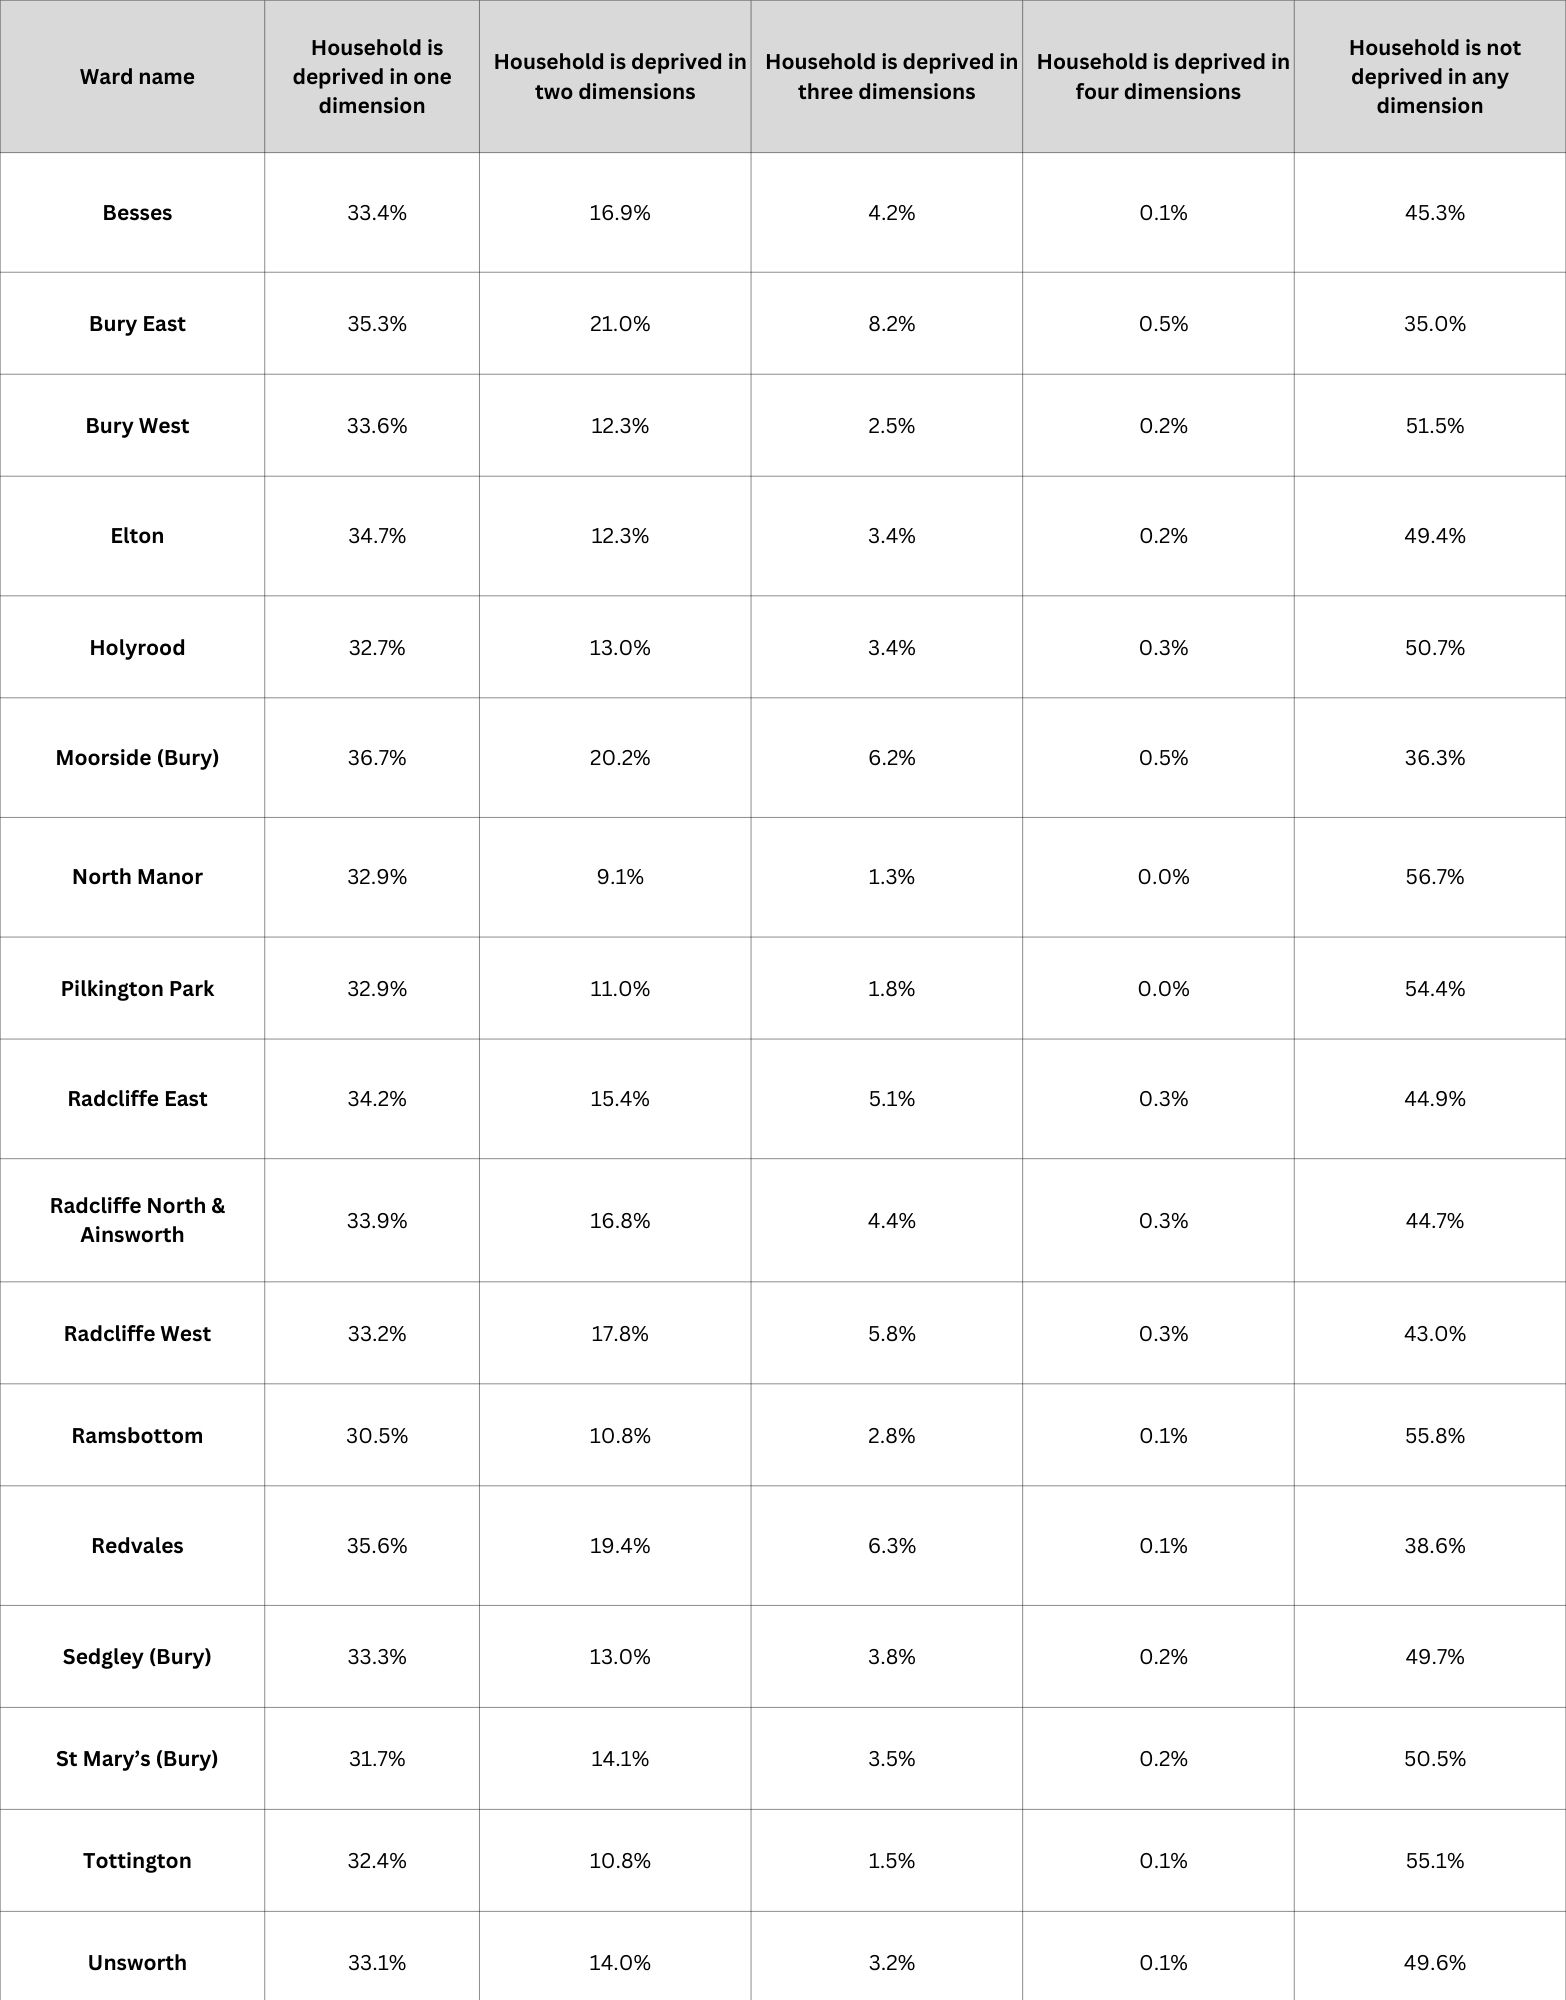
The ward with the highest percentage of households deprived in one dimension is Moorside at 36.7%. Ramsbottom is the lowest at 30.5%.
The ward with the highest percentage of households not deprived in any dimension is North Manor at 56.7%. Bury East is the lowest at 35.9%