Jump to on page content:
- Population Projections for all ages Working Age Adults
- Babies & Infants Older Adults
- Children Dependency Ratios
- Young People
Population Projections
Population projection provides an estimate of the future size and age structure of a population. They are based on population estimates and assumptions about birth rates, death rates and migration. Projections are available for local authorities in England and are published every two years, with the most recent based on mid-2020 population estimates. Projections are given forwards 25 years at the local authority levels and forwards 100 years at England level, but they become less reliable the further into the future the projection is made.
Population projection is important for several reasons. It can help local stakeholders and planners to anticipate future demographic changes and plan accordingly. For example, projections can help local governments to predict future health needs, plan for housing and make decisions about infrastructure investments. Population projection is also important for researchers and demographers to study trends in the population and their impact on society. Projections provide a framework for analysing the potential social, economic and political implications of future demographic changes including changes in age structure, labour force participation and migration patterns.
When interpreting the population projections, it is important to exercise caution and consider a range of factors that may impact them. A few examples of these factors encompass:
- Assumptions: Forecasts are based on assumptions concerning future migration, fertility and deaths in a population. This can make precise predictions difficult and it is important to consider limitations of the projections when interpreting data.
- Accuracy: The accuracy of population projections relies heavily on the quality of the data used. Historical data, while informative, may contain inaccuracies or biases that can distort results. Therefore, it is important to assess the reliability of the input data and acknowledge any limitations it may impose on achieving precise forecasts.
- Uncertainty: The range of possible outcomes for population projections is uncertain and cannot be precisely predicted. Various factors, such as new government policies, technological advancements and unexpected events like pandemics or natural disasters, contribute to this uncertainty and impact the reliability of the data collected during these predictions
- Variations at the local level: Projections of population are commonly derived from national or regional statistics and may not account for differences in specific areas. It is important to consider variables that could potentially influence demographic patterns such as economic stability, shifts in societal norms and attitudes towards cultural values unique to local communities.
- Limitations of the model: The constraints of the framework are such that population expectations derive from mathematical models with certain weaknesses. Specifically, specific models may neglect to precisely gauge how social or economic modifications affect trends in a population.
As population projections become less reliable the further away they are made, we will examine projections for Bury until the year 2035.
Between the years 2025 and 2035 there will be a projected increase of 5,770 people living in Bury (Figure 1).
Figure 1: Population projections for all ages in Bury from 2025 to 2035 (ONS, 2020)

However, this change is not expected to be uniform across all age groups. The next section explores how different age groups, such as babies and infants, children, young people, those of working age and individuals over 65, are projected to change over the coming years.
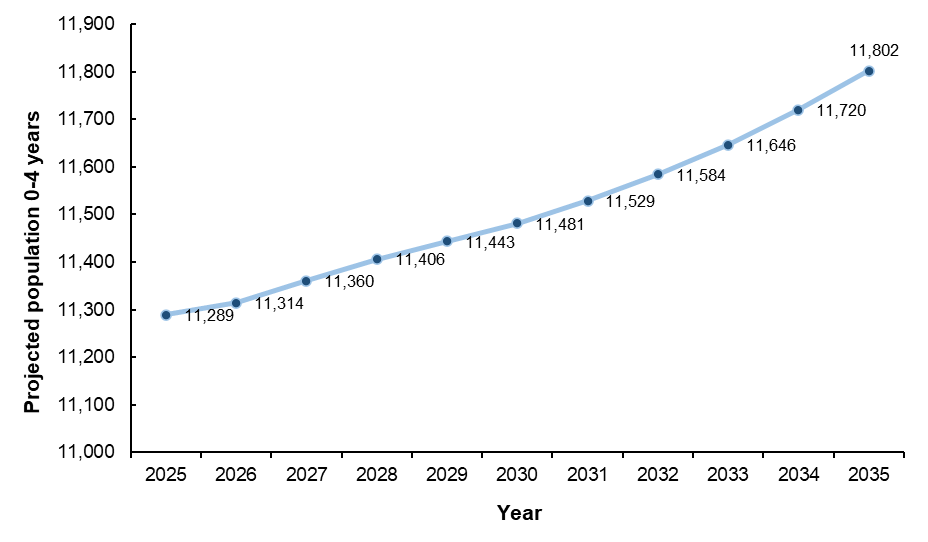
Babies & infants (0-4 years of age)
Between the years 2025 and 2035, the number of babies and infants are projected to increase by 513 (4.5%). In the same time period, England is projected to experience a 1.5% increase in babies and infants aged 0-4 years.
Figure 2: Population projections for babies and infants aged 0-4 year in Bury from 2025 to 2035 (ONS, 2020)
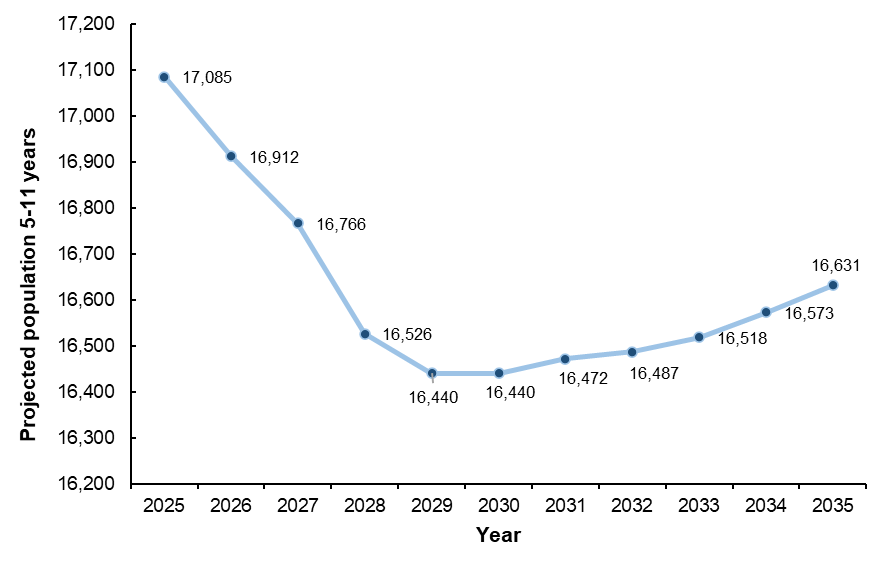
Children (5-11 years of age)
Children aged 5-11 years are projected to decrease by 454 (2.7%) in Bury between the years 2025 and 2035. This is lower than the 5.8% decrease projected for England in the same time period.
Figure 3: Population projections for children aged 5-11 years in Bury from 2025 to 2035 (ONS, 2020)
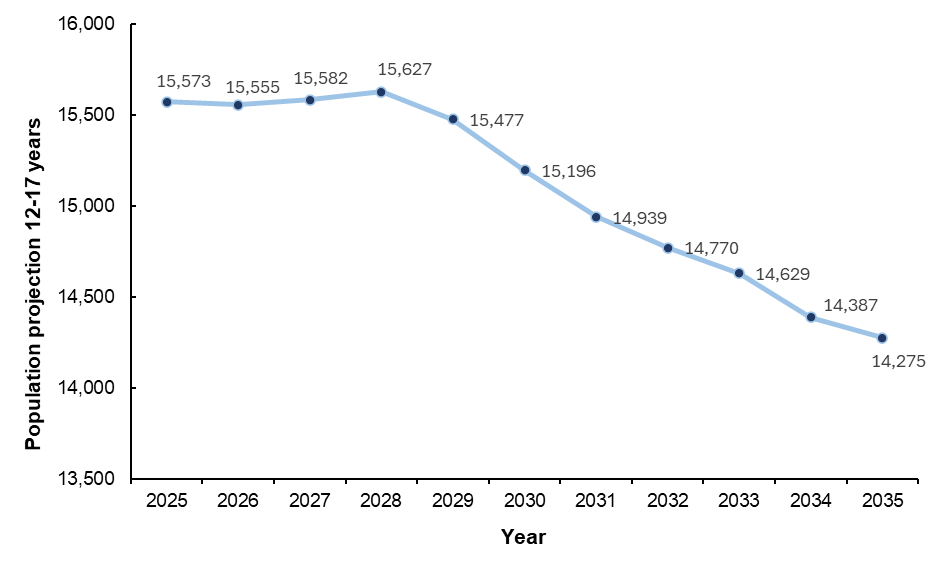
Young People (12-17 years)
Young people numbers in Bury are expected to decrease by 1,298 (8.3%) during the years 2025 to 2035. A similar decrease is seen in England by 7.7% during this time period.
Figure 4: Population projections for children aged 12-17 years in Bury from 2025 to 2035 (ONS, 2020)
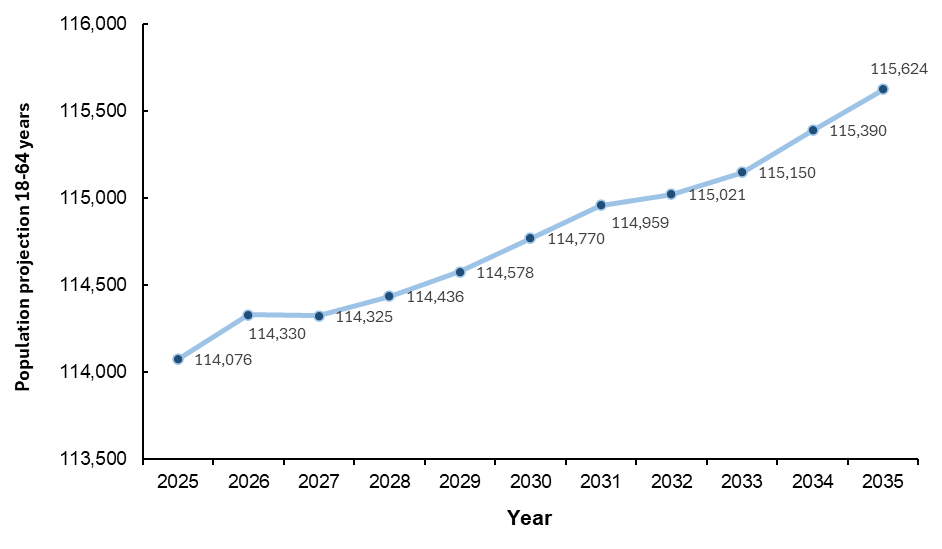
Working age adults (18-64 years)
The working age population of Bury is projected to increase by 1,548 people, or 1.4%, by 2035. In comparison, the working age population of England is expected to see a smaller increase of 0.9% between 2025 and 2035.
Figure 5: Population projections for working age adults 18-64 years in Bury from 2025 to 2035 (ONS, 2020)
Older adults (65 years and over)
Older adults in Bury are expected to see the biggest increase of 14.6% with an additional 5,469 older adults between the years 2025 to 2035. During the same time period, England is expected to see an even greater increase of 20.7% in older adults.
Figure 6: Population projections for older adults 65 years and over in Bury from 2025 to 2035 (ONS, 2020)
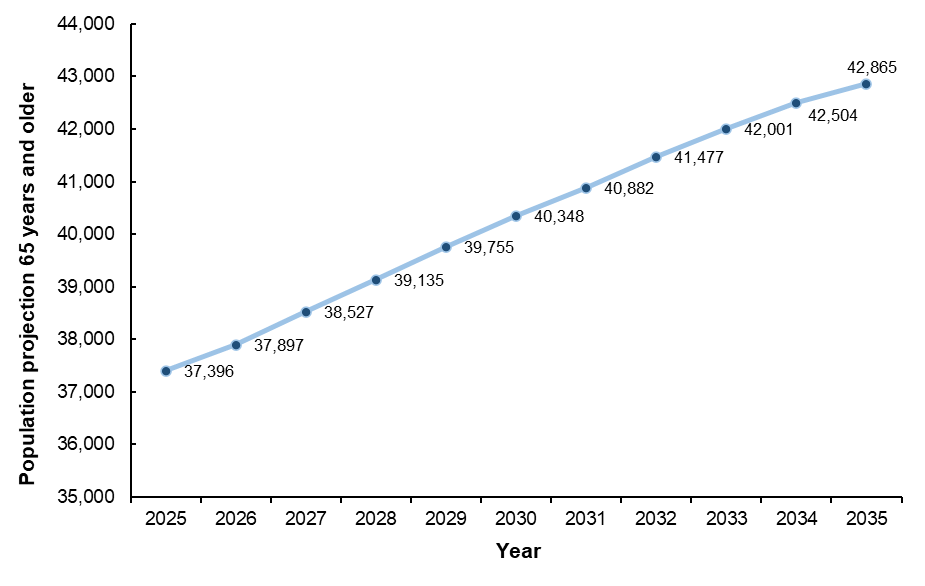
Despite the predicted increase in older adults population being lower than that predicted for England, this still represents a significant shift in the demographic composition of Bury.
Dependency ratios
Dependency ratio is a measure used in demography and public health to understand the age structure of a population and how much non-working individuals depend on those who do work for support. The higher the ratio, the greater the pressure on the working age adults.
There are three main types of dependency ratios
1. Total dependency ratio: This measure is the ratio of the total number of dependents (both too young and old to work) to the number of working-age individuals in the population. It provides a broader understanding of the extent to which non-working individuals depend on those who are working for support.
2. Youth dependency ratio: This is the ratio of the number of children aged 0-15 to the number of people aged 16-64 in the population. It provides an indication of the number of children who are dependent on working-age individuals.
3. Old-age dependency ratio: This is the ratio of the number of people aged 65 and over to the number of people aged 16-64 in the population. It provides an indication of the number of older age adults who are dependent on working-age individuals.
Dependency ratios should be interpreted with caution due to a number of limitations:
- It does not consider the potential for people to work beyond traditional retirement ages. With the ageing population and improved health, older people are working for longer, which can skew the results.
- The measure assumes that all dependents are economically inactive and rely on the working-age population for support. However, this is not always the case, as many young people work part-time or engage in other activities that contribute to the economy.
- The measure also assumes that all working-age individuals are employed and financially supporting dependents. However, not all working-age individuals are employed or financially stable and can be economically inactive due to long term illness, disability or are stay at home parents.
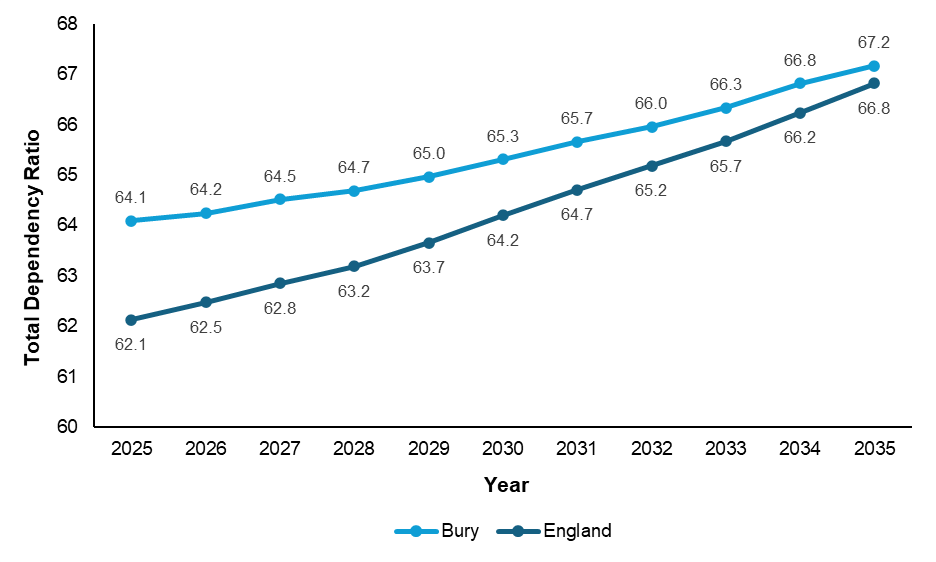
Total dependency ratio
Based on the projected population based on ONS mid-2022 estimates, Bury and England are both projected to experience an increase in total dependency ratio from 2025 to 2035. Throughout this period the gap between Bury’s total dependency ratio and that for England narrows. The total dependency ratio in Bury is projected to increase from 64.1 to 67.2 in the year 2035. A ratio of 67.2 means that for every 100 population of working age (16-64 years), there are 67 people (under 16 or over 65 years) who are dependent on them. Similarly, total dependency ratio in England is also expected to rise from 62.1 to 66.8 (Figure 7).
Figure 7: Total dependency ratio for Bury and England from 2025 to 2035 based on ONS mid-2020 population estimates (ONS, 2020)
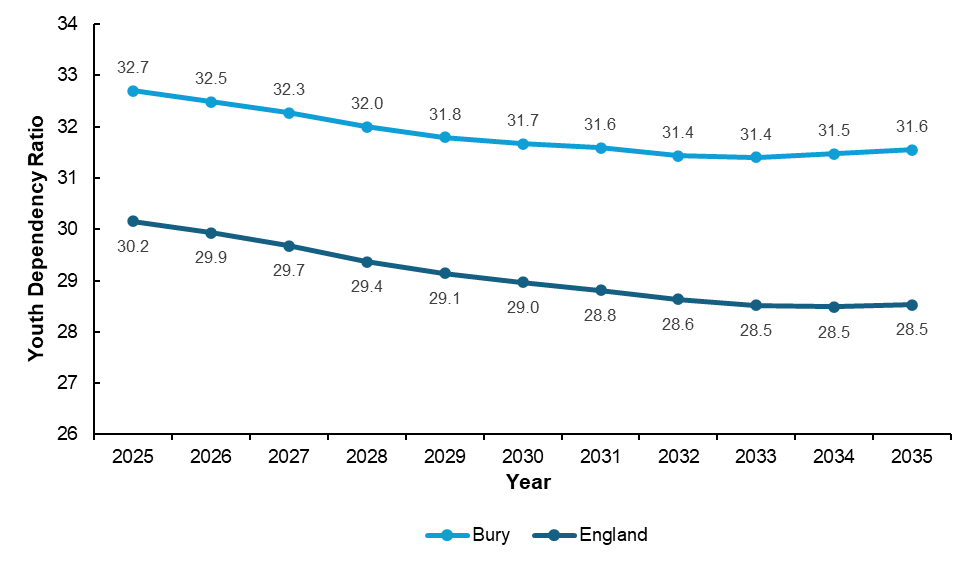
Youth dependency ratio
Bury and England are both projected to experience decrease in youth dependency ratio from 2025 to 2035. This means that there will be fewer individuals under the age of 16 who are dependent on the working age population for support. However, youth dependency ratio in Bury is expected to remain higher than England throughout 2025 to 2035. Bury's youth dependency ratio is projected to be 32.7 in 2025, compared to England's youth dependency ratio of 30.2. This trend is expected to continue throughout the period, with Bury's youth dependency ratio decreasing to 31.6 in 2035, compared to England's youth dependency ratio of 28.5 (Figure 8). The higher youth dependency ratio in Bury compared to England suggests that Bury may have a greater burden of providing care and support for children and young people who are dependent on others.
Figure 8: Youth dependency ratio for Bury and England from 2025 to 2035 based on ONS mid-2020 population estimates. (ONS, 2020)
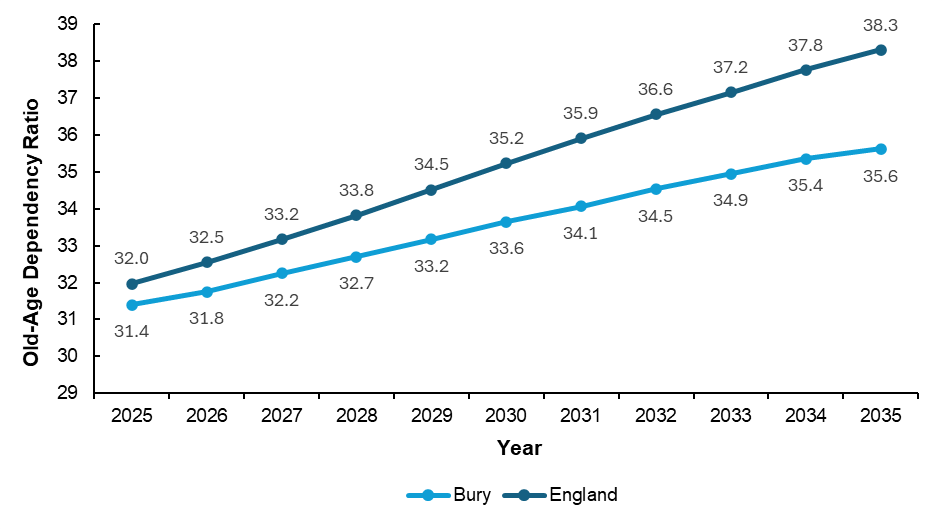
Old-age dependency ratio
Figure 9 below shows that Bury and England are both projected to experience an increase in old-age dependency ratio from 2025 to 2035. The ratio in Bury is predicted to remain below England’s average throughout this time period with the gap increasing over time. In 2025, the old age dependency ratio in Bury is projected to be 31.4 compared to 32.0 in England. This difference continues until 2035, with Bury's old-age dependency ratio increasing to 35.6, compared to England's old-age dependency ratio of 38.3. This means there will be 36 old-age dependents for every 100 working-age people in 2035
Figure 9: Old-age dependency ratio for Bury and England from 2025 to 2035 based on ONS mid-2020 population estimates. (ONS, 2020)