Population ageing occurs when a country’s median age goes up, normally through a combination of people living longer and declining birth rates. The concept of ageing well, which is based on a nonmedical approach to promoting health and well-being, is fundamental to increasing length and quality of life. Ageing well promotes personal behaviours and life-course environments that limit functional declines, especially those caused by chronic conditions, to help older adults maintain their independence and health. Ageing well emphasises the idea that people can maintain satisfying and healthy lives as they age by exercising the choices that optimise healthy, active and secure lives. It is a dynamic, interactive process that creates long-term, positive change by involving individuals in the physical, social, economic, historical and cultural contexts of their environments.
In this section of the life course, we will present and explain data on demographics and mortality, health, risks, care and support needs, well-being and wider determinants of health.
This assessment serves as a roadmap to address the identified gaps in service provision and promote healthy ageing within the community. By prioritising healthy ageing and addressing the unique needs of older adults, we can create a supportive environment that allows older adults to lead fulfilling lives as they age.
Please note: At the time of data update for this section, trend data were unavailable due to issues identified on Fingertips. To support users in accessing this information once it becomes available, Fingertips links have been included for each indicator in this section, directing users to the relevant trend data on the Fingertips website
Demographics
There are 35,448 (18.3%) older adults aged 65 years and over in Bury, similar to England average of 18.4%. Elton Vale (31.3%) and Summerseat (31.1%) have the highest proportion and Fernhill and Pimhole (9.7%) have the lowest proportion of older adults in Bury. Figure 1 below presents the proportion of population aged 65 years and over living in each Middle Super Output Area (MSOA) in Bury as a percentage of the total population in that MSOA.
Figure 1: Proportion of population aged 65 years and over living in each Middle Super Output Area (MSOA) in Bury as a percentage of the total population in that (MSOA Census 2021)

Population change in Bury for adults aged 65 years and over comparing Census 2021 to Census 2011
The population change in Bury is not uniform across all age groups. Bury population has continued to age. Census 2021 results show that there has been an increase of 19.8% in people aged 65 years and over in Bury similar to 20.1% seen in England. The largest percentage change was a 20.1% increase in the 65 years and over age group, followed by a 13.6% increase in 5-11 years age group. Conversely there was a percentage decrease in the number of babies and infants (-7.3%).
Table 1 below presents Bury ‘s population by broad age group with percentage change across these groups and comparison with England between Census 2011 and Census 2021.
Table 1: Bury‘s population by broad age group with percentage change across these groups and comparison with England between Census 2011 and Census 2021.
| Bury | England | |||
| Age Groups | 2011 | 2021 | % change | % change |
| 0-4 years (babies & infants) | 12,235 | 11,157 | -8.8 | -7.3 |
| 5-11 years (children) | 15,467 | 17,688 | 14.4 | 13.6 |
| 12-17 years (young people) | 14,250 | 15,031 | 5.5 | 2.9 |
| 18-64 years (working age adults) | 113,568 | 114,526 | 0.8 | 3.9 |
| 65+ years (older people) | 29,540 | 35,447 | 19.8 | 20.1 |
| Total | 185,060 | 193,849 | 4.7 | 6.6 |
Bury population has continued to age. Census 2021 results show that there has been an increase of 19.8% in people aged 65 years and over in Bury similar to 20.1% seen in England. The largest percentage change was a 20.1% increase in the 65 years and over age group, followed by a 13.6% increase in 5-11 years age group. Conversely there was a percentage decrease in the number of babies and infants (-7.3%).
Sex
Based on the results of Census 2021 for Bury, the highest difference by sex is in the 65+ age group (older people), where there are 3,254 more females compared with males. On average, females currently live longer than males (see Life expectancy), which significantly impact the sex profile of Bury’s population
Table 2: Number and percentage of Male and Female residents by Broad age groups in Bury
| Age Groups | Male | Female | All | |||
| number | % | number | % | number | % | |
| 0-4 years (babies & infants) | 5,775 | 51.8 | 5,382 | 48.2 | 11,157 | 100 |
| 5-11 years (children) | 9,054 | 51.2 | 8,634 | 48.8 | 17,688 | 100 |
| 12-17 years (young people) | 7,847 | 52.2 | 7,184 | 47.8 | 15,031 | 100 |
| 18-64 years (working age adults) | 56,332 | 49.2 | 58,195 | 50.8 | 114,527 | 100 |
| 65+ years (older people) | 16,099 | 45.4 | 19,353 | 54.6 | 35,452 | 100 |
| Total | 95,107 | 49.1 | 98,748 | 50.9 | 193,855 | 100 |
Population Projection:
Older adults in Bury are expected to see the biggest increase of 15.4% with an additional 5,617 older adults between the years 2023 to 2032. During the same time period, England is expected to see an ever greater increase of 21.4% in older adults.
Life expectancy at 65 years of age
Life expectancy at 65 years of age measures how long an individual who has reached the age of 65 years can expect to live on average. This assumes that age-specific mortality
levels remain constant. Several factors are taken into account for this indicator including disease prevalence, mortality rate and healthcare access indicators. Measuring LE at 65 years provides important information about the health and well-being of older adults who now make up an increasing proportion of population in majority of countries. This information can inform a number of programmes and policies related to ageing and healthcare.
For example, if life expectancy at 65 years is increasing over time, this may suggest improvements in healthcare, prevention of diseases, and overall population health. This information may help local stakeholders and policymakers to plan for the needs of an ageing population, such as promoting healthy ageing behaviours, supporting caregivers and other age well services. On the other hand, if life expectancy at 65 is decreasing, this may suggest that there are health or social issues affecting older adults that need to be addressed. For example, if there is a higher prevalence of chronic diseases or social isolation among older adults, this may lead to lower life expectancy at 65. Understanding these issues can help develop targeted interventions to improve the health and well-being of older adults.
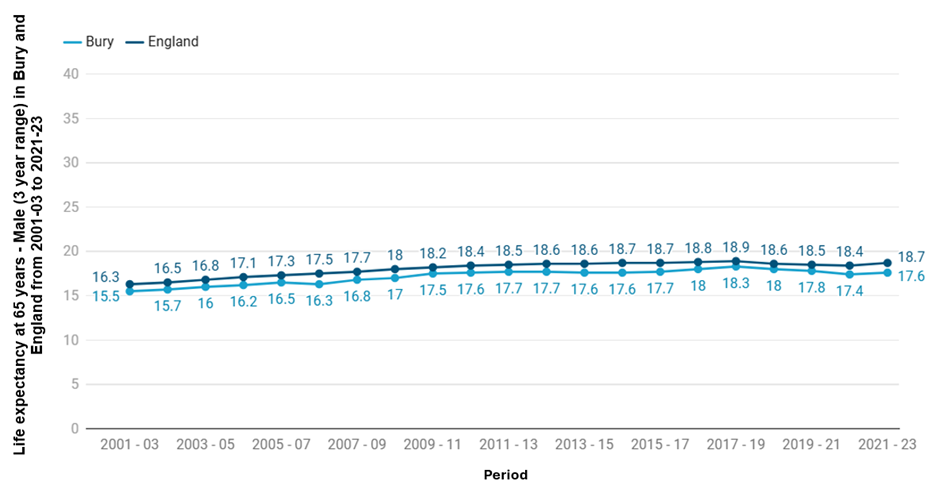
Life expectancy at 65 years (Male, 3 year range)
Life expectancy at 65 years (Male, 3 year range) in Bury for the period 2021-23 is 17.6 years, lower (statistically significant) than England average of 18.7 years (PHOF, 2023).
Life expectancy at age 65 for males in Bury increased steadily from 15.5 years in 2001-03 to a peak of 18.3 years in 2017-19. Since then, it has declined gradually, falling to 17.4 years in 2020-22. In the most recent period, it has remained fairly stable at 17.6 years in 2021-23.
Bury's life expectancy at 65 years has generally been lower (Statistically significant) than that of England throughout this time period. Similar to Bury, England's life expectancy at 65 years has also increased during this period from 16.3 years in 2001-03 to 18.9 years in 2020-22, followed by a slight increase to 18.7 years in 2021-23 (Figure 2).
Life expectancy in Bury at 65 years for the period 2021-23 is the 3rd lowest in its group of similar local authorities with the highest male LE at 65 years in Bracknell Forest of 20 years and the lowest in Rochdale of 17 years (PHOF, 2023).
Figure 2: Life expectancy at 65 years (Male, 3 year range) in Bury and England from 2001-03 to 2021-23 (PHOF, 2023).
Life expectancy at 65 years (Female, 3 year range)
Life expectancy at 65 years (Female, 3 year range) in Bury for the period 2021-23 is 20.2 years, lower (statistically significant) than England average of 21.1 years (PHOF, 2023). Figure 3 presents the female life expectancy at 65 in Bury and England from the period 2001-03 to 2021-23. Similar to males, female life expectancy at 65 years in Bury has been consistently lower (statistically significant) than the national average for England over the observed time period. In 2001-03, the life expectancy for females in Bury at 65 years was 18.4 years before increasing with some fluctuations to a peak of 20.5 years in 2017-19. Since then, it has declined gradually, falling to 19.7 years in 2020-22. In the most recent period, it has remained fairly stable at 20.2 years in 2021-23.
Similarly, the life expectancy for females at 65 years in England has also increased, reaching a peak of 21.2 years in 2017-19, before slightly declining to 20.9 years in 2020-22 and 21.1 years in 2021-23. Compared with Bury’s statistical neighbours, Bury has the 4th lowest female life expectancy at 65 years for the period 2021-23 in its group of 16 similar local authorities with the highest female LE at 65 years in Bracknell Forest of 22.2 years and the lowest in Tameside of 19.6 years (PHOF, 2023).
Figure 3: Life expectancy at 65 years (Female, 3 year range) in Bury and England from 2001-03 to 2021-23 (PHOF, 2023)

Variations in life expectancy at 65 years by small geographical areas
Due to lack of data at MSOA and ward levels, we cannot examine the variations in LE at 65 years for male and female in Bury
Inequality in life expectancy at 65 years
This indicator measures inequalities in life expectancy at age 65 within Bury. Life expectancy at age 65 is calculated for each deprivation decile of lower super output areas within each area and then the slope index of inequality (SII) is calculated based on these figures. The SII is a measure of the social gradient in life expectancy, that is how much life expectancy varies with deprivation. It takes account of health inequalities across the whole range of deprivation within each area and summarises this in a single number. This represents the range in years of life expectancy across the social gradient from most to least deprived, based on a statistical analysis of the relationship between life expectancy and deprivation across all deprivation deciles.
Male
For the period 2021-23, the inequality in life expectancy at age 65 for males in Bury between the most and least deprived deciles was 5.8 years, compared with 5.6 years in England overall. This places Bury in the middle quintile nationally (PHOF, 2023). Examining SII for Bury, life expectancy increased by some fluctuations from 5.6 years in 2011-13 to 7.8 years in 2016-18. This was followed by narrowing of the gap from 7.5 years in 2017-19 to 5.8 years in 2021-23. Nationally, England experienced a gradual increase in inequality over the same period, with the SII rising from 4.7 years in 2011-13 to 5.6 years in 2021-23 (Figure 4). When compared with its statistical neighbours, Bury ranked 9th highest out of 16 similar local authorities for the 2021–23 period. The widest inequality was observed in Stockport (7.8 years), while the narrowest was in Sutton (4.7 years) (PHOF, 2023).
Figure 4: Slope index of inequality: Inequality in life expectancy at 65 years (Male) in Bury and England from 2011-13 to 2021-23 (PHOF, 2023)

Female
For the period 2021-23, the inequality in life expectancy at age 65 for females in Bury between the most and least deprived deciles was 5.9 years, compared with 5 years in England overall. This places Bury in the 2nd worst quintile nationally (PHOF, 2023). In Bury, the Slope Index of Inequality (SII) for life expectancy rose, with some fluctuations, from 5.7 years in 2011-13 to 6.9 years in 2015-17. This was followed by a narrowing of the inequality gap, as the SII declined from 6.1 years in 2016-18 to 5.3 years in 2017-19. However, the gap widened again to 6.2 years in 2020-22, before slightly narrowing to 5.9 years in 2021-23.Nationally, England experienced a gradual increase in inequality over the same period, with the SII rising from 4.1 years in 2011-13 to 5.0 years in 2021-23 (Figure 5). When compared with its statistical neighbours, Bury ranked 6th highest out of 16 similar local authorities for the 2021–23 period. The widest inequality was observed in Stockton-on-Tees (8.1 years), while the narrowest was in Sutton (3.4 years) (PHOF, 2023).
Figure 5: Slope index of inequality: Inequality in life expectancy at 65 years (Female) in Bury and England from 2011-13 to 2021-23 (PHOF, 2023)

Healthy life expectancy at 65 years of age
This indicator provides an important summary measure of the mortality and morbidity in those aged 65 years and over. Healthy life expectancy shows the years a person can expect to live in good health (rather than with a disability or in poor health). This indicator complements the proposed indicator of healthy life expectancy at age 65 to measure progress on the government's 'Ageing Grand Challenge' mission to "ensure that people can enjoy at least 5 extra healthy, independent years of life by 2035, while narrowing the gap between the experience of the richest and poorest." It is also a key measure to monitor progress on PHE's productive healthy ageing policy based on the World Health Organisation's healthy ageing framework.
This indicator is a measure of the average number of years a person aged 65 years would expect to live in good health based on contemporary mortality rates and prevalence of self-reported good health. The prevalence of good health is derived from responses to a survey question on general health. For a particular area and time period, it is an estimate of the average number of years a person aged 65 years would live in good general health if he or she experienced the age specific mortality rates and prevalence of good health for that area and time period throughout his or her remaining life. Figures are calculated from deaths from all causes, midyear population estimates, and self-reported general health status, based on data aggregated over a three year period. (PHOF, 2023).
Healthy life expectancy at 65 years (Male)
Healthy life expectancy at 65 years for males in Bury is 9.2 years, statistically similar to England average of 10.1 years (PHOF, 2023). Figure 6 presents the healthy life expectancy at 65 years of males in Bury and England from 2011-13 to 2021-23.
In Bury, healthy life expectancy (HLE) at age 65 for males showed some fluctuation, starting at 9.1 years in 2011-13, dipping slightly to 8.8 years in 2014-16 and then rising steadily to a peak of 10.1 years in both 2018-20 and 2019-21. This was followed by a decline to 9.4 years in 2020–22 and a further drop to 9.2 years in 2021–23.
In England, healthy life expectancy at age 65 for males showed a gradual increase from 10 years in 2011-13 to a peak of 10.5 years between 2016-19, where it remained stable for several periods. This was followed by a slight decline to 10.4 years in 2019-21, 10.2 years in 2020-22 and 10.1 years in 2021-23 (Figure 6).
Figure 6: Healthy life expectancy at 65 years (Male) in Bury and England from 2011-13 to 2021-23 (PHOF, 2023).

Bury has the 6th lowest HLE at 65 years for males in its group of 16 similar local authorities for the period 2021-23, with the highest HLE at 65 years for males in Bracknell Forest (11.9 years) and lowest in Rochdale (7.5 years) (PHOF, 2023).
Healthy life expectancy at 65 years (Female)
Healthy life expectancy at 65 years for females in Bury is 10 years, statistically similar to England average of 11.3 years (PHOF, 2023). For females, HLE at 65 in Bury was 10.1 years in 2011-13, remained relatively stable through 2016-18, and then rose to a peak of 11.2 years in 2018-20. This was followed by a slight decline to 11 years in 2019-21, and a more noticeable drop to 10.1 years in 2020-22 and 10 years in 2021-23.
In England, HLE at 65 started at 10.8 years in 2011-13 and rose steadily to a high of 11.8 years in 2017-19. It then remained relatively stable at 11.7 years through 2018-21, before declining to 11.4 years in 2020-22 and 11.2 years in 2021-23 (Figure 7).
Figure 7: Healthy life expectancy at 65 years (Female) in Bury and England from 2011-13 to 2021-23 (PHOF, 2023).

Bury ranks 10th for HLE at 65 years for females in its group of 16 similar local authorities for the period 2021-23, with the highest HLE at 65 years for females in Bracknell Forest (13.1 years) and lowest in Rochdale (8.3 years) (PHOF, 2023).
Variations in healthy life expectancy at 65 years by small geographical areas
Due to lack of data at MSOA and ward levels, we cannot examine the variations in HLE at 65 years for male and female in Bury.
Inequality in healthy life expectancy at 65 years
Data on inequality are only available by sex. In Bury, females consistently had higher healthy life expectancy at age 65 than males across all years from 2011-13 to 2021-23. Gap by sex remained relatively stable, typically ranging from 1 to 1.1 years. For instance, in 2018–20, males had an HLE of 10.1 years, compared to 11.2 years for females. Even in the most recent period (2021–23), the gap persisted, with males at 9.2 years and females at 10years. This consistent difference highlights a sustained disparity by sex in later-life health outcomes in Bury.
Figure 8: Comparison of Healthy life expectancy at 65 years by sex in Bury from 2009-11 to 2021-23 (PHOF, 2023).

Disability-free life expectancy at 65 years
Disability-free life expectancy at 65 years is an important summary measure of health and has implications for: quality of life; fitness for work given increases in the State Pension age; personal finances; social connections and contributions; health and care services; and the wider economy. This indicator complements the indicator of healthy life expectancy at age 65 to measure progress on the government's 'Ageing Grand Challenge' mission described earlier.
Disability-free life expectancy (DFLE) at 65 is defined as an estimate of the number of years a person aged 65 years would expect to live without a long-lasting physical or mental health condition or disability limiting their ability to carry out day-to-day activities. This is based on contemporary mortality rates and prevalence of self-reported disability-free state.
The prevalence of disability-free state is derived from responses to a survey question on general health. For a particular area and time period, it is an estimate of the average number of years a person aged 65 years would live without disability if he or she experienced the age-specific mortality rates and prevalence of disability-free state for that area and time period throughout his or her remaining life. Figures are calculated from deaths from all causes, mid-year population estimates, and self-reported disability-free state, based on data aggregated over a three-year period.
Examining data for Bury, DFLE at 65 years for both Male and Female increased from 2014-16 to 2018-20 but the increase was greater (2.5 years) in males compared with females (0.7 years). Between the periods 2014-16 and 2018-20, disability free life expectancy at 65 years in males increased from 8.3 years to 10.7 years, while in females it increased from 8.9 years to 9.6years. DFLE at 65 years for females in Bury remained higher than males throughout the observed time period. DFLE for males was highest in the most recent period 2018-20 at 10.7 years and for females, it was highest in 2017-19 at 10.2 years (Figure 9)
Figure 9: Comparison of Disability free life expectancy at 65 years by sex in Bury from 2009-11 to 2018-20 (Productive Healthy Ageing Profile, 2020).

Disability-free life expectancy at 65 years - Male
Disability-free life expectancy at 65 years - Males in Bury for the year 2018-20 is at 10.7 years similar (statistically significant) to England average of 9.8 years.
Figure 10 below presents trend data for Bury and England for the period 2014-16 and 2018-20. DFLE at 65 years for males in Bury increased steadily from 8.3 years in 2014-16 to 10.7 years in 2018-20. For England, disability-free life expectancy at 65 years for males remained stable with slight fluctuations from 9.7 years in 2014-16 to 9.8 years in 2018-20 (Figure 10)
Figure 10: Disability-free life expectancy at 65 years (Male) in Bury and England from 2014-16 to 2018-20 (PHOF, 2020).

DFLE for males at 65 years in Bury for the period 2018-20 is the 6th highest in its group of 16 similar local authorities with the highest male DFLE in Sutton of 12.5 years and the lowest in Tameside of 7.7 years (PHOF, 2020). No data on inequities are present for Bury and England.
Disability-free life expectancy at 65 years - Female
Disability-free life expectancy at 65 years- Females in Bury for the year 2018-20 is at 9.6 years similar (statistically significant) to England average of 9.9 years.
Figure 11 below presents trend data for Bury and England for the period 2014-16 to 2018-20. DFLE of Females at 65 years in Bury increased from 8.9 years in 2014-16 to 10.2 years in 2017-19, before declining slightly to 9.6 years. For England, disability-free life expectancy at 65 years for females remained fairly stable with slight fluctuations from 9.7 years in 2014-16 to 9.9 years in 2018-20.
Figure 11: Disability-free life expectancy at 65 years (Female) in Bury and England from 2014-16 to 2018-20 (PHOF, 2020).

DFLE for females at 65 years in Bury for the period 2018-20 is the 7th lowest in its group of 16 similar local authorities with the highest female DFLE in Bracknell Forest of 11.8 years and the lowest in Rochdale of 6.57 years (PHOF, 2020).
Variations in disability-free life expectancy at 65 years by small geographical areas
Due to lack of data at MSOA and ward levels, we cannot examine the variations in DFLE at 65 years for male and female in Bury.
Inequality in disability-free life expectancy at 65 years
There is a lack of publicly available data on inequality in DFLE at 65 years for both males and females at Bury and England levels.
Morbidity in Older Adults
Global Burden of Disease (GBD) tool provides modelled estimates on the burden of ill health and disability from hundreds of diseases, injuries, and risk factors around the world. Most recent data on the tool are available from 2019 and the age range for older adults in this tool kits is limited to 70 years and over. The GBD tool also offers modelled estimates of the burden that can be attributed to various risk factors. Years with Disability (YLD) are used to measure the burden of morbidity (living with a disease). In order to calculate the overall loss of quality of life, the YLD measure of morbidity combines the prevalence of each disease with a rating of the severity of its symptoms (aside from death itself).
Non-Communicable diseases were the most common conditions accounting for the greatest burden of disease for both males and females in Bury. Diabetes, age related hearing loss, COPD, low-back pains and falls were the top 5 most common causes of YLD in Bury males. Whereas, for females low back pain, diabetes, falls, age-related hearing loss and COPD were the top 5 most common causes in Bury females (Table 4).
Table 4: Top 5 conditions accounting for greatest burden of disease by Sex for Bury residents aged 70+ years (YLD rate per 100,000, % of total YLD) (GBD tool, 2019)


Mortality-Leading causes
More up to date data from the year 2021 are available by 5 years age bands for leading causes of mortality in older age adults for Bury (ONS, 2021). Below we will present the leading cause of mortality for males aged 70 years and over by 5 years age band in Bury for each year from 2013 to 2021.
Male
Neoplasms (cancer) are the leading cause of mortality for males aged 65 years and over for most years until 85-89 years. The most common cancers across these age groups contributing to mortality are lung and bowel cancers. Circulatory diseases, specifically ischaemic heart diseases, are the primary cause of death for most years in males aged 85 to 89, and respiratory and circulatory diseases are the primary causes of death for most years in people aged 90 and over. COVID-19 emerged as a leading cause of mortality for males aged 80-89 years in 2020. This highlights the impact of the COVID-19 pandemic on mortality rates in vulnerable population groups.
Table 5: Leading cause of mortality for males aged 65 years and over by five-year age bands in Bury from the year 2013 to 2023 (ONS, 2023)


Female
Among females aged 65 to 79 in Bury, neoplasms (cancers) are the leading cause of death, with lung, bowel, and breast cancers being the most prevalent. In the 80–84 age group, neoplasms have overtaken circulatory diseases as the primary cause of mortality. For women aged 85–89, circulatory diseases were the leading cause of death from 2013 to 2018. However, between 2019 and 2022, mental and behavioural disorders became the most common cause. In 2023, circulatory diseases once again emerged as the leading cause of death in this age group. For ages 90 years and over, mental and behavioural disorders have been a significant cause of mortality until 2020, after which they were replaced by circulatory diseases.
Table 6: Leading cause of mortality for females aged 65 years and over by five-year age bands in Bury from the year 2013 to 2023 (ONS, 2023)


Mortality-risk factors
Number of risk factors can influence mortality in the population. Using the Global Burden of Disease tool, 87 disease risk factors can be ranked according to the percentage of fatalities they cause. The three main categories of risk factors are behavioural, metabolic, and environmental.
Smoking and high blood pressure are the leading contributor to deaths in both sexes over 70 years in Bury. Following these are dietary risks, high fasting plasma glucose and high LDL for males and high fasting plasma glucose, dietary risk and high BMI for females (Table 7).
Table 7: Top risk factors contributing to deaths by Sex for Bury residents aged 70+ years (% of total deaths) (GBD tool, 2019)


Mortality-Specific conditions
In this section, we will present publicly available data on mortality rates among the older population for cancer, cardiovascular diseases, respiratory diseases and winter-related factors. Deaths from dementia will be discussed in details in the dementia section.
Cancer
In the UK, 367,000 people are diagnosed with cancer annually. Around 40% of those cancers are caused by behavioural risk factor including smoking and alcohol (CRUK, 2020) and overweight and obesity. Annual NHS costs for cancer services are £5 billion, but the cost to society as a whole, including costs for loss of productivity, is £18.3 billion (HM Government, 2015).
Under-75 years of age - Cancer mortality
Premature or under 75 years of age mortality from cancer (Persons) in Bury for 2023 (142.6 per 100,000 population in those aged under 75 years) is statistically higher than England average (120.8 per 100,000). Amongst Bury’s statistical neighbours, Bury has the highest premature mortality rate from cancer, with the lowest rate in Bracknell Forest (102.5 per 100,000). Data on inequalities are only available by sex for Bury with higher premature mortality from cancer being seen in 2023 in males (152 per 100,000) compared with females (133.7 per 100,000). Data on deprivation are only available at England level, where a social gradient is observed with higher mortality (146.5 per 100,000) in decile 1 compared with decile 10 (102.4 per 100,000) for 2023.
Mortality rate from all cancers, in persons over 65 years of age
The directly standardised mortality rate from all cancers, in persons over 65 years of age in Bury is 1,248.2 per 100,000 population for the year 2021, higher than Northwest average of 1,108.3 per 100,000 and England average (statistically significant) of 1,030 per 100,000 (Productive Healthy Ageing Profile, 2021). There are no trend data available for Bury and England for mortality rate from all cancers, in persons over 65 years of age. Bury has the highest all cancer mortality rate in persons over 65 years of age in its group of 16 statistical neighbours, with the lowest rate in Bedford of 932.9 per 100,000 (Figure 12).
Figure 12: Directly age-standardised mortality rate from all cancers in persons aged 65 years and over for Bury and its statistical neighbours per 100,000 population (Productive Healthy Ageing Profile, 2021).

Data on inequalities in mortality rate from all cancers in persons over 65 years of age are only available by sex, where cancer mortality in males for the year 2021 is higher (1,404.9 per 100,000) compared with females (1,148,2 per 100,000).
Examining data on inequalities by sex for England show higher (statistically significant) mortality rates for males over 65 years of age at 1279.3 compared with females at 849.4. Data by deprivation are available for England only and shows a deprivation gradient where older age individuals in the most deprived decile (1,168.8 per 100,000) have higher cancer mortality rates compared with the least deprived decile (901.3 per 100,000) (Productive Healthy Ageing Profile, 2021).
Cardiovascular Diseases
Cardiovascular disease (CVD) is a group of disorders that affect the heart and blood vessels, including coronary heart disease (CHD), stroke, heart failure, many causes of dementia and peripheral arterial disease. CVD is a major cause of death and disability in the England. It affects 6 million people and accounts for a quarter of deaths in England. Annual healthcare costs in England relating to CVD are estimated at £7.4 billion, with an annual cost to the wider economy of £15.8 billion (HM Government, 2019).
Under-75 years of age- CVD mortality
Under 75 years of age mortality from CVD (Persons) in Bury (93.1 per 100,000 population in those aged under 75 years) is higher than England (76 per 100,000) average but similar to Northwest average (92.8 per 100,000).
Data in inequalities are only available by sex for Bury with twice higher premature mortality from CVD in males (130.8 per 100,000) compared with females (57.1 per 100,000). Data on deprivation is only available at England level, where a social gradient is observed with higher mortality (109.6 per 100,000) in the most deprived decile (decile 1) compared with decile 10 (54.3 per 100,000).
Mortality rate from all CVDs, in persons over 65 years of age
The directly standardised mortality rate from all CVDs for people over 65 in Bury is 1,050.1 per 100,000 population in 2021, lower than the average for the Northwest (1,092.9 per 100,000) and statistically similar to England average of 1021.4 points per 100,000 (Productive Healthy Ageing Profile, 2021). For the mortality rate from CVD in people over 65, there are no trend data available for Bury or England.
In its group of 16 statistical neighbours, Bury has the 5th lowest CVD mortality rate among people over 65, with the highest rate in Calderdale (1,250.5) and lowest in Bedford (885.3) (Productive Healthy Ageing Profile, 2021).
Figure 13: Directly age-standardised mortality rate from all CVDs in persons aged 65 years and over for Bury and its statistical neighbours per 100,000 population (Productive Healthy Ageing Profile, 2021).

Data on disparities in mortality rates from all CVDs in people over 65 in Bury are only available by sex, with CVD mortality in men being higher and statistically significant (1,382.2 per 100,000) than cancer mortality in women (804.1 per 100,000) for the year 2021.
The mortality rates for men over 65 in England are higher (statistically significant) for 1251 compared to 839.6 for females. Data by deprivation are only available for England and show a deprivation gradient, with older age individuals in the most deprive decile (1,203.5 per 100,000) having higher CVD mortality rates than those in the least deprive decile (834.1 per 100,000) (Productive Healthy Ageing Profile, 2021).
Circulatory Diseases
Below we will Identify the impact of circulatory disease on mortality in older adults (over 65 years of age) in England.
Percentage of deaths with circulatory disease as the underlying cause
This indicator presents the annual percentage of registered deaths where circulatory disease is the underlying cause of death within the age range specified below.
· Aged 65-74 years
Circulatory disease contributes to 20.8% of all deaths in individuals aged 65-74 years in Bury, statistically similar to England’s average of 21.2% (Productive Healthy Ageing Profile, 2020). There is a decreasing trend (statistically significant) in Bury for the percentage of deaths with circulatory disease in population aged 65-74 years based on the five most recent data points. Examining data from 2009-2020, deaths (%) from circulatory disease in individuals aged 65-74 years has ranged from the lowest at 19% in 2019 to the highest at 36.2% in 2009.
Percentage of deaths from circulatory disease as the underlying cause for this age group in Bury declined from 36.2% in 2009 to 24.2% in 2011 and then increased to 28.5% in 2012. This was followed by a decline to 25.2% in 2013 with the percentage of deaths remaining fairly stable until 2015 at 25.1%. Circulatory disease mortality then increased sharply to 29.5% before gradually declining to 19% in 2019. There has been a slight rise to 20.8% in the most recent data from 20.8. England saw a constant decline from 28.4% in 2009 to 21.2% in 2020.
Comparing Bury with England, the percentage of deaths from circulatory disease in Bury were higher than England average from 2009 to 2018 (statistically significant for 2009 and 2016 only) and then lower but statistically similar to England average in 2019 and 2020.
Bury has the 5th highest percentage of deaths with circulatory disease as the underlying cause in its group of similar local authorities, with the highest proportion of deaths in Calderdale at 24.9% and lowest in Wigan at 18.1%
Data on inequalities in Bury are only available by age with no statistical differences by each age group (65-74 years, 75 to 84 years and 85 and over years) when compared with all ages (Productive Healthy Ageing Profile, 2020). The percentage of deaths with circulatory disease as the underlying cause declines with each older age band with the highest percentage in 65-74 years (20.8%), 75-84 years (18%) and lowest in 85+ years (15.4%). Similarly, data for England are also available by age only with statistically lower percentage of deaths with circulatory disease as the underlying cause in those aged 65-74 years (21.2%) and statistically higher in 85 years (22.9%) (Productive Healthy Ageing Profile, 2020).
· Aged 75-84 years
Based on the most recent data for 2020, circulatory disease causes 18% of all deaths in Bury's population aged 75-84 years, which is statistically lower than England's national average of 21.6% (Productive Healthy Ageing Profile, 2020). According to data from 2009 to 2021, deaths (percent) from circulatory disease among people 75-84 years old ranged from the lowest 21.6% in 2020 to the highest 34.8% in 2009.
In Bury, the percentage of deaths with circulatory disease as the primary cause gradually increased (with some fluctuations) from 32.7% in 2009 to 27.1% in 2013. Following this, there was a sharper rise to 32.7% in 2014. From 2014, percentage of deaths with circulatory disease as the primary cause have gradually declined to 18% in 2020. Based on the five most recent data points, percentage of deaths from circulatory disease in Bury are decreasing (statistically significant). In England, the percentage of deaths have been continuously declining from 34.8% in 2009 to 21.6% in 2020.
Comparing Bury with England, the percentage of deaths from circulatory disease were generally slightly lower than England but statistically significant only for the years 2020 In Bury’s group of similar local authorities, Bury has the lowest percentage of deaths in those aged 75-84 years with circulatory disease as the primary cause, with Dudley having the highest percentage at 23.1%.
Only age-based data on inequalities in Bury are available (Productive Healthy Ageing Profile, 2020), and these have been described earlier in the 65-74 years sub-section.
· Aged 85 years and over
In Bury, circulatory disease contributes to 15.4% of all deaths in individuals aged 85 years and over in Bury, statistically below England’s average of 22.9% (Productive Healthy Ageing Profile, 2020). Recent trend based on the five most recent data points for Bury suggests that the percentage of deaths with circulatory disease as the underlying cause in those aged 85 years and over is decreasing (statistically significant). Examining data from 2009-2020, deaths (%) from circulatory disease in individuals aged 85 years and over has ranged from the lowest at 15.4% in 2020 to the highest at 36.1% in 2010.
Percentage of deaths from circulatory disease as the underlying cause in this age group in Bury increased from 31.8% in 2009 to 36.1% in 2020, before gradually declining with slight fluctuations to 15.4% in 2020. England saw a fairly similar trend with deaths (%) gradually declining to 37.9% in 2009 to 22.9% in 2020.
Comparing Bury with England, the percentage of deaths from circulatory disease were generally slightly lower than England but statistically significant only for the years 2009, 2012, 2016 and the two most recent data points of 2019 and 2020.
Bury has the lowest percentage of deaths with circulatory disease as the underlying cause in its group of similar local authorities, with the highest proportion of deaths in Dudley at 26.9%.
Data on inequalities in Bury are only available by age and have been described in the 65-74 years age group sub section earlier.
Respiratory disease
Respiratory disease is one of the top leading causes of premature mortality in England and smoking is the major cause of chronic obstructive pulmonary disease (COPD), one of the major respiratory diseases. Around 55% of these respiratory deaths are considered potentially preventable (OHID, 2021).
Under 75 years of age mortality from respiratory disease
Under 75 years of age mortality from respiratory disease (Persons) in Bury is 35 per 100,000 population, similar to the England average of 33.7 per 100,000.
Data on inequalities are only available by sex for Bury with higher premature mortality from respiratory disease in males (40.9 per 100,000) compared with females (29.6 per 100,000) for 2023. Data on deprivation is only available at England level, which shows a sharp deprivation gradient with higher premature mortality in the most deprived decile (decile 1) of 57.5 per 100,000 compared with 21.9 per 100,000 in the least deprived decile (decile 10) for 2023.
Mortality rate from respiratory diseases, in persons over 65 years of age
This indicator is measured as age-standardised rate of mortality from respiratory disease in persons aged 65 and over per 100,000 population.
Mortality rate from respiratory disease, in persons over 65 years of age per 100,000 population for the year 2021 in Bury (471.3 per 100,000) is slightly higher than England average of 440.8 (although statistically similar) but lower than Northwest average of 529.2. Bury has the 6th lowest mortality from respiratory disease in its group of statistical neighbours with the highest mortality in St. Helens of 638.4 per 100,000 and lowest mortality in Stockport of 375.8 per 100,000 (Figure 14).
Figure 14: Directly age-standardised mortality rate from respiratory disease per 100,000 population, in persons over 65 years of age for Bury and its statistical neighbours (Productive Healthy Ageing Profile, 2021)

Data on inequalities in mortality rate from respiratory disease, in persons over 65 years of age are only available by sex in Bury, where respiratory disease mortality in males in 2021 is higher but statistically similar (578.7 per 100,000) compared with females (402.6 per 100,000). Data by sex for England suggest higher rates in males (544.7) compared with females (370).
Inequalities by deprivation are available for England only and suggests a social gradient, where adults over 65 years of age in the most deprived decile (579.9 per 100,000) have higher respiratory disease mortality rates compared with the least deprived decile (345.1 per 100,000).
Winter mortality index (age 85 plus)
The purpose of the winter mortality measure is to compare the number of deaths that occurred in the winter period (December to March) with the average of the non winter periods (August to November and April to July). Winter mortality is not solely a reflection of temperature, but of other factors as well. These include respiratory diseases and pressure on services, which have been more intense than usual during and following the height of the pandemic. It is an important measure as it allows users to assess whether policies are having an impact on mortality risks during the winter period. The majority of winter deaths occur amongst the elderly population.
The winter mortality index (WMI) is a measure expressed as a ratio of the difference in all cause mortality in those aged 85 and over during winter months (December to March) compared to the average in those aged 85 and over in the non winter months (the preceding August to November and following April to July). The terminology used to describe this indicator has changed to provide clearer explanation of what the analysis represents. The measures have been renamed to winter deaths compared to non winter deaths (previously excess winter deaths) and winter mortality index (WMI) (previously excess winter mortality index). There have been no methodology changes.
Winter mortality index in Bury demonstrates a mixed pattern of increases, decreases, and variations. In the most recent year, from August 2021 to July 2022, the WMI in Bury was 23.5% (statistically similar) compared with England average of 11.3%.
Examining trends in Bury, WMI (aged 85+years) fluctuated over the period Aug 2001 - Jul 2002 to Aug 2021 - Jul 2022 (Figure 15). The WMI ranged from a high of 60.5% in August 2008 - July 2009 to a low of -6.6% in August 2011 - July 2012. From August 2001 to July 2009, the WMI generally increased, reaching its highest point at 60.5% in August 2008 - July 2009. Afterwards, from August 2009 to July 2012, the WMI experienced a mixed pattern, with both positive and negative values. Notably, in August 2011 - July 2012, the WMI was -6.60%, indicating a lower mortality rate during winter compared to non-winter months. From August 2012 to July 2019, the WMI showed further fluctuations, with varying differences in mortality rates between winter and non-winter periods. From August 2019 to July 2020, the WMI in Bury had a negative value of -9.80, after which it increased to 31.3% in August 2020 to July 2021 and 23.5% in August 2021 to July 2022.
The trend of the WMI in England also demonstrates fluctuations over the years. From August 2001 to July 2009, the WMI in England showed a mix of increases and decreases, ranging from 19.30% in August 2003 - July 2004 to a peak of 33.80% in August 2008 - July 2009. This indicates varying differences in mortality rates between winter and non-winter months during that period. Following this, from August 2009 to July 2014, the WMI generally remained lower, with values ranging from 15.80% in August 2013 - July 2014 to 28.20% in August 2012 - July 2013. From August 2014 to July 2018, the WMI experienced another mix of increases and decreases, reaching its highest point at 41.10% in August 2017 - July 2018, and its lowest point at 6.80% in August 2019 - July 2020. This was followed by another increase to 42.8% in August 2020 to July 2021 and then a decline to 11.3% in August 2021 to July 2022.
WMI in Bury was fairly similar to England average for most years, with the exception of August 2008 - July 2009, where the proportion was statistically higher than England average and August 2011 - July 2012 and August 2019 - July 2020 where the proportions were lower than England average.
Figure 15: Winter Mortality Index (WMI) for 85 years and older adults in Bury and England from 2001-2022 (Local Authority Health Profile, 2022)

Bury has the 2nd highest WMI in its group of similar local authorities, with the highest in Sutton at 24.6% and lowest in Bracknell Forest at -10%. Examining inequalities in Bury, females have a higher WMI (28.7%) compared with males (15.3%), although the differences compared with Bury average are not statistically significant.
Males in England have a slightly higher WMI at 11.9% compared with females at 10.9% but the differences compared with Bury average are not statistically significant. Data on inequalities by deprivation are only available by England that suggests no social gradient. However, individuals aged 85 years or over in the third more deprived decile have statistically higher WMI (14.6%) and those in the fourth less deprived decile (7.6%) have statistically lower WMI compared with the overall average for England.
Dementia
Dementia is a syndrome (a group of related symptoms) associated with an ongoing decline of brain functioning. Research shows there are more than 850,000 people in the UK who have dementia. One in 14 people over the age of 65 have dementia, and the condition affects 1 in 6 people over 80. The number of people with dementia is increasing because people are living longer. It is estimated that by 2025, the number of people with dementia in the UK will be more than 1 million. Dementia is one of the leading causes of dependency and disability in older people around the world leading to increased cost in provision of health and social care services (approximately £35 billion). Dementia patients face significant health challenges and may have a mortality risk that is at least twice as high as those without the disease (Lancet, 2021).
Dementia is the leading cause of death for women. For men, the leading cause of death is ischaemic heart disease. Nearly double the number of women (42,000) than men (23,000) in the UK died of dementia in 2022.
Preventing well (Risk factors):
Preventing dementia starts with addressing key lifestyle and health-related risk factors that contribute to cognitive decline. Tackling obesity, reducing smoking rates and encouraging regular physical activity are essential steps in supporting brain health and healthy ageing. By focusing on these areas, we can help reduce the risk of dementia and improve long-term outcomes for older adults in the community.
Obesity (QOF prevalence)
The rationale for including this indicator in the Dementia Profile is because in the NICE Disability, dementia and frailty in later life – mid-life approaches to prevention publication states that people who achieve and/or maintain a healthy weight reduces the risk of developing dementia. The report recommends that national organisations and local government departments that influence public health should continue to develop and support population-level initiatives to reduce the risk of dementia by making it easier for people to achieve and/ or maintain a healthy weight
In Bury, the prevalence of obesity in adults aged 18+ years in Bury was 13.1% for the year 2023/24, statistically above England average of 12.8%. No trend data are available for this indicator. Bury has the 8th highest prevalence of obesity in adults aged 18+ years in its group of similar local authorities with the highest prevalence in Bolton of 17.4% and lowest in Trafford of 11.7%. No data on inequities are available for Bury and England for this indicator.
Smoking Prevalence in adults (aged 18 and over) - current smokers (APS) (1 year range)
In the year 2023, smoking prevalence in adults (aged 18 and over) in Bury was 10.5%, statistically similar to England average of 11.6%. Trend data for Bury suggests that smoking prevalence declined steadily from a peak of 23.3% in 2011 to its current prevalence in 2023, whereas England also saw a similar steady decline from 19.8% in 2011 to 11.6% in 2023. No trend data based on the five most data points are available for Bury and England.
Figure 16: Smoking prevalence in adults (aged 18 and over) - current smokers (APS) (1 year range) in Bury and England from 2011-2023

Bury has the 9th highest smoking prevalence in its group of 16 similar local authorities with the highest prevalence in Tameside (15.9%) and lowest in Sutton (6%). Data on inequalities for Bury are present by sex, housing tenure and socioeconomic group. Data by sex for 2023 suggests that the prevalence of smoking among males in Bury was 12.4%, which was statistically similar to the overall Bury average of 10.5%. Among females, the smoking prevalence was 8.5%, also statistically similar to the local average (Figure 17). Trend data by sex from 2011 to 2023 for Bury suggests that the percentage of current smokers declined for both males and females over the period. In 2011, male smoking prevalence was 24.6% compared to 22% for females. This trend of higher male smoking rates continued through most of the years, although both groups saw a general decline. By 2020, the rates had nearly converged, with males at 12.3% and females at 11.3%. In 2022, female smoking prevalence briefly surpassed that of males, reaching 12.7% compared to 10.8%. However, in 2023, male smoking increased slightly to 12.4% while female smoking dropped to 8.5%, marking the lowest female rate.
Figure 17: Smoking prevalence in adults (aged 18 and over) - current smokers (APS) (1 year range) by Sex in Bury from 2011-2023

There is a clear association between housing tenure and smoking prevalence among adults in Bury in the year 2023. Smoking rates were significantly higher among those living in rented accommodation compared to homeowners. Specifically, 29.6% of adults renting from a local authority or housing association were current smokers (statistically higher than Bury average), the highest among all tenure types. This was followed by 21.1% of those renting privately. In contrast, smoking prevalence was much lower among homeowners, with only 6.2% of those owning their home outright and just 3.9% (statistically lower than Bury average) of those owning with a mortgage identified as current smokers.
Data by socioeconomic group (18-64 years) for Bury suggests that smoking is more prevalent among individuals in lower socioeconomic groups, highlighting a clear gradient in smoking behaviour linked to social and economic status. Smoking prevalence was highest among those who had never worked or were long-term unemployed, with 25.7% identified as current smokers. This was followed by individuals in routine and manual occupations, where 21.1% reported smoking. In contrast, smoking prevalence was significantly lower among those in intermediate occupations (7.9%) and lowest among those in managerial and professional roles (3.7%).
Data by sex for England suggests higher prevalence in males of 13.4% (statistically worse than England average) and a lower prevalence of 9.9% (statistically better than England average) in females. Smoking prevalence among adults varied by housing tenure in England for the year 2023. The highest rate was observed among those renting from a local authority or housing association, with 24.9% (statistically worse than England average) identified as current smokers. This was followed by 17.4% among those renting privately. In contrast, smoking rates were lower among homeowners. Among those owning their home with a mortgage, 7.9% were current smokers, while 6.7% of those owning outright reported smoking. Data by deprivation shows increasing prevalence of smoking with increasing levels of deprivation in England. In 2023, the highest prevalence of smoking was in the most deprived decile at 21.7% and lowest in the least deprived decile at 6.2%.
Percentage of physically inactive adults:
Physical inactivity is defined as engaging in less than 30 minutes of physical activity per week. This is the same definition as one of the KPIs in the current government sport strategy (Sporting Future: A New Strategy for an Active Nation). The strategy reports the percentage of adults physically inactive and is measured by the “percentage doing less than 30 mins physical activity each week”. While increasing the activity levels of all adults who are not meeting the recommendations is important, targeting those adults who are significantly inactive (i.e. engaging in less than 30 minutes of activity per week) will produce the greatest reduction in chronic disease.
Percentage (%) of physically inactive adults (aged 19+ years) in Bury for the year 2023/24 was 21.8%, statistically similar England average of 22%. During the period from 2015/16 to 2023/24, the percentage of physically inactive adults in Bury showed some variation, with proportion generally fluctuating between just under 20.9% and around 25.4%. The highest level of inactivity was recorded in 2016/17 at 25.4%, while the lowest was in 2018/19 at 20.9%, indicating a temporary improvement in physical activity levels. In the most recent year, 2023/24, the proportion stood at 21.8%, suggesting a modest decline in inactivity compared to earlier peaks, though not the lowest in the period.
In England, the trend was more stable, with inactivity rates consistently hovering around 22% to 23%. The national rate peaked slightly in 2020/21 at 23.4%, possibly influenced by the COVID-19 pandemic and associated restrictions. By 2023/24, the rate had decreased to 22.0%, showing a slight improvement. Overall, while Bury’s inactivity levels have been more variable, they have generally followed a similar pattern to the national trend (Figure 18). No trend data based on 5 most recent data points are available for Bury.
Figure 18: Percentage of physically inactive adults in Bury and England from the year 2015/16-2023/24 (Obesity, Physical Activity and Nutrition, 2024)

Bury has the 4th lowest percentage of physically inactive adults in its group of 16 similar local authorities, with the highest percentage of physically inactive adults in Havering (31.5%) and lowest in Calderdale (18.2%).
While data on inequalities in physical inactivity are not available for Bury through the Fingertips platform, they are accessible via the Active Lives Survey. It is important to note that the percentages below do not add up to 100% because they represent the proportion of physically inactive individuals within each group, not the proportion of the total population. According to this most recent survey, covering the period from November 2023 to November 2024, the proportion of physically inactive adults in Bury has slightly increased to 24.6%, compared with the 21.8% previously reported on Fingertips. Below we present a breakdown of inequalities in physical inactivity within Bury, as reported in the Active Lives Survey for the period November 2023 to November 2024:
- Deprivation:
The data from the Active Lives Survey (November 2023 to 2024) highlights a clear deprivation gradient in physical inactivity levels within Bury (Figure 19). As levels of deprivation increases, the proportion of physically inactive adults (less than 30 minutes) decreases. In the most deprived decile (decile 1), 38.2% of adults are classified as inactive. This proportion decreases steadily across the deprivation scale, reaching 17.8% in the least deprived decile (decile 10).
Figure 19: Percentage of physically inactive adults (less than 30 minutes) in Bury by deprivation decile during the period November 2023 to November 2024 (Active Lives Survey, 2024)

- Ethnicity
Data on ethnicity for Bury, available for the period November 2023 to November 2024, are limited to White British ethnic group only. During this period, 21.4% of adults from the White British group in Bury were classified as physically active, compared with 23.6% for the same group across England.
- Working status
Similarly, data on working status in Bury are only available for the categories of employed and retired adults, likely due to small sample sizes in other groups. Among employed adults in Bury, 16.9% were physically inactive, which is lower than the national average of 20.3%. For retired individuals, 38.2% in Bury were physically inactive, higher than the national figure of 32.1%.
Data from the Active Lives Survey (November 2023 to 2024) presents data for no disability or long-term health condition in Bury only. Among those without a disability, 17.7% are classified as physically inactive lower than the national average of 20.2% for England.
- Gender
Examining data by gender, 21.6% of males in Bury are classified as physically inactive (November 2023 to 2024) , which is lower than the national average of 23.7%. Among females, 27.5% in Bury are physically inactive, slightly above the national figure of 26.3%. The survey also includes a category for individuals identifying "in another way," though data for this group are not available for Bury, likely due to small sample sizes. Nationally, 33.2% of individuals in this category are physically inactive (Figure 20).
Figure 20: Percentage of physically inactive adults in Bury by gender during the period November 2023 to November 2024 (Active Lives Survey, 2024)

- Age
Data from the Active Lives Survey (November 2023 to 2024) by age groups in Bury are only available for the 55-74 years age group. In Bury, 23% of adults aged 55-74 years are classified as physically inactive, which is lower than the national average of 25.2%
Diagnosing well and prevalence of dementia
The prime minister’s challenge for dementia included a commitment to increase the number of people living with dementia who have a formal diagnosis. The rationale being that a timely diagnosis enables people living with dementia, their carers and healthcare staff to plan accordingly and work together to improve health and care outcomes. The indicators in this subsection are reported for Bury ICB.
Dementia: Recorded prevalence (aged 65 years and older)
The recorded dementia prevalence provides an indication of the concentration, within a population, of the number of people aged 65 and older who have been diagnosed and who are now living with the condition. This indicator presents the percentage of patients aged 65 years and older with dementia recorded on primary care (GP) practice disease registers.
Recorded prevalence (aged 65 years and older) of dementia in Bury for the year 2024 was 4.8%, higher (statistically significant) than England average of 4.2%. Trend data for Bury suggests that recorded prevalence of dementia declined from 5.19% in 2017 to 4.54% in 2021, this was followed by the prevalence stabilising at 4.8% for both the years 2023 and 2024. Examining trend for England, the prevalence of dementia declined from 4.33% in 2017 to 3.94% in 2021, before increasing and stabilising at 4.2% for both the years 2023 and 2024. Throughout the years 2017 and 2024, dementia prevalence in Bury remained above (statistically significant) the England average. No data were available for the year 2022 for Bury and England (Figure 21). No data on inequities are available for this indicator.
Figure 21: Percentage (%) of patients aged 65 years and older with dementia recorded on primary care (GP) practice disease registers in Bury and England from 2017-2024

Estimated dementia diagnosis rate (aged 65 and older)
The prime minister’s challenge for dementia included a commitment to increase the number of people living with dementia who have a formal diagnosis. The rationale being that a timely diagnosis enables people living with dementia, their carers and healthcare staff to plan accordingly and work together to improve health and care outcomes.
The dementia diagnosis rate shows the percentage of people aged 65 and over who have been diagnosed with dementia, compared to the number expected to have the condition based on their age and sex. It is shown as a rate per 100 people in this age group and expressed as a percentage with 95 percent confidence intervals. For example, a rate of 70 means that 70 out of every 100 people estimated to have dementia have received a formal diagnosis. This helps to show how effectively dementia is being identified in the local population. A higher rate suggests better recognition and recording of dementia, which is important for ensuring individuals receive appropriate care and support.
The dementia diagnosis rate is benchmarked against a national target of 66.7%. Areas with a rate above this are considered significantly better, those around 66.7% are similar to the target and those below are significantly worse. This helps assess how well dementia is being identified locally.
Dementia diagnosis rate in Bury for the year 2024 was 76.2%, significantly better than the national target of 66.7% and higher than the England average of 64.8%. Trend data for Bury shows that the dementia diagnosis rate declined from a peak of 85.3% in 2017 to 73.9% in 2022, before rising to 76.2% in 2024. In comparison, the rate in England increased slightly from 67.9% in 2017 to a peak of 68.7% in 2019, then dropped to a low of 61.6% in 2021. Since then, it has gradually risen to 64.8% in 2024 (Figure 22). No data on inequities are available for this indicator.
Figure 22: Estimated dementia diagnosis rate (aged 65 and older) in Bury and England from 2017-2024

Living well and supporting well
Living well and supporting well with dementia focuses on ensuring individuals receive high-quality care, maintain independence and experience a good quality of life. This section includes indicators such as regular reviews of dementia care plans and also covers the quality and capacity of residential and nursing care for older adults, helping to assess how well local services are meeting the needs of people living with dementia.
Dementia care plan has been reviewed in the last 12 months (denominator incl. PCAs)
This indicator is defined as the percentage of patients diagnosed with dementia whose care plan has been reviewed in a face-to-face review in the preceding 12 months. The percentage of patients receiving the intervention (the denominator includes Personalised Care Adjustments (PCAs), i.e. all patients on the register) gives a more accurate indication of the rate of the provision of interventions as the denominator for this measure covers all patients the indicator applies to, regardless of PCA status and is therefore from a public health perspective the more relevant measure.
In 2023/24, 77.2% of patients diagnosed with dementia had a face-to-face review for their care plan in the preceding month, statistically similar to England average of 75.5%. In Bury, the proportion of people receiving a face-to-face dementia care plan review increased from 80.3% to a peak of 88.2% in 2016/17. This was followed by a gradual decline to 79.9% in 2019/20, and then a sharp drop to 26% in 2020/21 and 30.8% in 2021/22, likely due to the impact of the COVID-19 pandemic. The rate then recovered significantly, rising to 75.5% in 2022/23 and 77.2% in 2023/24. Nationally, the proportion in England remained relatively stable between 77.9% in 2013/14 and 78% in 2018/19, before falling slightly to 75% and then sharply to 39.7% in 2020/21. It has since increased to 52.1%, followed by a strong recovery to 73.6% in 2022/23 and 75.5% in 2023/24 (Figure 22). No data on inequities are available for this indicator
Figure 22: Dementia care plan has been reviewed in the last 12 months (denominator incl. PCAs) in Bury and England from 2013/14-2023/24

Dementia: Percentage of assessed residential care and nursing home beds (aged 65 years and over)
The Prime Minister’s ‘Challenge on Dementia 2020’ highlights that people with dementia should have access to safe and high quality long term care services. It is estimated that 70% of people with dementia may eventually require long-term residential care. Therefore, this indicator highlights the percentage of residential and nursing home dementia beds which have been assessed by the Care Quality Commission. Local service commissioners will then be able to address low levels of assessment where appropriate.
This indicator is defined as the percentage of residential care homes and nursing homes, which have received a rating from the Care Quality Commission, suitable for persons with dementia, (aged 65 years and older). In the year 2023, 100% of residential and nursing home dementia beds were assessed by the Care Quality Commission, statistically better than England average of 95.9%.
Examining trend data for Bury, the percentage of beds assessed by the Care Quality Commission rose significantly from 83.9% in 2018 to 97.4% in 2019, reaching 100% in 2020. This full assessment rate has been maintained consistently through to 2023, indicating strong regulatory coverage of dementia-appropriate care settings. In England, the percentage has remained high and relatively stable, ranging from 93.9% in 2018 to 96.4% in 2021, with a slight dip to 95.7% in 2022 and a small increase to 95.9% in 2023. While consistently strong, England’s rate has not reached the full coverage (Figure 23). No data on inequities are available for this indicator.
Figure 23: Dementia: Percentage of assessed residential care and nursing home beds (aged 65 years and over) in Bury and England from 2018-2023

Dementia: Residential care and nursing home bed capacity (aged 65 years and over)
This indicator illustrates the number of residential care and nursing home beds, per 100 persons registered with dementia (aged 65 years and older) per ICB and local authority. It is highly recommended that this indicator is interpreted together with two companion metrics ‘Dementia: Quality rating of residential care and nursing home beds (aged 65 years and older)' and 'Dementia: Percentage of assessed residential care and nursing home beds (aged 65 years and older)'. In Bury, the residential care and nursing home bed capacity for people aged 65 and over with dementia is 69.7 beds per 100 individuals diagnosed with dementia or 69.7%. This is statistically similar to the England average of 73.3 beds per 100.
In Bury, residential care and nursing home bed capacity for people aged 65 and over with dementia increased from 59.3% in 2018 to a peak of 75.0% in 2020 and 2021. However, this was followed by a decline to 69.7% in 2023. In comparison, England saw a more gradual rise from 68.1% in 2018 to a peak of 76.5% in 2021, before falling slightly to 73.3% in 2023 (Figure 24). No data on inequities are available for this indicator
Figure 24: Dementia: Residential care and nursing home bed capacity (aged 65 years and over) in Bury and England from 2018-2023

Dementia: Quality rating of residential care and nursing home beds (aged 65 years and older)
This indicator illustrates the percentage of residential care home and nursing home beds, suitable for a person with dementia (aged 65 years and older), which are rated as ‘good’ or ‘outstanding’ by the Care Quality Commission (CQC), per ICB and local authority. It provides information regarding the quality of residential care home and nursing home beds, specifically those suitable for persons with dementia (aged 65 years and older).
The percentage of residential care home and nursing home beds, suitable for a person with dementia (aged 65 years and older), which are rated as ‘good’ or ‘outstanding’ by the Care Quality Commission (CQC) in Bury ICB was 79.5% in 2023, statistically similar to England average of 73.3%.
In Bury, the percentage of beds rated as ‘good’ or ‘outstanding’ rose from 74.8% in 2018 to a peak of 83.7% in 2020. This was followed by a slight decline to 79.8% in 2021, a small increase to 80.4% in 2022, and a slight dip to 79.5% in 2023. Overall, the trend shows consistently high quality with some year-to-year variation.
In England, the trend has been more stable. The percentage increased from 68.5% in 2018 to 74.1% in 2020, dipped slightly to 72.5% in 2022, and then rose again to 74.5% in 2023 (Figure 24). No data are available for the year 2022 and by inequities for both Bury and England.
Figure 24: Dementia: Quality rating of residential care and nursing home beds (aged 65 years and older) in Bury and England from 2018-2023

Dying well
The Dying Well section focuses on the quality and setting of end-of-life care for people with dementia. It includes indicators such as mortality rates and place of death, whether in hospital, care homes or at home. These measures help to understand how well local services support individuals with dementia to die with dignity, in their preferred setting and with appropriate care
Direct standardised rate of mortality: People with dementia (aged 65 years and over)
Mortality rate of people with dementia aged 65 years and over is measured as directly age standardised rate of mortality in persons (aged 65+) with a recorded mention of dementia or Alzheimer’s per 100,000 population.
The mortality rate from dementia in Bury based on the most recent data in 2023 is 969 per 100,000, higher (statistically significant) than England average of 828 per 100,000.
Mortality rate in Bury increased from 1,087 per 100,000 in 2018 to 1,344 per 100,000 in 2020, before declining to 1,020 per 100,000 in 2021 and 969 per 100,000 in 2023. Data for England suggests a slight increase from 918 in 2018 to 1,063 in 2020, followed by a slight decline to 828 in 2023. The mortality rate in Bury has remained higher (statistically significant) than England average throughout the years from 2018 to 2023 (Figure 25).
Figure 25: Directly age standardised rate of mortality in persons (aged 65+) with a recorded mention of dementia or Alzheimer’s per 100,000 population in Bury compared with England from 2018-2023

Bury has 5th highest mortality rate in people with dementia in its group of statistical neighbours with the highest mortality in Warrington of 1,164 per 100,000 and lowest mortality in Bracknell Forest of 540 per 100,000 (Figure 23). There are no data on inequalities for Bury and England.
Place of death: People with dementia (aged 65 years and older)
This indicator measures the percentage of deaths among people aged 65 and over with a mention of dementia or Alzheimer’s disease on their death certificate, broken down by place of death specifically, whether the person died at home, in a care home or in a hospital. It uses resident-based data, meaning it reflects where people lived rather than where they died. This helps to understand patterns in end-of-life care and whether people with dementia are able to die in their preferred or most appropriate setting, which is an important aspect of quality care at the end of life.
In Bury, 15.5% of deaths occurred at home, 53.6% in care homes and 27.5% in hospitals. In comparison, the England averages were 15.9% at home, 56.4% in care homes and 26.3% in hospitals (Figure 26). This suggests that Bury has a slightly lower proportion of deaths occurring in care homes and at home and a slightly higher proportion in hospitals compared to the national average.
Figure 26: Percentage (%) of deaths of people with dementia or Alzheimer’s disease by place of death for Bury and England in the year 2023

Well-being and Wider determinants of health
For older adults, wider social determinants of health such as access to housing, food, financial resources, climate change and transportation, as well as social connections, play a critical role not only in better health outcomes, but also in improving overall well-being.
Older people in poverty: Income deprivation affecting older people Index (IDAOPI)
The Income Deprivation Affecting Older People Index (IDAOPI) measures the proportion of all those aged 60 or over who experience income deprivation. It is a subset of the Income Deprivation Domain which measures the proportion of the population in an area experiencing deprivation relating to low income. The definition of low income used includes both those people that are out-of-work, and those that are in work but who have low earnings (and who satisfy the respective means tests).
Although there are no national targets the Government aims to tackle poverty and promote greater independence and well-being in later life. People living in more deprived areas have a greater need for health services.
Income Deprivation Affecting Older People Index (IDAOPI) in Bury for the year 2019 is 14.5%, statistically higher than England average of 14.2%. There are no trend data available for Bury and England.
Bury has the 11th highest IDAOPI in its group of similar 16 local authorities (Figure 27), with the highest proportion in Rochdale at 20.3% and lowest in Bedford at 11.5%.
Figure 27: Income deprivation affecting older people Index (IDAOPI) (60 years and over) for Bury and its statistical neighbours

Homelessness - households owed a duty under the Homelessness Reduction Act (main applicant 55+ yrs)
Homelessness is associated with severe poverty and is a social determinant of health. It can often result from a combination of events such as debt, relationship breakdown, adverse experiences in childhood and through ill health. In recent years there has been a significant increase in homelessness experienced by older people. Households are increasingly living in the growing private rented sector, and loss of assured shorthold tenancy is the main cause of statutory homelessness. Many older households also live in poverty.
Homelessness is associated with poor health, and existing health conditions are exacerbated by homelessness. For example, older people experiencing homelessness are more likely to suffer from depression and dementia. (LGA, 2017)
The Homelessness Reduction Act (HRA) introduced new homelessness duties which meant significantly more households are being provided with a statutory service by local housing authorities than before the Act came into force in April 2018. The HRA introduced new prevention and relief duties, that are owed to all eligible households who are homeless or threatened with becoming homeless, including those single adult households who do not have ‘priority need’ under the legislation.
This indicator is defined as households owed a prevention or relief duty under the Homelessness Reduction Act, where the main applicant is aged 55 years and over, crude rate per 1,000 estimated households where the household reference person is aged 55 years and over.
The crude rate for households owed a duty under the Homelessness Reduction Act (main applicant 55+ yrs) in Bury for the year 2021/22 was 1.8 per 1,000 households, statistically better than England average of 2.8 per 1,000 households.
Data for Bury from the period 2019/20 to 2021/22 suggests that the rate in Bury has declined over time with 2.8 per 1,000 households owed a duty under the HRA in 2019/20, reducing to 1.9 in 2020/21 and 1.8 in 2021/22. England rates are fairly stable with 2.9 per 1,000 households owed a duty under HRA in 2019/20, declining slightly to 2.3 in 2020/21 before increasing to 2.8 in 2021/22. Recent trend for Bury could not be calculated.
Figure 28: Crude rate per 1,000 households owed a duty under the Homelessness Reduction Act (main applicant 55+ yrs) in Bury compared with England from 2019/20-2021/22

Bury has the 3rd lowest crude rate per 1,000 households owed a duty under the Homelessness Reduction Act (main applicant 55+ yrs) in its group of similar 16 local authorities, with the highest proportion in Stockton-on-Tees at 5.5 and lowest in Calderdale at 1.7.
There are no data on inequalities for Bury. Data for England are available by deprivation only with higher rates than England average in the top 5 most deprived deciles (highest in 4th more deprived decile at 4.7) and lower than England average rates in the 5 least deprived deciles (lowest in the least deprived decile at 2).
Older people living alone (65 years and over)
Social isolation, loneliness and higher levels of deprivation are all linked with pensioners who live alone. There is a clear link between loneliness and poor mental and physical health. Although the links between isolation and loneliness are complex, for older people there is a strong correlation between isolation and loneliness. A key element of the Government’s vision for social care, set out in the Care and Support White Paper, is to tackle loneliness and social isolation, supporting people to remain connected to their communities and to develop and maintain connections to friends and family. The White Paper sets out steps to support these aims, and makes a commitment to develop, with local government, suitable measures of loneliness and isolation for inclusion in the Adult Social Care Outcomes Framework (ASCOF) and the Public Health Outcomes Framework (PHOF).
This indicator is defined as the number of over 65 year olds living alone as a percentage of the total number of over 65 year old respondents to the census question. Data are not available on Fingertips and have been sourced from NOMIS.
According to the 2021 census data, the percentage of older individuals living alone in Bury has decreased to 30%, which is lower than the 32.7% reported in the 2011 census. Similar shift in the living arrangements of older individuals have been observed in England, with percentage of older people living alone decreasing from 31.5% in 2011 to 28.9% in 2021.
Ward level data are also available from Census 2021 for the percentage of older individuals living alone in Bury. The highest proportion of older people who live alone are in Besses (36.9%), Redvales (34.7%) and St. Mary’s (34%) and lowest proportion are in North Manor (24.3%).
Figure 29: Percentage of older people living alone as a percentage of the total number of over 65 year old respondents to the census question by Bury wards (Census, 2021)

Social isolation: Percentage of adult carers who have as much social contact as they would like (65 plus years)
A strong correlation exists between loneliness and poor mental and physical health, particularly among older individuals. While the relationship between isolation and loneliness is intricate, it is evident that isolation is closely associated with feelings of loneliness in the elderly.
This indicator is measured as the percentage of respondents to the Personal Social Services Survey of Adult Carers in England who responded to the question "Thinking about how much contact you have had with people you like, which of the following best describes your social situation?" with the answer "I have as much social contact I want with people I like".
For the period 2022/23, 34.7% of adult carers aged 65 years and over reported having as much social contact as they would like, statistically similar to England average of 41.5%. Examining data from 2014/15 to 2022/23, the percentage in Bury rose from 41% in 2014/15 to a peak of 49.1% in 2015/16. It then fluctuated slightly before dropping significantly to 38.9% in 2018/19. After a brief recovery to 45.1% in 2019/20, the rate declined again, reaching its lowest point of 34.7% in 2022/23. This suggests a growing concern around social isolation among older carers in recent years. In England, the trend has been more stable. The percentage started at 42.8% in 2014/15, peaked at 44% in 2017/18, and then declined to a low of 37.3% in 2021/22. It recovered slightly to 41.5% in 2022/23 (Figure 30).
Figure 30: Percentage of adult carers who have as much social contact as they would like (65 plus years) in Bury compared with England from 2014/15-2022/23

Bury ranks 4th lowest in its group of 16 similar local authorities, with the highest proportion in Stockton-on-Tees at 53.8% and lowest in Bracknell Forest at 25.2%. There are no data on inequalities available for Bury and England.
Long-term conditions
The most important economic, health, and social challenge we face today is the phenomenon of the ageing population. Moreover, the rise in chronic and degenerative diseases is one of the most significant epidemiologic trends of our time (Maresova et al, 2019). Ageing population tends to have a higher prevalence of chronic diseases that require a long period of treatment leading to increase in demand for healthcare services and changes its nature. This need for long-term care can also lead to a decline in the quality of life of older age individuals.
There are limited publicly available data on long-term conditions limited to this age group as most indicators cover wider age groups and have been described in the Living Well section. Available data specific to older adults are presented below.
Blind or partially sighted
Promoting the prevention of vision impairment is crucial for enabling individuals to maintain their independence and minimising their reliance on social care support in case of permanent sight loss. Research conducted by the Royal National Institute for Blind People (RNIB) indicates that timely detection and treatment could prevent approximately 50% of blindness and severe sight loss cases. The main causes of preventable sight loss are untreated cataracts and uncorrected refractive errors. However, the research suggests that there is a lower-than-expected uptake of sight tests, particularly in socially deprived areas. This low participation in sight tests often leads to delayed identification of treatable conditions and increased sight loss due to late intervention.
Preventable sight loss is widely recognised as a significant public health issue that can be addressed. The World Health Organization's global initiative for the elimination of avoidable blindness, "Vision 2020 The Right to Sight”, to which the UK is a signatory, emphasises the priority of preventing avoidable sight loss. This objective is also a key focus for Vision UK. Given the ageing population, this issue becomes even more critical.
According to the Law Commission report, it is recommended that local authorities maintain a register of individuals who are blind or partially sighted (Paragraphs 12.15 to 12.18). The Department of Health and Social Care Ministers have accepted this recommendation. The registration process with a local authority and access to services start with the completion of a Certificate of Visual Impairment (CVI) by a consultant ophthalmologist.
People aged 65-74 registered blind or partially sighted
This indicator is measured as a crude rate of the number of people aged 65-74 registered blind or partially sighted with local authorities in England as at the 31st March per 100,000 population aged 65 to 74 years.
The crude rate in Bury for the period 2022/23 was 456 per 100,000 population aged 65-74 years, statistically similar to England average of 533 per 100,000 population aged 65-74 years.
Six data points are available for Bury from 2007/08 to 2022/23. The rates in Bury declined from the highest rate of 1,225 per 100,000 in 2007/08 to 930 per 100,000 in 2010/11 and 471 per 100,000 before declining further to 358 per 100,000 in 2019/20 and then increasing slightly to 456 per 100,000. No recent trend could be calculated for Bury. Data for England shows a gradual decline from 737 per 100,000 in 2007/08 to 533 per 100,000 in 2022/23 (Figure 31).
Figure 31: Crude rate of the number of people aged 65-74 registered blind or partially sighted with local authorities in England as at the 31st March per 100,000 population aged 65 to 74 years in Bury compared with England from 2007/08-2022/23

The crude rate in Bury for the period 2022/23 is the 4th lowest in its group of 16 similar local authorities with the highest rate in Bolton (969 per 100,000) and lowest rate in Bracknell Forest (332 per 100,000).
There are no data on inequalities for Bury and England.
People aged 75+ registered blind or partially sighted
This indicator is measured as a crude rate of the number of people aged 75+ years registered blind or partially sighted with local authorities in England as at the 31st March per 100,000 population aged 75 years and over.
The crude rate in Bury for the period 2022/23 was 2,073 per 100,000 population aged 65-74 years, significantly below England average of 3,031 per 100,000 population aged 75 years and over.
In Bury, there are six data points available spanning from 2007/08 to 2022/23 (Figure 32). The rates of registered blind or partially sighted individuals in Bury showed a decline over this period, starting from the highest rate of 7,845 per 100,000 in 2007/08. The rates then decreased to 4,165 per 100,000 in 2013/14 and further to 4,069 per 100,000 in 2016/17, before experiencing a sharp decline to 2,424 per 100,000 in 2019/20 and then to 2,073 in 2022/23. It is important to note that no recent trend could be calculated based on the available data for Bury. For England as a whole, the data indicates a gradual decline in rates from 5,119 per 100,000 in 2007/08 to 4,268 per 100,000 in 2013/14. The rates continued to decrease to 3,994 per 100,000 in 2016/17 and reached the lowest rate of 3,031 per 100,000 in 2022/23.
Figure 32: Crude rate of the number of people aged 75+ years registered blind or partially sighted with local authorities in England as at the 31st March per 100,000 population aged 75 years and over in Bury compared with England from 2007/08-2022/23
The crude rate in Bury for the period 2022/23 is the 4th lowest in its group of similar local authorities with the highest rate in Bolton (6,545 per 100,000) and lowest in Bracknell Forest (1,607 per 100,000).
There are no data on inequalities for Bury and England.
Common mental health disorders
This indicator is measured as estimated prevalence of common mental disorders: % of population aged 65 & over. It offers local health and care systems an estimation of the prevalence of common mental disorders (CMD) within their area. Its purpose is to aid in the planning of preventative mental health interventions, as well as mental health care and services, including access to psychological therapies through the Improving Access to Psychological Therapies (IAPT) programme.
While there may be some local-level estimates for specific CMDs, there are no other validated estimates available for the prevalence of all CMDs. This indicator aims to fill this gap by providing a reliable estimate of local CMD prevalence using national survey data applied to local demographics.
The primary audience for this indicator includes local health and care policymakers, practitioners, and intelligence specialists involved in the provision, planning, and commissioning of services aimed at reducing mental illness and enhancing mental health care for individuals with CMD. By offering estimates of absolute and relative need, this indicator enables policymakers and service providers to take action to improve the mental health and quality of life for those living with CMD. It will also assist national IAPT leads in future planning cycles for the IAPT programme.
There are no recent estimates for Bury and England, with the latest available data for the year 2017. The estimated prevalence of common mental disorders in Bury for the year 2017 was at 10.7%, statistically similar to England average of 10.2%. There are no trend data for Bury and England (Productive Healthy Ageing Profile, 2017).
Bury had the 9th highest prevalence in its group of 16 similar local authorities with the highest prevalence in Rochdale (12.1%) and lowest in Swindon (6.5%) (Productive Healthy Ageing Profile, 2017).
There are no inequalities data available for Bury and England.
Falls, Frailty and Mobility
As individuals age, the process of ageing can introduce barriers that hinder their ability to live a healthy and safe life within the community. These barriers often manifest as difficulties in performing activities of daily living (ADLs), which encompass various aspects of daily functioning. Specifically:
1. Mobility: This refers to the capacity to move independently or with the aid of assistive devices within an environment (Weber et al, 2010). Difficulties with mobility can include tasks such as navigating stairs, walking along a road, or moving around one's own home
2. Personal care: This involves undertaking tasks necessary to maintain personal hygiene, including activities like washing, toileting, and medication administration.
3. Domestic care: This encompasses activities aimed at maintaining a healthy living environment, such as cooking meals and cleaning.
It is important to note that older individuals may experience a progression of difficulties, where they may struggle with domestic tasks while still maintaining independence in personal care. However, these challenges can be further exacerbated by issues related to frailty, which can impact an individual's overall ability to cope with daily tasks.
The ageing process presents a range of challenges for older individuals, including frailty, illnesses, and age-related conditions such as dementia. Consequently, some older people may require support from social care services to address their specific needs, particularly when they struggle with basic self-care tasks.
Frailty is characterised by low energy, slower walking speeds, and poor strength, and it is not an inevitable outcome of the ageing process (BGS, 2017). However, the prevalence of frailty tends to increase with age, with women being more likely to be affected compared to men. The severity of frailty also tends to escalate significantly in the year leading up to death (Steptoe A et al, 2013).
The impact of ageing and the loss of independence can have adverse effects not only on an individual's life but also on the broader health and social care system. This is due to the increased demand for costly and intensive support services. These services are guided by the statutory obligations outlined in the Care Act 2014, which places a responsibility on Local Authorities to prioritise person-centred care that considers the physical, mental, and emotional well-being of individuals. The goal is to achieve this through the implementation of strengths-based and preventative care and support services. This approach is crucial because many age-related conditions that worsen mobility and personal care challenges can be mitigated, delayed, or even prevented through early lifestyle adjustments and targeted interventions.
Emergency hospital admissions due to falls in people aged 65 and over
Falls are the leading cause of emergency hospital admissions among older individuals, significantly impacting their long-term outcomes. For instance, falls often serve as a major factor leading individuals to transition from their own homes to long-term nursing or residential care settings (DOH, 2012).
The risk of falls is most pronounced among those aged 65 and above. It is estimated that a substantial proportion of individuals in this age group experience at least one episode of falling each year, including approximately 30% (2.5 million) of those living at home and around 50% of those residing in residential care or continuing to live at home at the age of 80 and above (NICE, 2017). Falls resulting in injuries can have severe consequences, with approximately 1 in 20 older adults in the community experiencing fractures or requiring hospitalisation as a result of falls. In England alone, falls and fractures among individuals aged 65 and above account for over 4 million bed days per year, generating an estimated cost of £2 billion (RCP, 2011).
To address the issue of falls, the National Institute for Health and Clinical Excellence (NICE) has developed a quality standard that focuses on assessing and preventing further falls (secondary prevention) in older people living in the community and during hospital stays. This standard aims to drive measurable improvements across three dimensions of quality: patient safety, patient experience, and clinical effectiveness (NICE, 2017).
It is important to note that this measure should be understood in the context of assessing health service utilisation rather than determining individual need. Not all injurious falls lead to emergency admissions, and it should not be used as a sole indicator of falls prevention service effectiveness. Various underlying conditions, such as osteoporosis, can increase susceptibility to injuries, and the treatment of such conditions falls under the purview of other healthcare services.
Emergency hospital admissions for falls injuries in persons aged 65 and over is measured as a directly age standardised rate per 100,000. Data from 2023/24 shows that the rate in Bury was 2,131 per 100,000, statistically similar to England average of 1,984 per 100,000. No trend data are available for Bury and England (Figure 33).
Figure 33: Directly age standardised rates of emergency hospital admissions for falls injuries in persons aged 65 per 100,000 population aged 65 years and over in Bury compared with England from 2010/11-2022/23
Bury has the 5th highest rate of emergency hospital admissions for falls injuries in persons aged 65 and over in its group of 16 similar local authorities with the highest rate in Rochdale at 2,361 and lowest in Swindon at 1,369.
Data on inequalities in Bury are only available by sex with statistically higher admission rates (2,363) compared to Bury average in females and statistically lower rates (1,810) compared to Bury average in males for the year 2023/24. Similar inequalities are seen in England with statistically higher than the average rates in females (2,230) and lower (1,661) rates in males. Data by levels of deprivation are available at England only with higher rates in the three most deprived deciles and lower rates in the four least deprived deciles.
Hip Fractures
Hip fracture is a debilitating condition that has significant implications for individuals' independence. Only one in three individuals who experience a hip fracture are able to regain their former levels of independence, while one in three end up leaving their own homes and transitioning to long-term care. The prevalence of hip fractures is nearly as common and costly as strokes, and the incidence of these fractures is on the rise. In the UK, approximately 75,000 hip fractures occur annually, resulting in an estimated health and social cost of around £2 billion per year.
The average age of individuals experiencing hip fractures is approximately 83 years, and the majority of fractures, about 73%, occur in women. Moreover, there is a high prevalence of comorbidity in individuals with hip fractures. According to the National Hip Fracture Database mortality rates associated with hip fractures are substantial, with approximately one in ten individuals with a hip fracture passing away within one month and approximately one in three within twelve months (NHFD, 2013).
Hip fractures are measured as directly age standardised Emergency Hospital Admission rate for fractured neck of femur in persons aged 65 and over per 100,000. Interventions aimed at recently retired and active older individuals are expected to differ in terms of provision and uptake compared to interventions for frailer older people.
Emergency Hospital Admission rate for fractured neck of femur in persons aged 65 and over per 100,000 population 65+years and over
Data from 2023/24 shows that Bury’s rate of 574 per 100,000 was statistically similar to England average of 547 per 100,000. In Bury, the admission rate has fluctuated over time. It started at 684 per 100,000 in 2010/11, dropped to a low of 573 in 2012/13, and then rose again to a peak of 699 in 2022/23. The most recent rate in 2023/24 was 574. These variations suggest no consistent upward or downward trend, but rather year-to-year changes. In England, the trend shows a more consistent decline. The rate decreased from 615 per 100,000 in 2010/11 to 547 in 2023/24, with a few small fluctuations along the way. This indicates a gradual improvement nationally in preventing or managing falls and fractures among older adults. No trend data are available for Bury and England (Figure 34).
Figure 34: Emergency Hospital Admission rate for fractured neck of femur in persons aged 65 and over per 100,000 population 65+years and over in Bury and England from 2010/11-2023/24
Bury has the 8th highest rate of emergency hospital admissions for hip fractures in persons aged 65 and over in its group of 16 similar local authorities with the highest rate in Warrington at 667 and lowest in Trafford at 497. Data on inequalities in Bury are only available by sex with statistically higher admission rates (714) in females and statistically lower rates (385) in males compared to Bury average. Similar inequalities are seen in England with statistically higher than the average rates in females (665) and lower (393) rates in males. Data by levels of deprivation for England shows a deprivation gradient with increasing rates of falls with higher levels of deprivation. The highest rates are in the most deprived decile (593) and lowest in least deprived decile (502).
Care homes per 100 people 75+ years
Examining data on care home beds allows us to understand the trends and variations in availability of care home beds in nursing and residential care homes.
This indicator is defined as the annual proportion of beds in care homes (all; nursing and residential) crude rate per 100 population aged 75 and over. This is an all-age indicator because people under 75 years of age can also use care home beds.
The rate for Bury in 2021 was at 11.5 per 100 compared with 9.4 per 100 for England. Significance compared to England average could not be calculated. Examining data from 2011 to 2021, the crude rate of care home beds per 100 people 75+ years in Bury remained stable from 13.6 in 2011 to 13.5 in 2014. This was followed by a period of gradual decline to 11.5 per 100 in 2021. Similar to Bury, rates in England remained fairly stable with slight fluctuation from 10.8 in 2011 to 10.8 in 2014 and then a gradual consistent decline to 9.4 in 2021. There has been no significant change in trend based on the 5 most recent data points.
Comparing Bury with England, the rates have been higher (statistical significance could not be calculated) than England average throughout the observed period from 2011-2021.
Figure 35: Crude rate of care home beds per 100 people 75+ years in Bury and England from 2006/07-2021/22
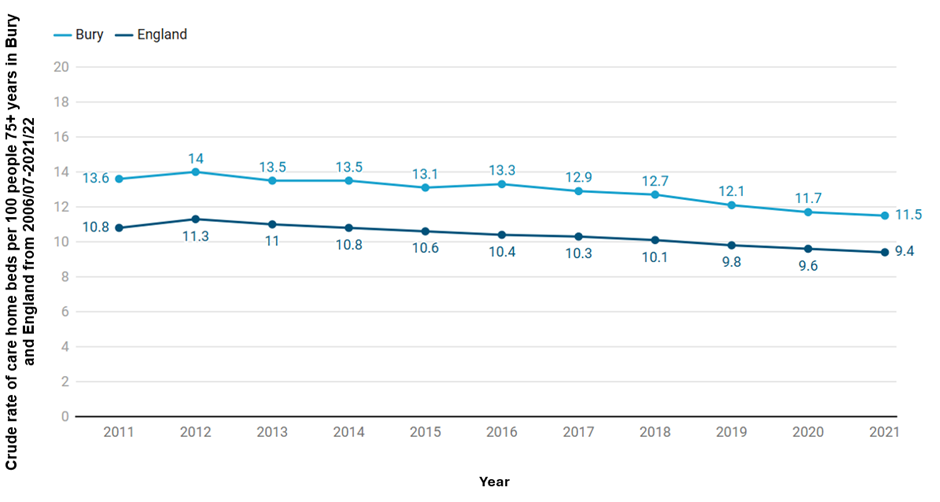
Bury has the 3rd highest crude rate of care home beds per 100 people 75+ years in its group of 16 similar local authorities, with the highest in Stockton-on-Tees at 12 and lowest in Bolton at 8.1. There are no data on inequalities available for Bury. Data for England are available by deprivation only. The highest rate is in the most deprived decile (10.6) and lowest in the third less deprived decile (8.6).