Alcohol
Alcohol misuse is the fifth leading cause of death, ill health and disability across all ages, and single largest cause among people aged 15-49 years in the UK. According to the NHS website, in order to keep health risks from alcohol to a low level if you drink most weeks, men and women are advised not to drink more than 14 units a week on a regular basis.
Alcohol causes more than 60 medical conditions, including: mouth, throat, stomach, liver and breast cancers, high blood pressure, cirrhosis of the liver and depression. Alcohol is also an important contributor to health inequalities: alcohol-related mortality increases with increasing deprivation and is higher in men than women. Alcohol consumption, risky drinking, and deaths linked to alcohol increased nationally during the COVID-19 pandemic, particularly among people from lower socioeconomic positions and among women (Jackson et al, 2022; Angus et al, 2023). Alcohol-related illness and deaths are therefore likely to increase in the coming years. While the adverse effects of alcohol increase with both volume and frequency of consumption, several risk factors influence the extent of harm experienced by individuals:
- Age: Children and young people are particularly susceptible to alcohol-related harm.
- Gender: Women are more vulnerable to harm from higher levels of alcohol consumption or specific drinking patterns.
- Familial risk factors: Exposure to abuse and neglect during childhood and a family history of alcohol use disorders (AUD) significantly increase vulnerability.
- Socioeconomic status: Individuals with lower socioeconomic status face considerably higher levels of alcohol-related harm.
- Culture and context: The risk of harm varies depending on the cultural and contextual factors surrounding drinking, such as the severe penalties and dangers associated with drink-driving.
- Alcohol control and regulation: The level and effectiveness of alcohol control and regulations in a country are crucial in determining the extent of alcohol-related harm
The public health burden of alcohol is extensive, including health, social and economic harms.
These harms can be divided into three main categories:
- Direct economic costs: Expenses related to health and social care, the police and criminal justice system, and the unemployment and welfare systems. In England, healthcare costs for alcohol-related treatments are estimated at £4.91 billion annually, criminal justice costs at £14.58 billion, and social services costs at £2.89 billion.
- Indirect costs: Lost productivity due to absenteeism, unemployment, decreased output, reduced earning potential and lost working years due to early retirement or death. This costs the wider economy £5.06 billion annually in England.
- Intangible costs: Involves the pain and suffering experienced, poor quality of life, and financial strain on families where money spent on alcohol could have been used for other essential needs.
Alcohol related harm
Alcohol related harm is largely determined by the volume of alcohol consumed and the frequency of drinking occasions. The risk of harm is directly related to levels and patterns of consumption. There can be a considerable lag between alcohol consumption and alcohol-related harms, particularly for chronic conditions where the delay can be many years. 28.6% of adults in Bury drink over the recommended 14 units of alcohol a week (2015-18), which is statistically similar to the figure for England of 22.8% and for the North West of 25.7% (Public Health Profiles, 2018). Although it is considered not significantly different to the figures seen nationally and regionally, it is important to note that more than 1 in 4 adults in Bury are drinking over the recommended amount of alcohol.
In England, it is estimated that just under a quarter of the population (23%*) are drinking above the 14 units per week level and so may benefit from some level of intervention. However, harm can be short-term and instantaneous, due to intoxication, or long-term, from continued exposure to the toxic effect of alcohol or from developing dependence. The official alcohol commissioning support guidance recommends a range of different interventions:
- Effective population-level actions to control supply and marketing
- Large scale delivery of targeted brief advice
- Specialist alcohol care services for people in hospital
- Quick access to effective, evidence-based alcohol treatment
Please note: Comparisons in this section are made with Calderdale, the closest statistical neighbour to Bury, as well as with the North West region and England where appropriate.
Prevalence and unmet need in adults aged 18+ years
According to the most recent data from the National Drug Treatment Monitoring System (NDTMS) for 2019/20, Bury has a slightly higher proportion of adults requiring alcohol treatment compared to the national average for England. There has been an increase in rate of alcohol users from 13.9 per 1000 in 2015/16 to 15 per 1000 in 2018/19, followed by slight decrease to 14.5 in 2019/20. Rates in England have remained relatively stable during this time period. Approximately three out of four alcohol users (74%) in Bury for the year 2023/24 have their needs unmet.
Table 1: Estimated prevalence and unmet need for alcohol treatment in Bury and England (NDTMS)

Admission episodes for alcohol-related conditions (Narrow)
Alcohol consumption is a contributing factor to hospital admissions and deaths from a diverse range of conditions. Alcohol misuse is estimated to cost the NHS about £3.5 billion per year and society as a whole £21 billion annually.
Admission episodes for alcohol-related conditions (Narrow) is a measure of hospital admissions where the primary diagnosis (main reason for admission) is an alcohol-related condition. This represents a Narrower measure. Since every hospital admission must have a primary diagnosis it is less sensitive to coding practices but may also understate the part alcohol plays in the admission. This indicator is presented as Directly age standardised rate per 100,000 population (standardised to the European standard population).
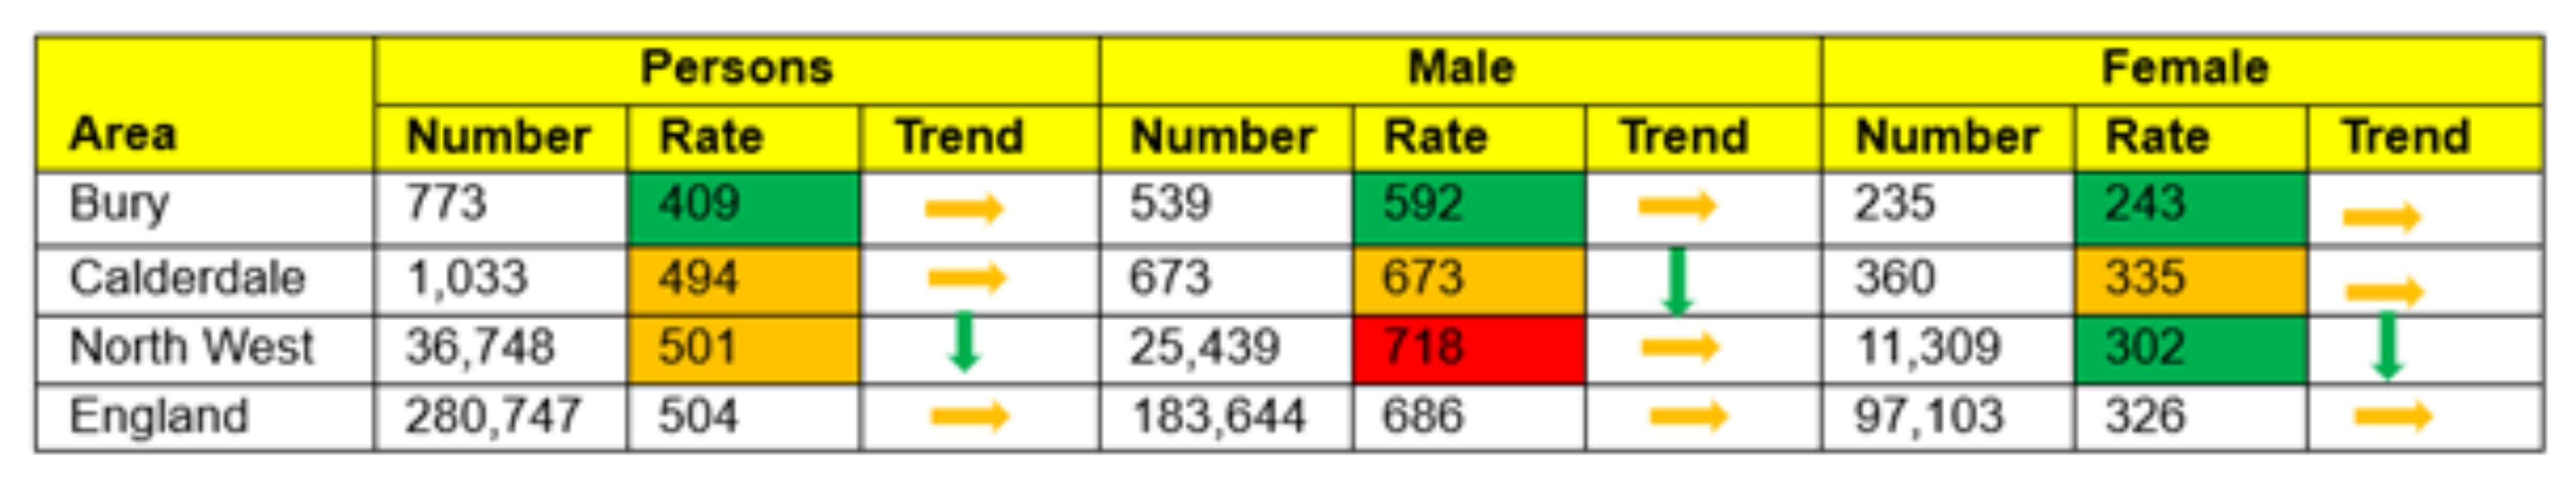
For the year 2023/24, there were 773 admission episodes for alcohol-related conditions (Narrow) in Bury, with a directly age-standardised rate (persons) of 409 per 100,000 population. Among males, the rate was 592 and among females, 243. All rates were statistically better than the England averages. Nationally, England reported 280,747 admission episodes for alcohol-related conditions (Narrow), with an overall rate of 504. The male rate was 686 and the female rate was 326. Based on the 5 most recent data points, the trend in Bury showed no significant change for persons or by sex. England also showed a similar trend across all groups. Rates in Calderdale were similar to England average, whereas rates in Male in the North West are higher than England average (See table 2 below). Overall rates are higher in males compared to females for all geographies, with admission rates in males approximately treble that of females.
Table 2: Admission episodes for alcohol-related conditions (Narrow) (Persons & Sex), Directly standardised rate per 100,000 population (2023/24)
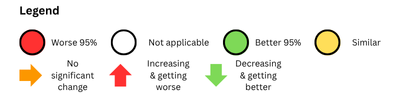
Age-specific analysis shows that alcohol-related admission rates generally increase with age. Admission rates are consistently low among individuals under 40 across all areas (see Table 3). In Bury, rates for the 40–64 and 65+ age groups are lower than the national average. Trends in Bury have remained stable across all age categories. Regionally and nationally, admission rates for those under 40 are improving, while rates for the 65+ age group are rising nationally, indicating a worsening trend.
Table 3: Admission episodes for alcohol-related conditions (Narrow) (by age band), Directly standardised rate per 100,000 population (2023/24)
Examining trends in admission episodes for alcohol-related conditions (Narrow) in Bury, the rate increased from 421 per 100,000 in 2016/17 to a peak of 462 per 100,000 in 2019/20. However, in 2020/21, the rate decreased sharply to 376 per 100,000 before rising with slight fluctuations to 409 per 100,000 in 2023/24. In England, the rate increased slightly with some fluctuations from 492 per 100,000 in 2016/17 to a peak of 518 per 100,000 in 2019/20. This was followed by a sharp decline to 456 per 100,000 in 2020/21, before rising steadily to 504 per 100,000 in 2023/24 (Figure 1). At a national level, alcohol-related hospital admissions are linked to deprivation, with higher rates in more relatively deprived areas.
Figure 1: Admission episodes for alcohol-related conditions (Narrow) (Persons), Directly standardised rate per 100,000 population in Bury and England from 2016/17 to 2023/24

Bury ranks 11th in its group of 16 similar local authorities for admission episodes for alcohol-related conditions (Narrow) (Persons), with the highest rate in Stockton-on-Tees (705) and lowest in Sutton (310).
Admission episodes for alcohol-related conditions (Broad)
This indicator is measure of hospital admissions where either the primary diagnosis (main reason for admission) or one of the secondary (contributory) diagnoses is an alcohol-related condition. This represents a Broad measure of alcohol-related admissions but is sensitive to changes in coding practice over time. It is presented as Directly age standardised rate per 100,000 population (standardised to the European standard population).
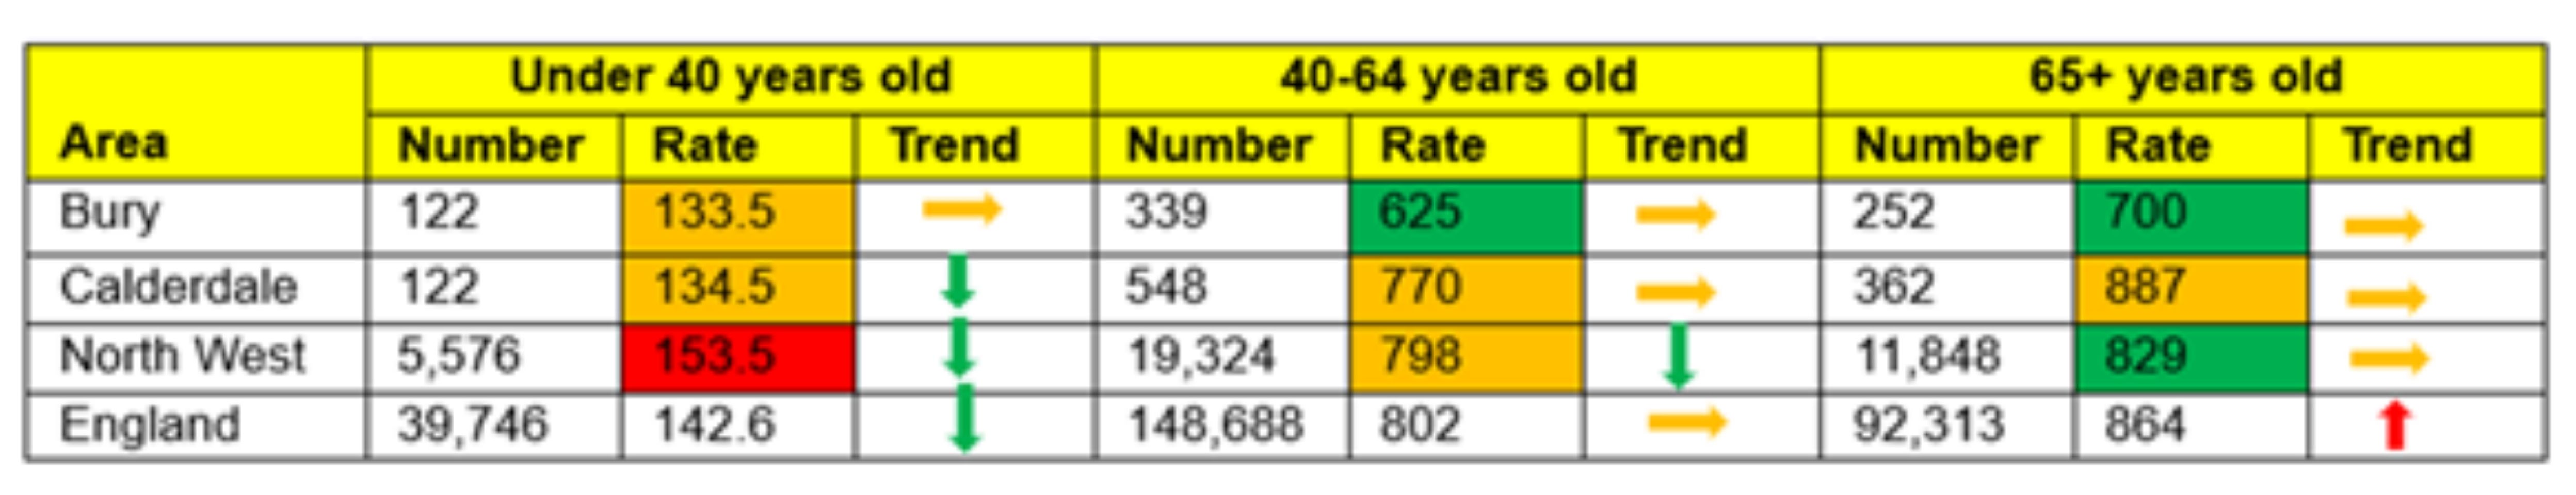
For the year 2023/24, there were 3,428 admission episodes for alcohol-related conditions (Broad) in Bury, with a directly age-standardised rate (persons) of 1,815 per 100,000 population. Among males, the rate was 2,880 and among females, 882. All rates were statistically similar to the England averages. Nationally, England reported 1,018,986 admission episodes for alcohol-related conditions (Broad), with an overall rate of 1,824. The male rate was 2,837 and the female rate was 935. Based on the 5 most recent data points, the trend in Bury showed no significant change for persons or by sex. England also showed a similar trend across all groups. Rates in Calderdale were similar to England average, whereas admission rates in North West for all persons, males and females are higher and worse (statistically significant) that England average. Overall rates are higher in males compared to females for all geographies, with admission rates in males approximately treble that of females (See table 4 below)
Table 4: Admission episodes for alcohol-related conditions (Broad) (Persons & Sex), Directly standardised rate per 100,000 population (2023/24)
No data are available for age specific analysis for admission episodes for alcohol-specific conditions (Broad).
Examining trends in admission episodes for alcohol-related conditions (Broad) in Bury, the rate increased from 1,698 per 100,000 in 2016/17 to a peak of 1,827 per 100,000 in 2018/19. This was followed a slight decline to 1,783 per 100,000 in 2019/20 before decreasing sharply to 1,420 per 100,000 in 2020.21. This was followed by a steady increase to 1,587 in 2021/22, 1,653 in 2022/23 and 1,815 in 2023/24. In England, the rate increased from 1,625 per 100,000 in 2016/17 to a peak of 1,818 per 100,000 in 2019/20. This was followed by a sharp decline to 1,504 per 100,000 in 2020/21, before rising steadily with slight fluctuations to 1,824 per 100,000 in 2023/24 (Figure 2). Nationally, alcohol-related hospital admissions are higher in more relatively deprived areas.
Figure 2: Admission episodes for alcohol-related conditions (Broad) (Persons), Directly standardised rate per 100,000 population in Bury and England from 2016/17 to 2023/24

Bury ranks 9th in its group of 16 similar local authorities for admission episodes for alcohol-related conditions (Broad) (Persons), with the highest rate in Stockton-on-Tees (2,440) and lowest in Sutton (1,329).
Admission episodes for alcohol-related conditions by condition
Bury shows a mixed picture for admission episodes for alcohol-related conditions, with statistically worse admission rates for alcohol-related cardiovascular disease and statistically better admission rates for mental and behavioural disorders compared to England. Trend data for Bury, the North West, and England highlights several key patterns in alcohol-related hospital admissions. Rates of admissions for alcohol-related mental and behavioural disorders and intentional self-poisoning are showing a decreasing and improving trend across all three geographies. However, admissions specifically for alcohol-related cardiovascular diseases across all four geographies are increasing and getting worse, whereas for unintentional injuries are showing no significant change. In Bury, there has been no significant change in the trend of admission episodes for alcoholic liver disease, whereas both national and regional data indicate an increasing and worsening trend. Notably, across England, rates for all these conditions are highest in areas experiencing greater relative deprivation.
·Admission episodes for unintentional injuries injuries (Persons) (narrow definition)
Admission episodes for unintentional injuries (narrow definition) in Bury for the year 2023/24 were recorded at a rate of 70.1 per 100,000 population. This figure is statistically similar to the England average of 61.6, slightly higher than Calderdale’s rate of 64.6, and similar to the North West regional rate of 69.6. The current trend (based on 5 most recent data points) in Bury and all other geographies indicates no significant change.
Table 5: Admission episodes for unintentional injuries (Persons) (narrow definition) (2023/24)

·Admission episodes for mental and behavioural disorders (Persons) (narrow definition)
Admission episodes for mental and behavioural disorders (narrow definition) due to alcohol use in Bury in 2023/24 had a rate of 44 per 100,000 population, considerably lower and statistically better compared to England’s average of 80.1. Calderdale had a rate of 42, which is also significantly better than England, while the North West region exhibited a higher rate of 84.6, worse than the national average. The current trend, based on the five most recent data points, indicates a decreasing and improving pattern in Bury as well as across all other geographies.
Table 6: Admission episodes for mental and behavioural disorders (Persons) (narrow definition) (2023/24)

·Admission episodes for intentional self-poisoning related to alcohol (Persons) (narrow definition)
Admission episodes for intentional self-poisoning related to alcohol (narrow definition) in Bury stood at 22.5 per 100,000 population for 2023/24, statistically similar to England average rate of 22.7. Calderdale has a rate of 20.3, while the North West has a higher rate at 25.3, statistically worse than England. The trend for intentional self-poisoning in Bury is decreasing and improving.
Table 7: Admission episodes for intentional self-poisoning related to alcohol (Persons) (narrow definition) (2023/24)

·Admission episodes for alcohol-related cardiovascular disease admissions (Persons) (broad definition)
For alcohol-related cardiovascular disease admissions (broad definition), Bury reported a rate of 897 per 100,000 population in 2023/24, statistically worse than the England average of 837. Calderdale had a slightly lower rate of 846 (statistically similar to England average), while the North West had a notably higher rate of 912, which is statistically worse than England average. Trend data based on the five most recent data points suggests the admission rates are increasing and getting worse.
Table 8: Admission episodes for alcohol-related cardiovascular disease admissions (Persons) (broad definition) (2023/24)

·Admission episodes for alcoholic liver disease (Persons) (broad definition)
Admissions for alcoholic liver disease (broad definition) in Bury during 2023/24 had a rate of 161 per 100,000 population, statistically similar to the England average of 163.4. Calderdale (192.4) and the North West region (197.4) had higher rates, significantly worse than the national average. However, the trend in Bury for alcoholic liver disease admissions shows no significant change for Bury and Calderdale, whereas the trend in North west and England is increasing and getting worse.
Table 9: Admission episodes for alcoholic liver disease (Persons) (broad definition) (2023/24)

Alcohol related mortality
This indicator refers to deaths from alcohol-related conditions, all ages, and is a directly age-standardised rate per 100,000 population. Deaths from alcohol-related conditions are based on underlying cause of death, registered in the calendar year for all ages. Each alcohol related death is assigned an alcohol attributable fraction based on underlying cause of death (and all cause of deaths fields for the conditions: ethanol poisoning, methanol poisoning, toxic effect of alcohol).
In 2023, Bury recorded 78 alcohol-related deaths, with a directly age-standardised rate (persons) of 41.7 per 100,000 population. Among males, the rate was 67.6, and among females, 19.4. All rates were statistically similar to the England averages. Nationally, England reported 22,644 alcohol-related deaths, with an overall rate of 40.7. The male rate was 62.1 and the female rate was 22.1. While Bury’s rates were broadly in line with the national average, its trend remained stable, whereas England showed increasing trends across all groups. Bury and Calderdale have similar alcohol-related mortality rates compared to England (with the exception of females in Calderdale, where rates are significantly worse than England average) (Table 10). Rates by person and sex in the North West are higher than England average (Local Alcohol Profiles for England, 2023).
Table 10: Deaths from alcohol-related conditions (Persons & Sex) , all ages, directly age-standardised rate per 100,000 population, 2023

Examining trends in alcohol-related mortality rates (persons) in Bury, the rate decreased from 43.9 per 100,000 in 2016 to 36.6 in 2018. However, from 2019 onward, the rates increased steadily from 42.8 in 2019 to a peak of 50.7 in 2022, before a decline in 2023 to 41.7. Trend data based on 5 most recent data points in Bury suggests no significant change. In England, the trend was more stable. The rate was 36.3 in 2016, slightly increased to 36.6 in 2017, then dipped to 35.3 in 2018. From 2019, the rates gradually rose from 36.5 to 40.7 in 2023. Trend data based on 5 most recent data points in England suggests that the rates are increasing and getting worse (Figure 3). Nationally, increasing alcohol-related mortality rates are linked to increasing levels of relative deprivation.
Figure 3: Deaths from alcohol-related conditions (persons), all ages, directly age-standardised rate per 100,000 population in Bury and England from 2016-2023

Bury ranks 10th in its group of 16 similar local authorities for Alcohol-related mortality rates (persons), with the highest rate in Tameside (53) and lowest in Sutton (27.6).
Potential Years of Life Lost (PYLL) due to alcohol-related conditions
There is a significant difference in the potential years of life lost (PYLL) between males and females in Bury, consistent with the trend seen across both England and the North West region. PYLL is a measure of the potential number of years lost when a person dies prematurely. The basic concept of PYLL is that deaths at younger ages are weighted more heavily than those at older ages (Public Health Profiles). Figure 4 below shows that since 2016, around twice as many lost potential years of life lost due to alcohol-related conditions in males than females in Bury.
From 2016 to 2023, the potential years of life lost (PYLL) due to alcohol-related conditions among males in Bury showed notable fluctuations. The rate began at 1,447 in 2016, gradually declined to 1,107 in 2018, then rose again to a peak of 1,761 in 2022 before falling to 1,347 in 2023. Among females, the PYLL rates were consistently lower than those of males. The rate started at 567 in 2016, dropped to a low of 406 in 2018, then rose sharply to a peak of 780 in 2021. It has since declined, reaching 449 in 2023, the lowest point in the period. Overall, males in Bury experienced a greater burden of alcohol-related premature mortality than females throughout the entire period. This aligns with national patterns, where men typically face higher alcohol-related harm.
Figure 4: Potential years of life lost due to alcohol-related conditions, Bury 2016-2020, Males and Females. Directly standardised rate per 100,000

Admission episodes for alcohol-specific conditions
This indicator presents admissions to hospital where the primary diagnosis or any of the secondary diagnoses are an alcohol-specific (wholly attributable) condition. It is presented as directly age standardised rate per 100,000 population (standardised to the European standard population).
For the year 2023/24, there were 1,129 admission episodes for alcohol-specific conditions in Bury, with a directly age-standardised rate (persons) of 601 per 100,000 population. Among males, the rate was 803 and among females, 412. The rates for person and female were statistically similar to the England averages, whereas for males were statistically better than England average. Nationally, England reported 339,916 admission episodes for alcohol-specific conditions, with an overall rate of 612. The male rate was 868 and the female rate was 373. Based on the 5 most recent data points, the trend in Bury showed no significant change for persons or by sex. England also showed a similar trend across all groups. Rates in Calderdale are similar to the national average for England. In comparison, rates in the Northwest, both overall and by sex, are worse than the England average. For males in the Northwest, the trend has remained stable over the five most recent data points. However, rates for females are improving and show a clear downward trend.
Overall rates are higher in males compared to females for all geographies, with admission rates in males approximately twice that of females (See table 11 below)
Table 11: Admission episodes for alcohol-specific conditions (Persons & Sex), Directly standardised rate per 100,000 population (2023/24)

No data are available for age specific analysis for admission episodes for alcohol-specific conditions.
Examining trends in alcohol-specific admission episode rates (persons) in Bury, the rate in Bury remained fairly stable with slight fluctuations from 615 in 2016/17 to 601 in 2023/24. Similar pattern was seen in England with the rate slightly increasing with some fluctuations from 558 in 2016/17 to 612 in 2023/24. Nationally, increasing admission episodes for alcohol-specific conditions are linked to increasing levels of relative deprivation.
Figure 5: Admission episodes for alcohol-specific conditions (Persons), Directly standardised rate per 100,000 population in Bury and England from 2016/17 to 2023/24

Bury ranks 7th in its group of 16 similar local authorities for admission episodes for alcohol-specific conditions (Broad) (Persons), with the highest rate in Tameside (988) and lowest in Sutton (349).
Specialist alcohol services treatment in Bury
In 2023/24, specialist alcohol services in Bury provided treatment to 397 individuals. Around 2% of clients experienced a waiting period exceeding six weeks for alcohol treatment, in comparison to the national average of 1%. Additionally, 61% of clients (151) in Bury successfully completed their alcohol treatment during this period, compared with national completion rate of 58% (33,278). Due to small numbers, deaths in alcohol treatment cannot be reported for Bury. The mortality ratio (for deaths in alcohol treatment) in Bury (18.6) was similar to the England average (14.1) (Table 12).
Table 12: Specialist alcohol services treatment in Bury (NDTMS)

Examining trends in the number of adults in alcohol treatment in Bury, the numbers in treatment declined from 301 in the year 2010 (with fluctuations) to 267 in 2022, Over the last two data point, the numbers have risen to 320 in the year 2023 and 393 in the year 2024 (Figure 6).
Figure 6: Number of Adults in alcohol treatment in Bury from 2010-2024 (NDTMS)

The Treatment Progress Measure provides a detailed view of treatment progress by combining data from treatment reviews and exits. It focuses individual's latest treatment journey, often involving multiple overlapping episodes at different services. This measure applies only to adults in community treatment services, including residential and inpatient settings, and excludes data from secure settings. Service users will be classified as showing substantial progress if they successfully completed treatment in the latest reporting period, are still in treatment and not using their problem substances or are still in treatment and have substantially reduced their use of problem substances. In 2023/24, 53% of clients showed treatment progress in Bury compared with 47% in England. Compared with baseline of March 2022, there was a 4% percentage point decrease in clients showing treatment progress in Bury compared with 1% in England (Figure 7).
Figure 7: Treatment Progress (%) ‘Alcohol only’ in Bury, 2023/24 (NDTMS)

New alcohol treatment presentations
There were 252 new presentations for alcohol treatment in Bury for the year 2023/24 (Table 13).
Table 13: Demographic breakdown of new alcohol treatment presentations in Bury and England (NDTMS)

Examining demographics characteristics of the new presentations there were more males than females in treatment. In Bury, almost two-thirds (65%) of adults in treatment were male compared to 61% in England. Significant portion of new presentations for alcohol treatment in Bury and England were over 30 years old (92%). Bury had a higher proportion of White (94%) clients compared to England (88%) and slightly lower proportion across all other ethnic groups compared to England. The majority of new presentations to alcohol treatment are from heterosexual individuals (89% in both Bury and England). In both Bury (62%) and England (57%), the majority of new presentations to alcohol treatment reported having no religion. A higher proportion of clients in Bury reported being 'Christian' or having 'No religion' compared to those in England.
Wider determinants
Data by employment status of new presentations for alcohol treatment (Figure 8) suggests that in the year 2023/24, 41% of adults who started alcohol treatment in Bury and 38% in England were long term sick/disabled. Bury had lower proportions (31%) of regularly employed adults starting treatment compared to England (35%) and a slightly higher proportion (27%) of unemployed/economically inactive compared to England (25%).
Figure 8: Proportion (%) of adults in alcohol treatment at the start of treatment by employment status in Bury and England, 2023/24 (NDTMS)

Figure 9 below presents the housing status of adults at the start of alcohol treatment in Bury compared to the national average in England during 2021/22. The majority of adults reported no housing problem at the start of treatment in Bury (90%) and England (91%). Bury had slightly higher proportion of adults reporting urgent housing problem (4%) compared to England (2%), but this can be due to small numbers.
Figure 9: Proportion (%) of adults in alcohol treatment at the start of treatment by accommodation status in Bury and England, 2021/22 (NDTMS)

In 2023/24, 21% of adults presenting to alcohol treatment were parents living with children in Bury, similar to England (21%). A similar proportion (10%) of adults in treatment were parents not living with children in Bury and England. In Bury, there was a higher proportion (91%) of client’s children not receiving early help compared to 72% nationally (Table 14).
Table 14: Adults who are parents or carers and their children, new presentations for alcohol treatment in Bury and England (2021/22) (NDTMS)

In 2023/24, 2.9% of households in Bury were assessed as owed a duty have alcohol dependency support needs, which was lower than Calderdale (6.4%), the North West (5.4%), and England (4.6%) (Table 15)
Table 15: Statutory homelessness duties owed due to alcohol dependency, 2023/24 (NDTMS)

Co-occurring mental health conditions
Around 8 in 10 adults (80%) in Bury who entered alcohol treatment in 2021/22 were identified as having a mental health treatment need, higher than the national average of 70% (Table 16).
Table 16: Adults entering alcohol-only treatment with identified mental health needs, and proportion receiving mental health treatment, Bury and England (2021/22) (NDTMS)

Of those identified as having a need in Bury, 86% were already receiving treatment, mainly through their GP (81%). Nationally, 83% were receiving treatment, with the majority also seeing their GP (67%) (Figure 10).
Figure 10: Proportion (%) of adults in alcohol only treatment identified as having a mental health treatment need and receiving treatment for their mental health, for Bury and England, 2021-22 (NDTMS)


Access - routes into treatment
Figure 11 presents the sources of referral for adults newly presenting to alcohol treatment services in Bury during 2023/24. Over half (54%) of referrals were self-referrals in Bury, which is slightly lower than the national average of 59%. Referrals from health services and social care accounted for 20%, also below the national figure of 26%. Notably, 9% of referrals in Bury came through the Criminal Justice System (CJS), compared to 7% nationally. Differences by sex were also observed: a higher proportion of males (11%) were referred via the CJS compared to females (4%), while a greater proportion of females (60%) self-referred compared to males (51%).
Figure 11: New presentations by referral source for Bury and England, 2023/24 (NDTMS)

High level interventions
Almost all adults in treatment in 2023/24 were seen within the community in Bury. Of the interventions received in the inpatient unit, 10% were Psychosocial, 51% were Pharmacological and 10% of all interventions received were received in the inpatient unit. Treatment received in primary care and residential were too small to report (Table 17).
Table 17: Adults in treatment in high level interventions and settings in Bury and England , 2023/24 (NDTMS)

*The proportion of interventions received within the selected treatment setting i.e. of the interventions received within the setting of community what proportion of those were Psychosocial, Pharmacological or the total of all interventions received irrespective of whether they were Psychosocial or Pharmacological.
Thus, for example, of those interventions received in Bury for 2023/24 with the Community treatment setting 98% were Psychosocial, 63% were Pharmacological and 98% of all interventions received were received in the Community setting.
Most recent data for 2021/22 suggests that Bury had higher proportions of adults with a pharmacological intervention for withdrawal and relapse intervention compared to England. The high proportions are possibly due to small numbers (Table 18).
Table 18: Adults with a pharmacological intervention type, 2021/22 (NDTMS)

Treatment progress
The Treatment Progress Measure provides a detailed view of treatment progress by combining data from treatment reviews and exits. It focuses on each individual's latest treatment journey, often involving multiple overlapping episodes at different services. This measure applies only to adults in community treatment services, including residential and inpatient settings, and excludes data from secure settings. Service users will be classified as showing substantial progress if they successfully completed treatment in the latest reporting period, are still in treatment and not using their problem substances or are still in treatment and have substantially reduced their use of problem substances. The measure presented above relates to ‘alcohol only’.
In 2023/24, 45% of clients showed treatment progress in Bury compared with 41% in England. Compared with baseline of March 2022, there was a 1% percentage increase in clients showing treatment progress in Bury compared with 1% decrease in England (Figure 12).
Figure 12: Treatment Progress (%) ‘alcohol only’ in Bury and England, 2023/24 (NDTMS)

Length of time in treatment
The length of a typical treatment period was just over 6 months (191 days in Bury and 194 days in England) for the year 2021/22. Retaining adults for their full course of treatment is important in order to increase the chances of recovery and reduce rates of early treatment drop out. Conversely, having a high proportion of adults in treatment for more than a year may indicate that they are not moving effectively through and out of the treatment system. Almost 3% of Bury adults had been in treatment for longer than a year, compared to 12% in England (Figure 13).
Figure 13: Length of time in treatment for adults in alcohol only treatment for exits in Bury and England, 2023/24 (NDTMS)

Successful completions & deaths in treatment
65% of adults who left treatment in 2021/22 were successful (dependent free) in Bury, compared to 59% nationally. Approximately half (47%) of adults who successfully completed treatment in Bury did not re-present to treatment within 6 months, similar to the national average.
Table 19: Adults successfully completing alcohol treatment, 2021/22 (NDTMS)

There has been a notable increase in non-representation within 6 months in Bury over the last three data points (Figure 14).
Figure 14: Proportion of all in treatment who completed successfully and did not return within 6 months for Bury and England, 2019/20 to 2021/22 (NDTMS)

In 2023/24, Deaths in treatment in Bury are slightly higher (1.8%) compared to England (1.2%).
Abstinence and day drinking
In 2021/22, over half of adults (56%) became abstinent in Bury, higher than the proportion for England (50%). The average number of days that clients were drinking alcohol at the start of their treatment (within the previous 28 days) and within the 4 weeks before their planned exit notably decreased in Bury, where there was an average of 10.6 days reduction (Table 20).
Table 20: Adults who became abstinent at planned exit and average days drinking, 2021/22 (NDTMS)

*Abstinence rates at planned exit: The number of clients who reported drinking alcohol at treatment start and then reported no drinking in the 28 days before planned exit.
**Days of drinking: The number of clients and their average days of drinking alcohol at treatment start and in the 28 days before planned exit.