Migrant Indicator
Migrant Indicator
Migrant Indicator
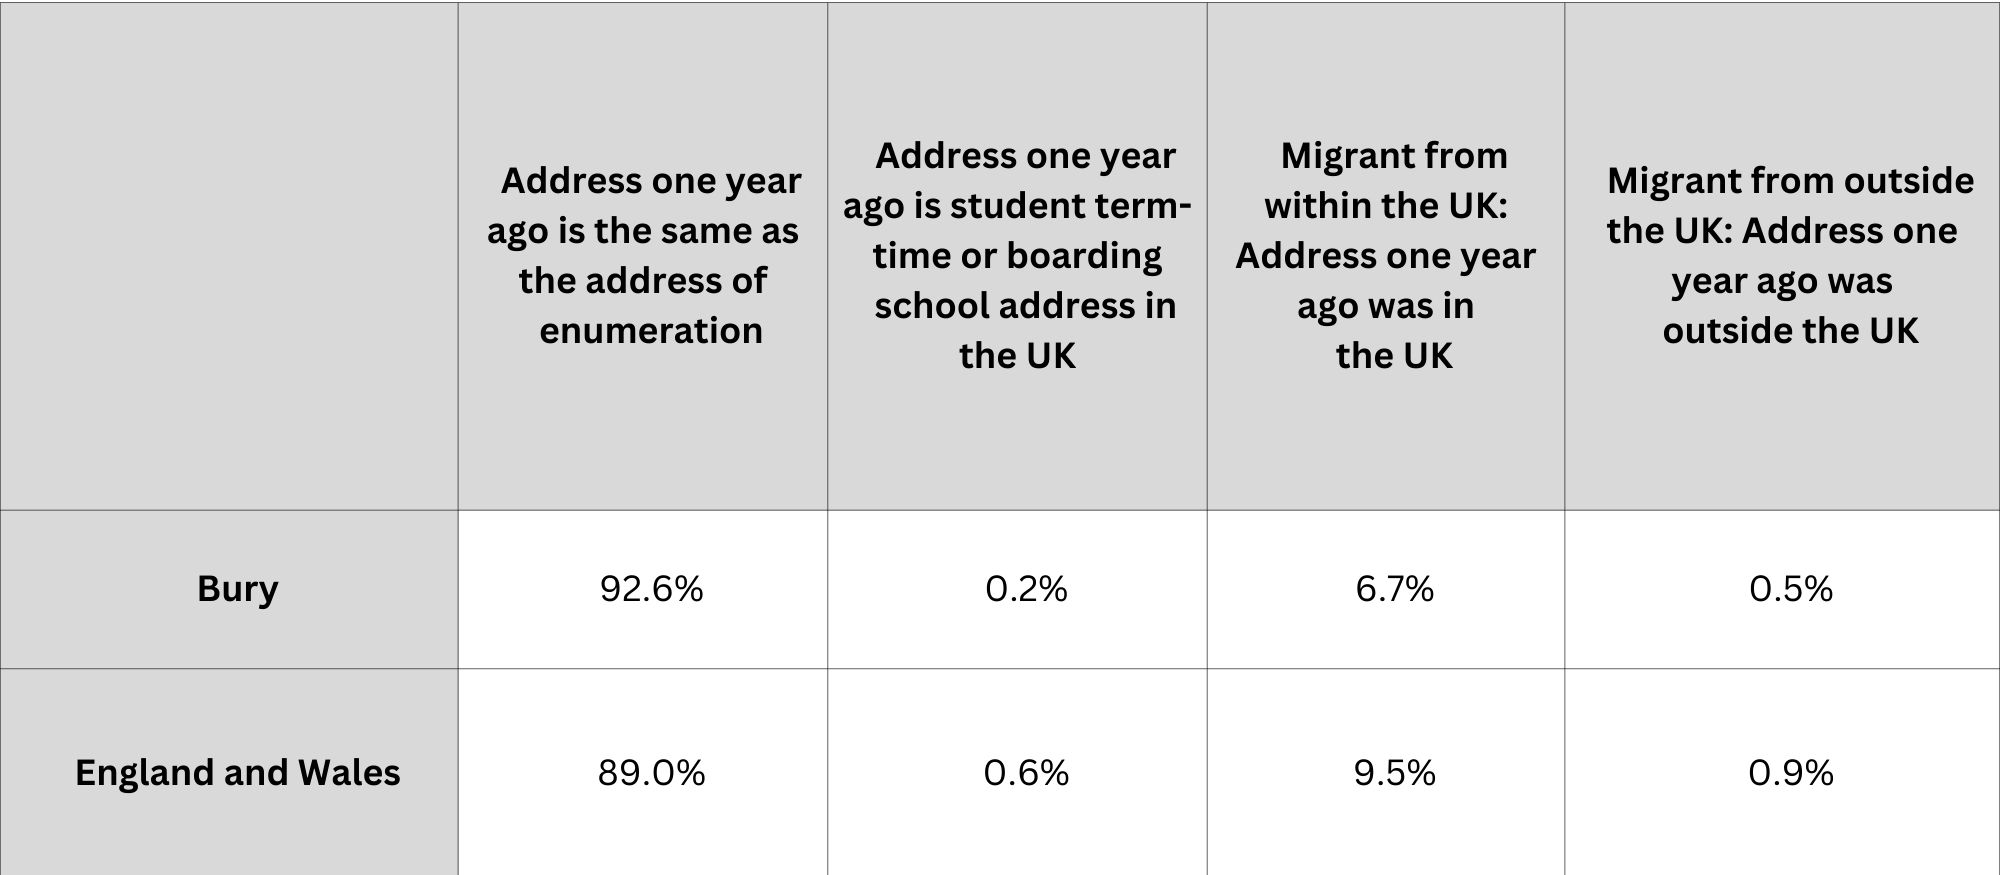
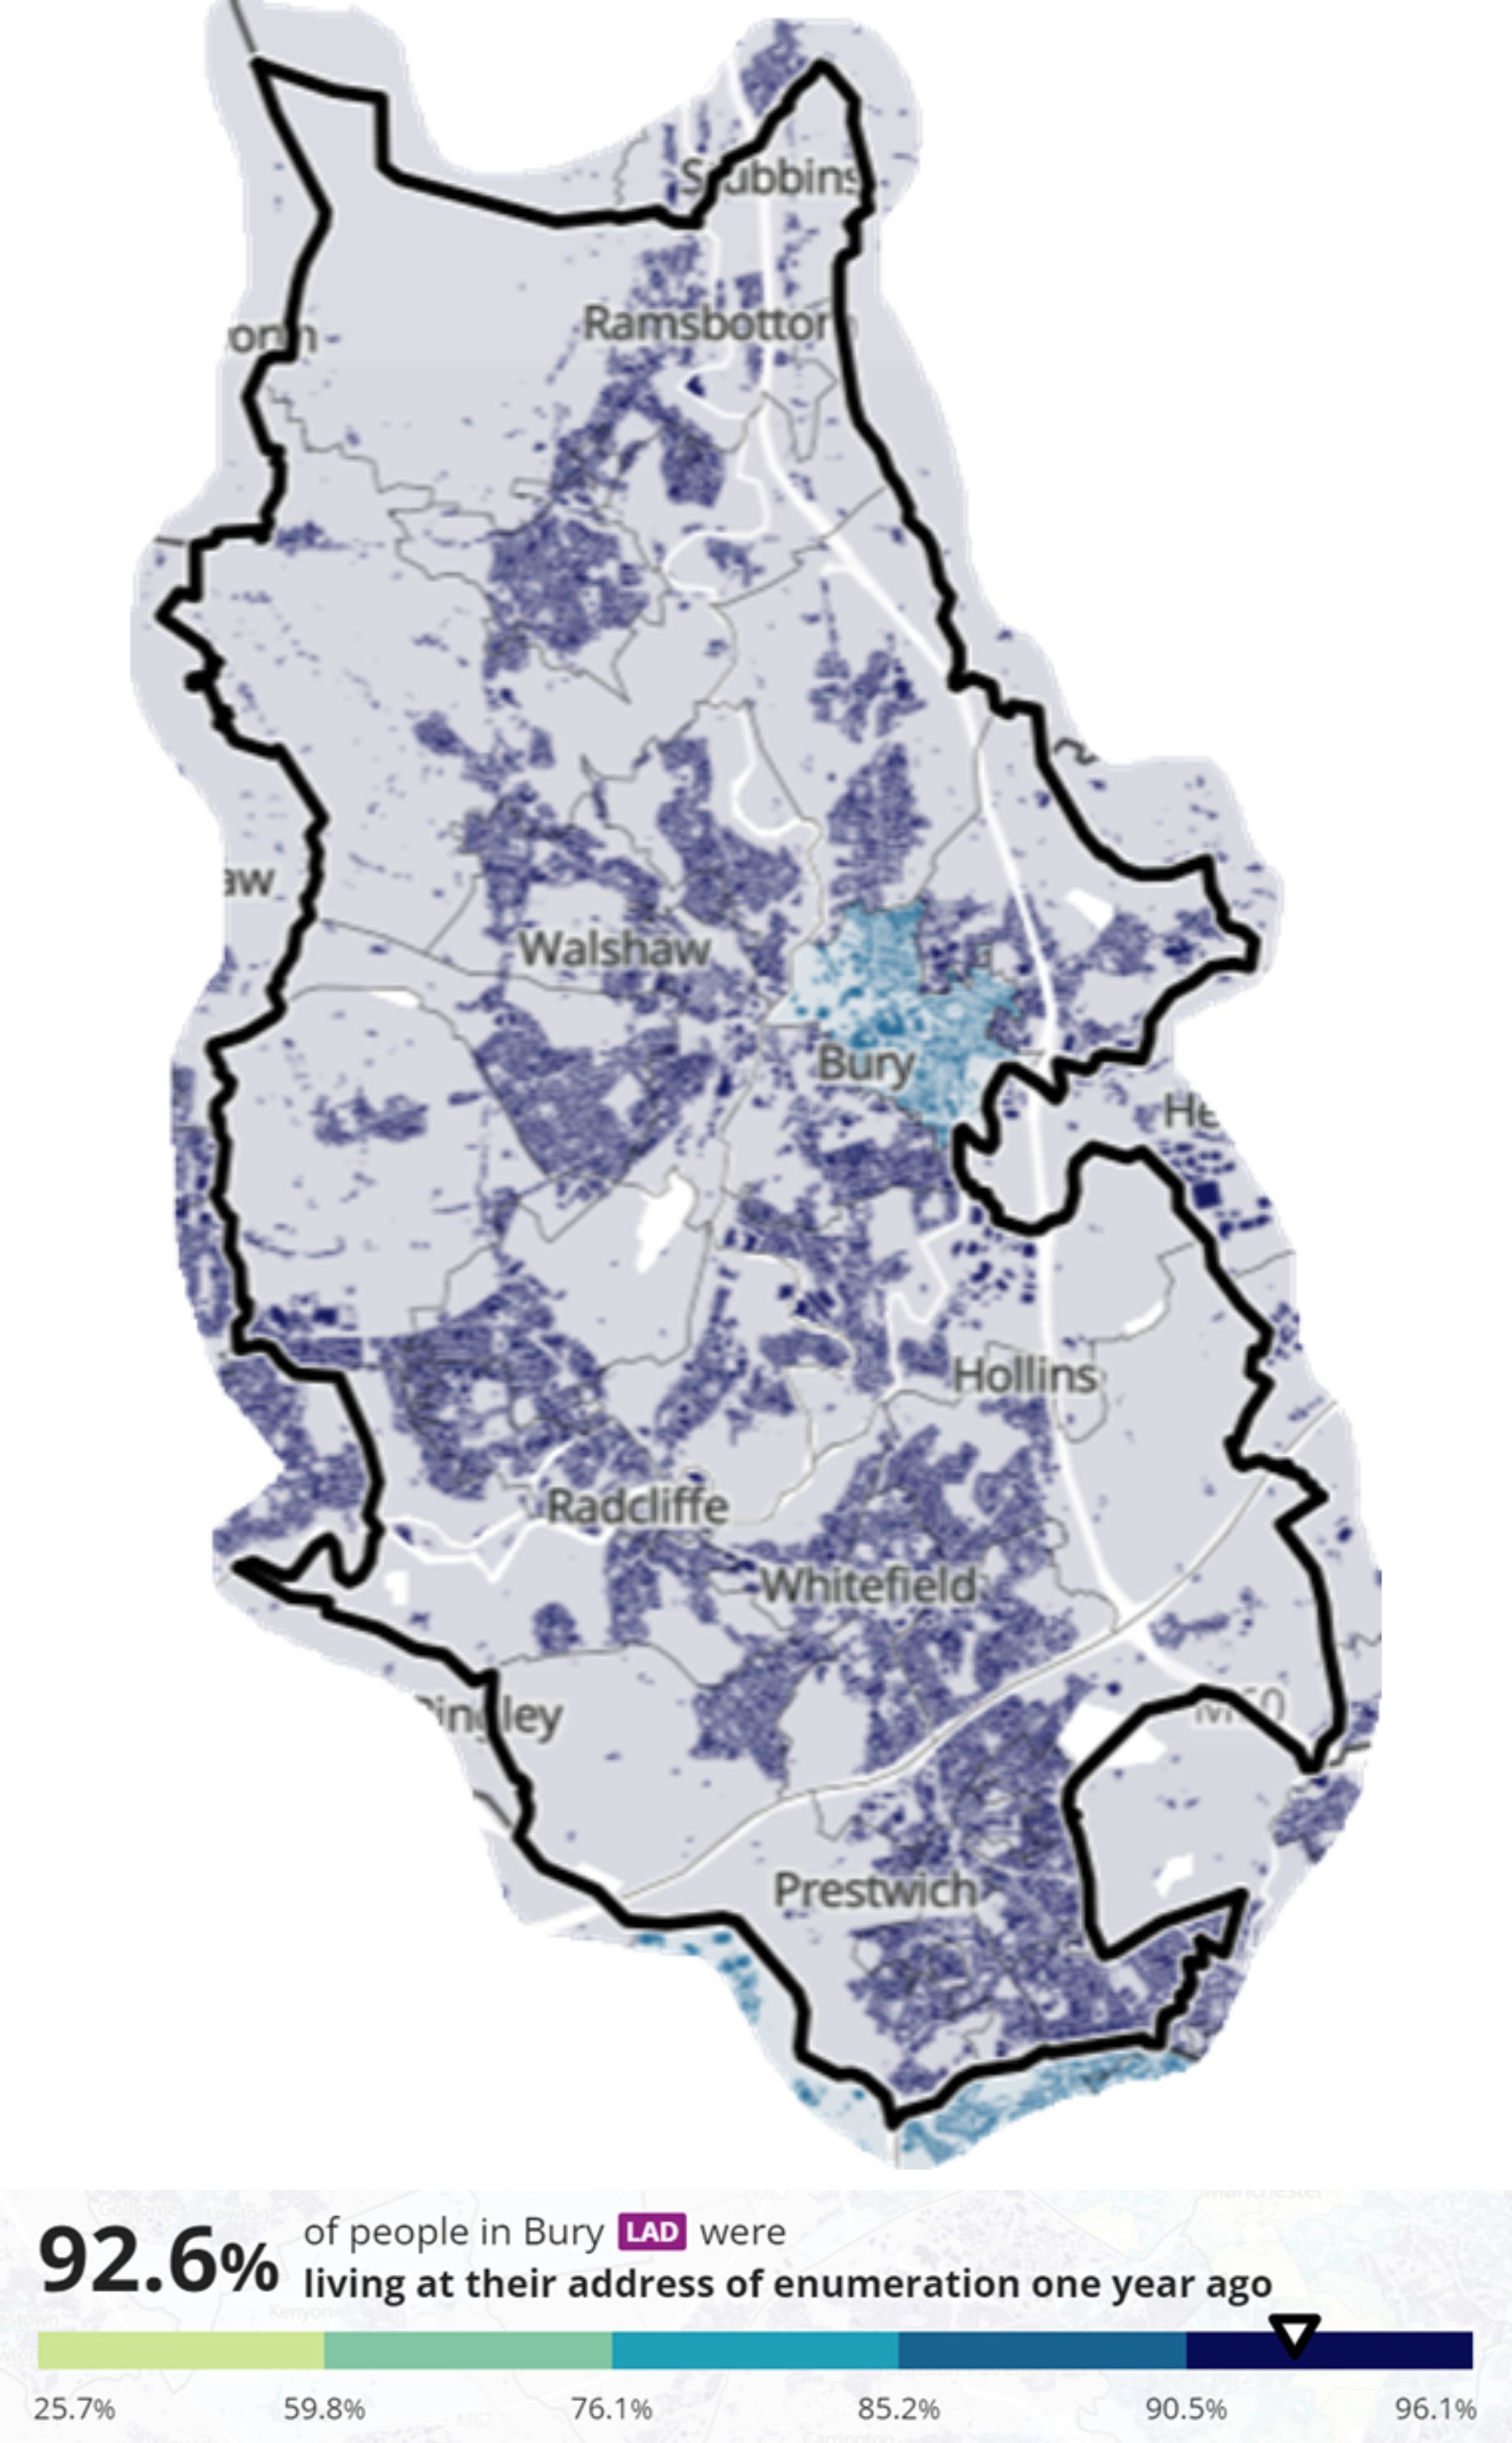
The census asked respondents whether their address when filling out the census form was the same as their address one year previously (that is, on 21 March 2020). In 2021, 0.9% of the population said their address one year before the census was outside the UK. This is a decrease compared with 2011, when 1.1% had an address outside the UK one year before the census. A decline in the number of arrivals in the previous year had been expected, as a result of the coronavirus (COVID-19) pandemic. UK travel restrictions were enforced from March 2020 onwards and restrictions were also put in place in other countries across the world. As a result, migration to and from the UK in the year before the census was highly restricted. Bury recorded a much lower figure of 0.5% migration compared to 0.9% for England and Wales.
The table below shows migrant indicator by MSOA in Bury.
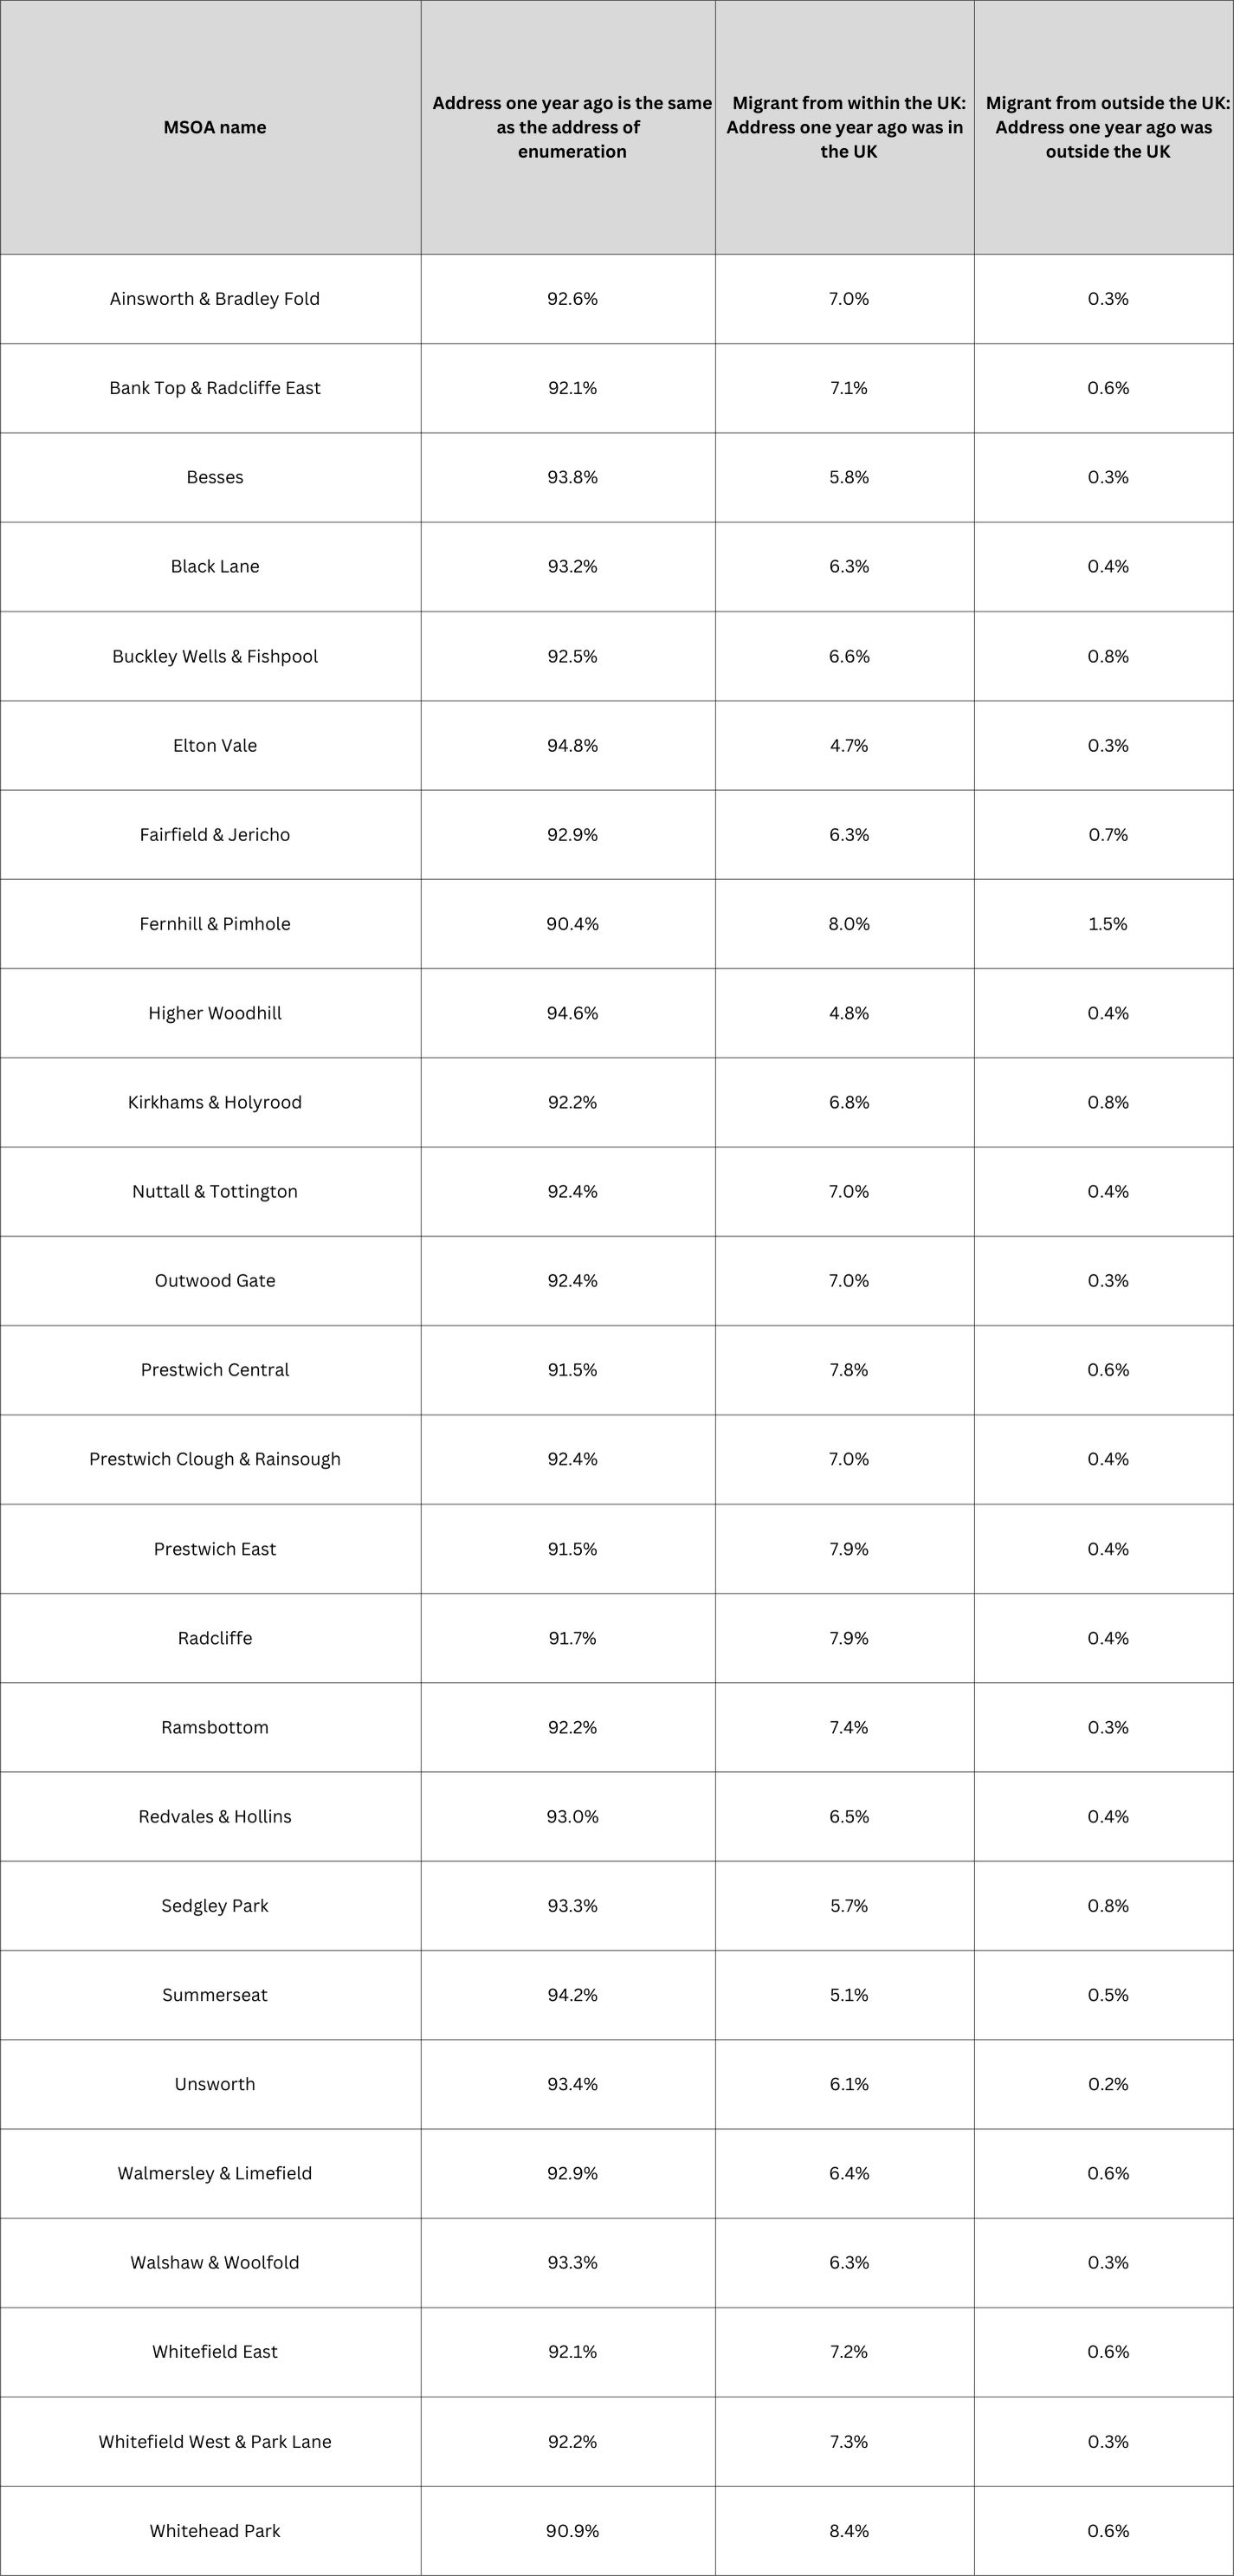
Elton Vale had the highest percentage of people living in the same address on Census Day as they did a year ago, at 94.8%. Fernhill & Pimhole was the lowest at 90.4%.
The table below shows migrant indicator by ward.
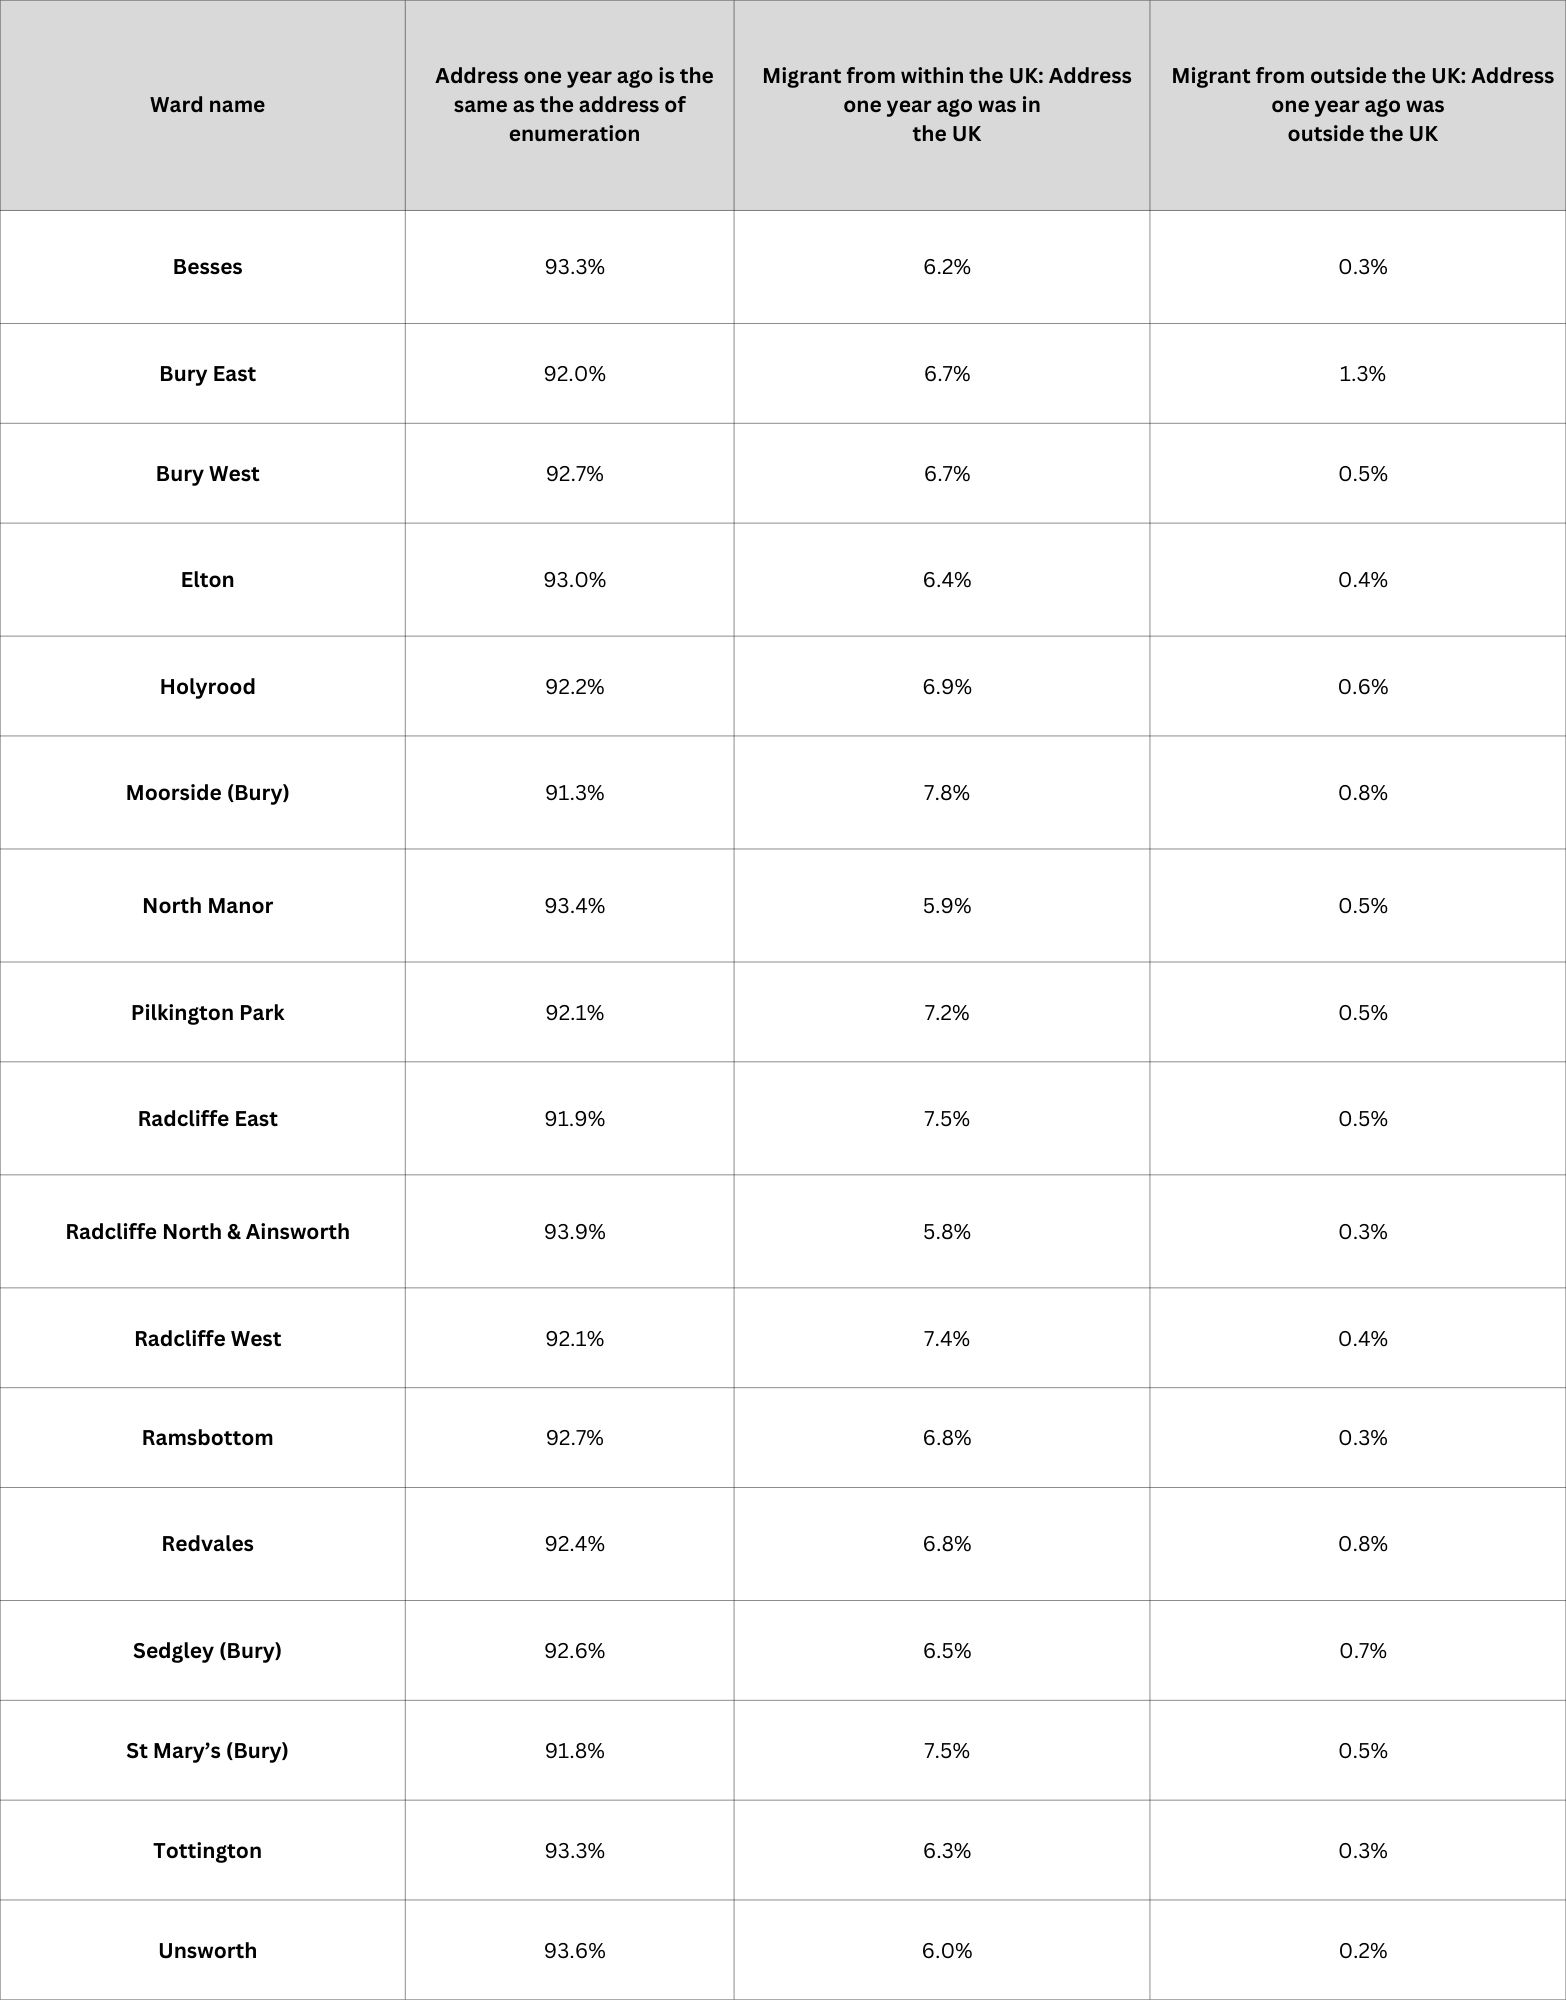
Radcliffe North & Ainsworth had the highest percentage of people living in the same address on Census Day as they did a year ago, at 93.9%. Moorside was the lowest at 91.3%.