School-aged Children
School-aged Children
School-aged Children
School-aged children represent approximately 18% of population in Bury. Measuring and reporting on health and well-being of this group is crucial to improve their health outcomes by identifying potential issues, examining trends and developing targeted evidence-based intervention. Office for Health Improvement and Disparities (OHID) presents detailed indicators on school-aged children health and well-being in the Child and Maternal Health profiles. The benefit of examining these indicators lies in early detection of health problems, allowing for timely interventions. By identifying areas where interventions can have the greatest impact, such as high rates of obesity in Reception and Year 6 children, low vaccination rates, effective evidence-based strategies can be developed and implemented. Additionally, examining changes in these indicators helps evaluate the effectiveness of existing policies and interventions, further enabling evidence-based decision-making and modification of interventions if needed. Furthermore, examining public health indicators in school-aged children contributes to addressing health inequalities and disparities, promoting health equity for all.
Child Poverty
The Marmot Review (2010) suggests there is evidence that childhood poverty leads to premature mortality and poor health outcomes for adults. Reducing the numbers of children who experience poverty should improve these adult health outcomes and increase healthy life expectancy. There is also a wide variety of evidence to show that children who live in poverty are exposed to a range of risks that can have a serious impact on their mental health. The Department for Work and Pensions has a statutory obligation to publish a measure of relative and absolute low income, and low income and material deprivation for children under section 4 of the Welfare Reform and Work Act 2016.
Children in absolute low income families (under 16s)
The children in absolute low income families measure is useful for tracking changes over time in relation to a fixed reference point and is designed to assess how low incomes are faring with reference to inflation. This indicator measures the percentage of children (under 16 years) in a local area, living in absolute low income families. A family is defined as a single adult, or a married or cohabitating couple, or a Civil Partnership, and any dependent children.
Equivalised income is income Before Housing Costs (BHC) and includes contributions from earnings, state support and pensions. Equivalisation adjusts incomes for family size and composition, taking an adult couple with no children as the reference point. Absolute low income is defined as a family in low income Before Housing Costs (BHC) in the reference year in comparison with incomes in 2010 to 2011. A family must have claimed one or more of Universal Credit, Tax Credits or Housing Benefit at any point in the year to be classed as low income in these statistics. Absolute low income takes the 60 per cent of median income threshold from 2010 to 2011 and then fixes this in real terms (i.e. the line moves with inflation). This is designed to assess how low incomes are faring with reference to inflation. It measures the number and proportion of individuals who have incomes below this threshold. The percentage of individuals in absolute low income will decrease if individuals with lower incomes see their incomes rise by more than inflation.
Based on the most recent data from 2020/21, 16.1% of children under 16 years of age are in absolute low income families, higher (statistically significant) to England average of 15.3%. No trend data are available for Bury and England. Bury has the 3rd highest percentage of children living in absolute low income families with the lowest percentage in Stockport of 10.7% and highest in Stockton-on-Tees at 19%. There are no data on inequalities at Bury level.
Children in relative low income families (under 16s)
The children in relative low income families measure is useful for comparing the situation in local areas and measuring the number and proportion of individuals who are currently in low income compared to the current median income. Relative low income is defined as a family in low income Before Housing Costs (BHC) in the reference year. A family must have claimed one or more of Universal Credit, Tax Credits or Housing Benefit at any point in the year to be classed as low income in these statistics.
Relative low income sets a threshold as 60 percent of the UK average (median) income and moves each year as average income changes. It is used to measure the number and proportion of individuals who have income below this threshold. The percentage of individuals in relative low income will decrease if:
Average (median) income stays the same or rises, and individuals with lower incomes see their incomes rise more than the average, or
Average (median) incomes fall, and individuals with lower incomes see their incomes fall less than average incomes.
Based on the most recent data from 2020/21, 22.8% of children under 16 years of age are in relative low income families, higher (statistically significant) to England average of 19.9%. No trend data are available for Bury and England. Bury has the 2nd highest percentage of children living in relative low income families with the lowest percentage in Stockport of 15.8% and highest in Stockton-on-Tees at 23.3%. There are no data on inequalities at Bury level.
Free school meals: % uptake among all pupils
This indicator provides insights into child poverty and serves as a proxy for socioeconomic disadvantage among school-aged children. It is defined as the percentage of pupils known to be eligible for and claiming free school meals who attend a state funded nursery, primary, secondary or a special school.
Most recent data on uptake of free school meals are available for the year 2018, where the uptake in Bury was 14.7%, higher (statistically significant) than England average of 13.5%. The trend data based on 5 most recent data points suggests that the free school uptake in Bury is decreasing but the gap in uptake (%) compared with England is increasing. Free school uptake was similar to England average for the years 2014 (15.9% in Bury vs 16.3% in England) and 2015 (15.3% in Bury vs 15.2% in England) but went above England’s average (statistically significant) for 2016 (14.9% in Bury vs 14.3% in England) and the gap increasing in 2017 (14.7% in Bury vs 13.9% in England) and 2018 (14.7% in Bury vs 13.5% in England) (Figure 1).
Figure 1: Trend in % uptake of free school meals among all pupils for Bury and England from the year 2014 to 2018
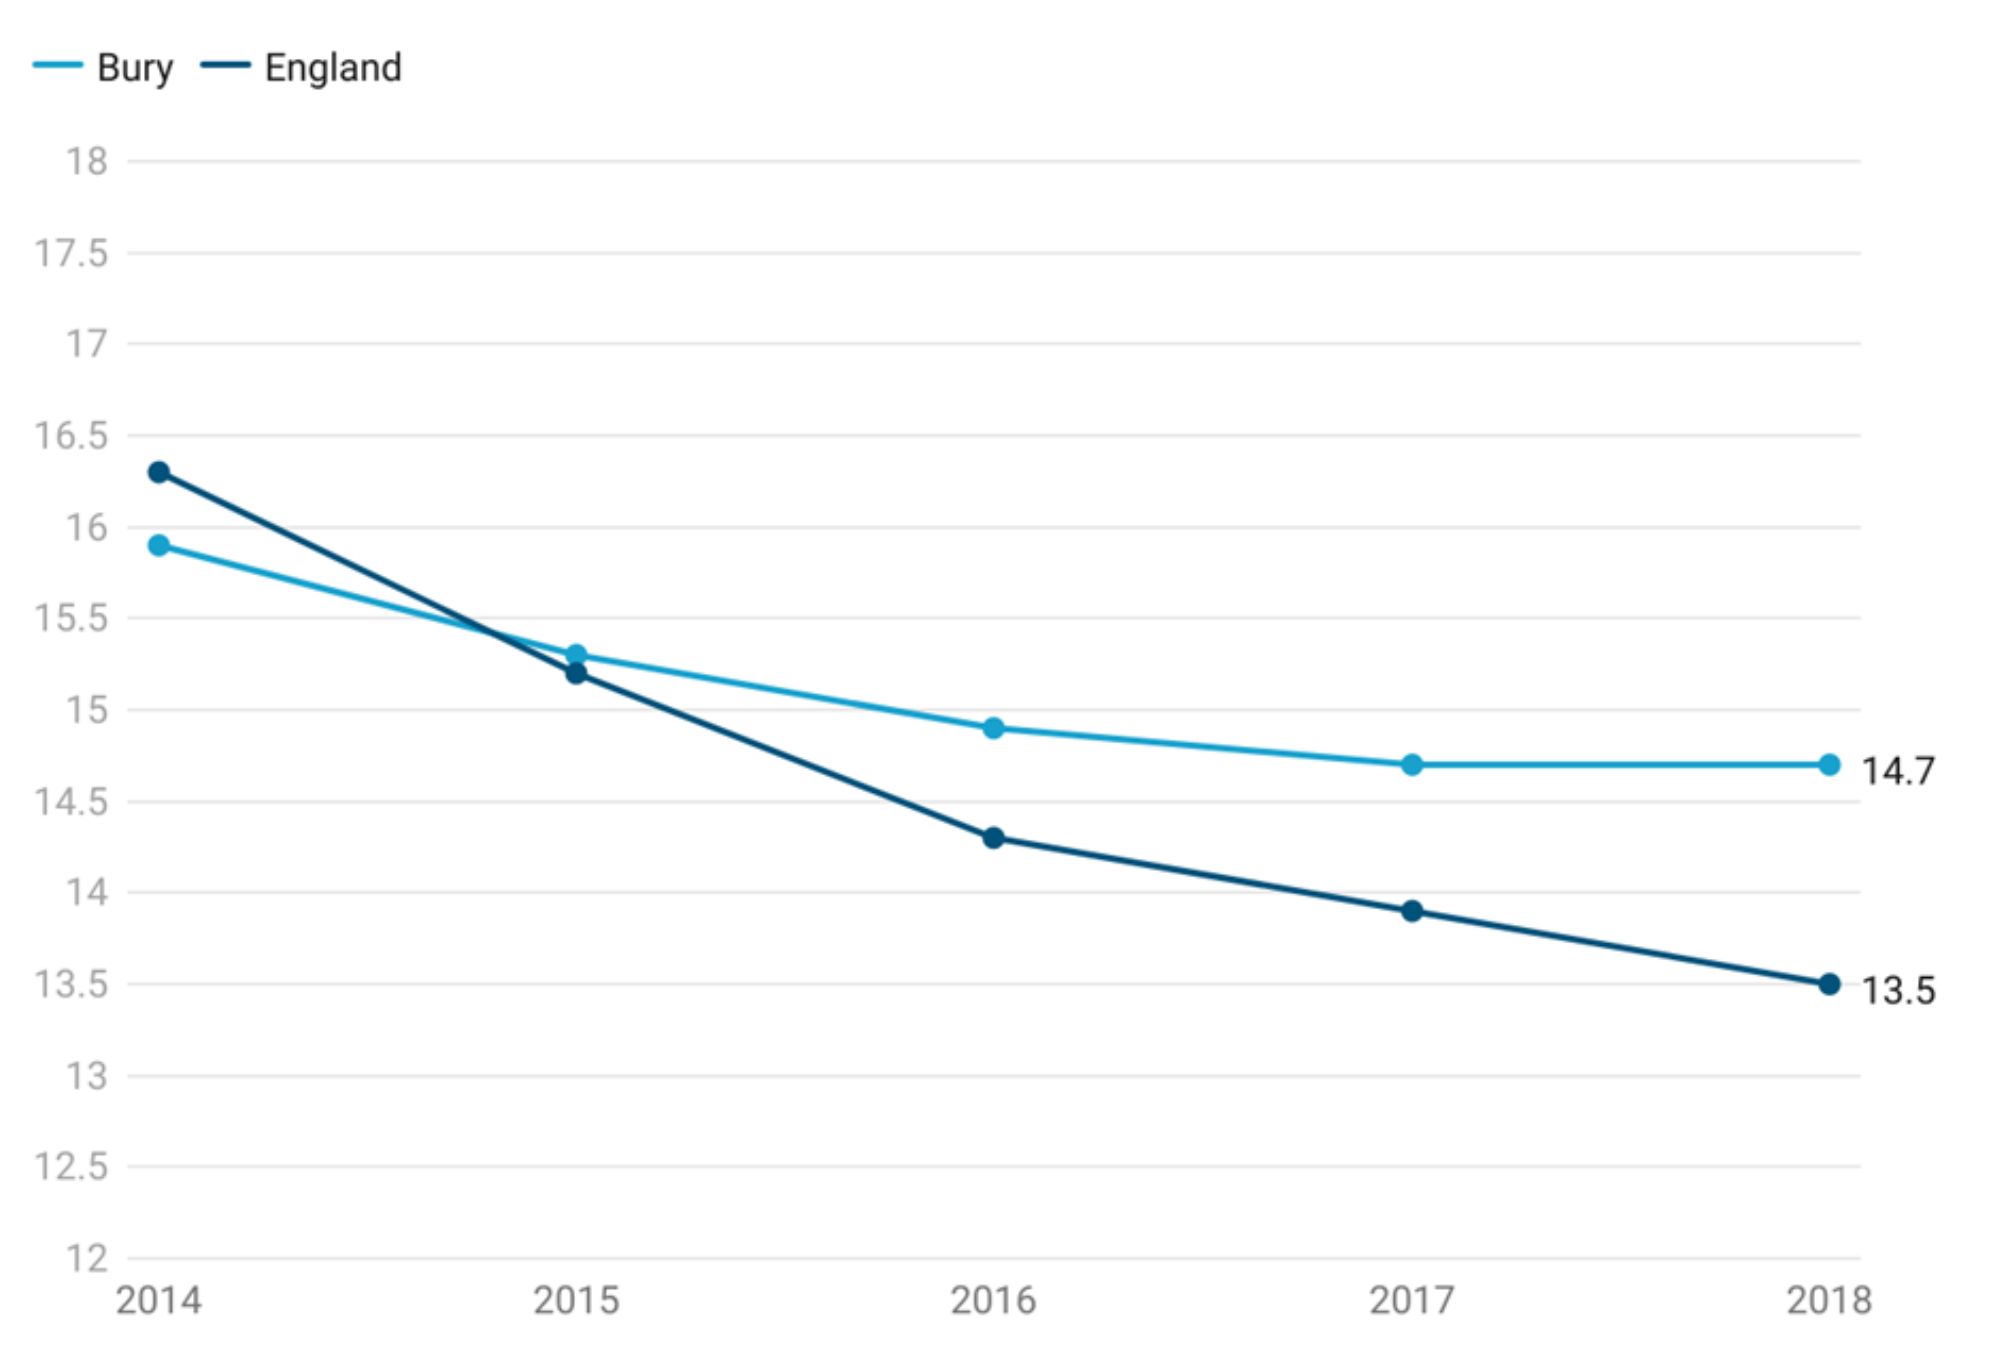
Bury has the 3rd highest % uptake of free school meals among all pupils in its group of 6 statistical children service neighbours with the lowest percentage in Stockport at 11.4% and highest in Stockton-on Tees at 16.4% (Child and Maternal Health, 2018). Data on inequalities for Bury are only available by age with 14.5% uptake of free school meals among both primary and secondary school age children. Data for England by age suggests 13.7% uptake of free school meals among primary school age children and 12.4% in secondary school age children. Examining data by deprivation suggests increasing % uptake of free school meals among all pupils with increasing levels of deprivation. The most deprived decile in England has an uptake of 22.1% compared with 7.1 in the least deprived decile for the year 2021-22 (Child and Maternal Health, 2018).
Child Mortality
Death in childhood represents not only a tragedy for that child’s family but also a loss to wider society in terms of lost years of productive life. Once children reach the age of one, injuries become the most common cause of death. It is important to acknowledge that many of these deaths resulting from injuries could be prevented. Furthermore, there is a recognised need to offer sufficient support to children and families facing life-limiting or life-threatening conditions.
Child mortality is presented as a directly standardised rate of death due to all causes, per 100,000 population aged 1-17 years. The child mortality data for Bury reveals that the child mortality rate stands at 12.4 per 100,000, which is statistically similar to the England average of 10.3 per 100,000 (Child and Maternal Health Profile, 2020).
Figure 2 below presents the trend in child mortality rate in Bury.
Figure 2: Trend in child mortality rate in Bury from the period 2010-12 to 2018-20
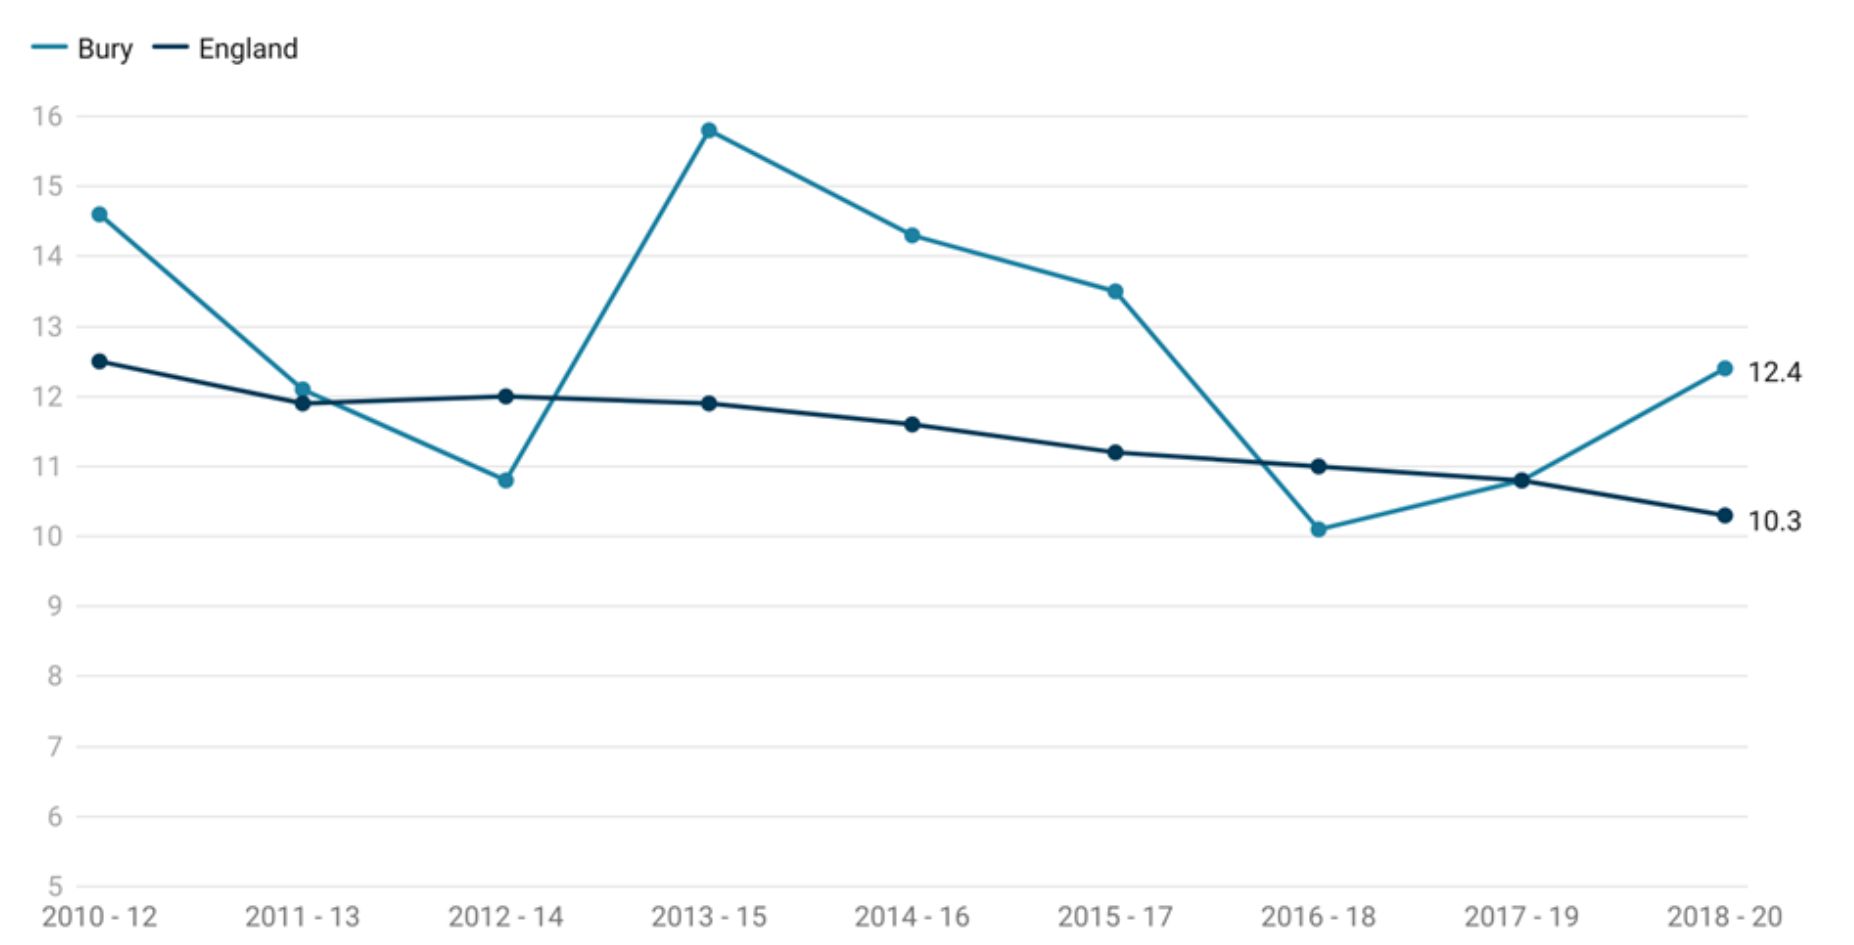
During the period from 2010 to 2012, the child mortality rate in Bury was recorded at 14.6 per 100,000 population aged 1-17 years. This rate was slightly higher than the England average, which stood at 12.5 per 100,000 population. However, in subsequent years, there has been a decline in child mortality rates in Bury, with a decrease to 10.1 per 100,000 population in 2016-18. Following this, the rates fluctuated but remained relatively stable, with the most recent data point indicating a rise to a rate of 12.4 per 100,000 population in 2018-20.
In comparison, the average child mortality rate for England exhibited a gradual decrease over the same period, with a slight dip in 2012-14 but showing consistent decline thereafter. The latest recorded rate for England in 2018-20 was 10.3 per 100,000 population.
Upon examining these trends, we can observe that Bury initially experienced a higher child mortality rate compared to the England average. However, there has been a decline in child mortality rates up till 2017-2019, where the rates approached England’s average (both at 10.8). In 2018-20, there has been an increase in child mortality (12.4) compared with England average (10.3). This is likely because of fluctuation due to small numbers. However, we will continue to monitor data over time (Child and Maternal Health Profile, 2020).
There are lack of data at local levels to examine inequalities in Bury but data for England suggests inequalities by deprivation with higher child mortality in the most deprived decile (13.8) compared with the least deprived decile (7.2) (Child and Maternal Health Profile, 2020)
Immunisation Coverage
Immunisation coverage is the best indicator of the level of protection a population will have against vaccine preventable communicable diseases. Coverage is closely correlated with levels of disease. Monitoring coverage identifies possible drops in immunity before levels of disease rise. Previous evidence shows that highlighting vaccination programmes encourages improvements in uptake levels.
Data on immunisation for school-aged children are publicly available for Human Papilloma Virus (HPV) vaccine (one dose at 12-13 years and two doses 13-14 years) and Meningococcal ACWY conjugate vaccine (MenACWY) at 14-15 years of age. For HPV vaccine, we will present data on one dose only as the JCVI has advised move to 1 dose of HPV vaccine for adolescents. JCVI has stated that 1 dose of the vaccine is just as effective as 2 at preventing cancers caused by HPV in adolescents. Immunisations during the early years are available under the early years section of Starting Well in the Bury JSNA.
Human Papilloma Virus (HPV) Vaccine
HPV is a common infection that is spread by skin-to-skin contact, including sexual contact, which can lead to the development of cancers affecting both women and men, including the cervix, vulva, vagina, penis, anus, and oral cavity. On the advice of the Joint Committee on Vaccination and Immunisation (JCVI), an HPV national vaccination programme was introduced in 2008, to protect adolescent females against cervical cancer. From September 2019, 12 to 13 year old males became eligible for HPV immunisation alongside females, based on JCVI advice. This was the first year that males in year 9 were offered the HPV vaccine (OHID, 2020).
Research has shown that in England cervical cancer has almost been eliminated among young women who were offered the HPV vaccine (NIHR, 2022).
Population vaccination coverage: HPV vaccination coverage for one dose (12 to 13 year old) (Female)
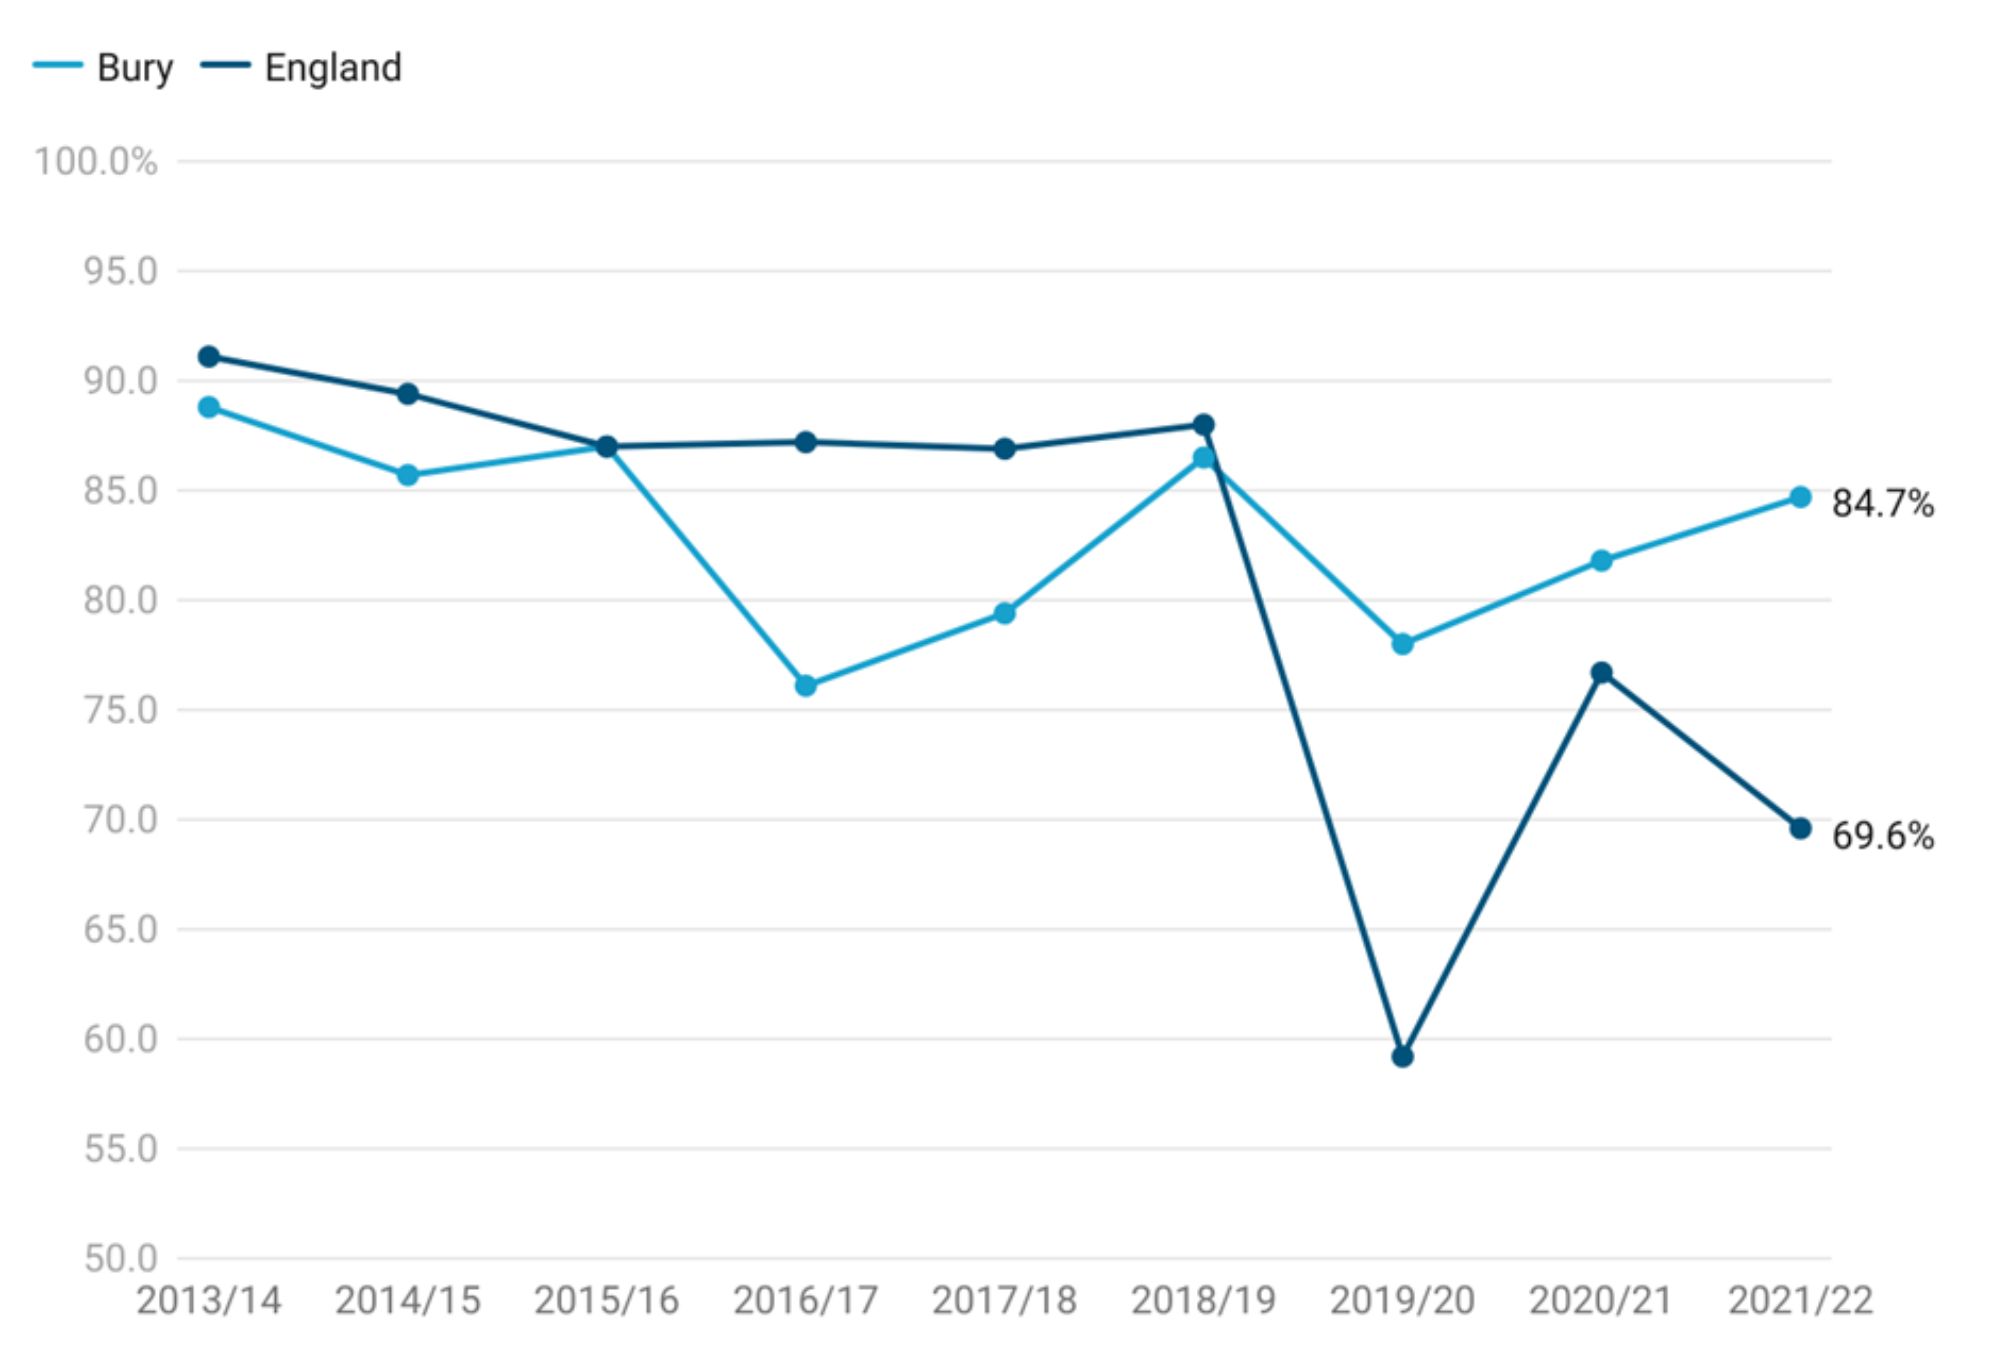
HPV vaccination coverage in Bury for one dose in females aged 12-13 years for the period 2021/22 is at 84.7%, higher than England average of 69.6% but lower than the national target of 90% or higher (Child and Maternal Health, 2022). Bury would have needed to vaccinate 57 additional females aged 12-13 years to reach the national target of 90% or higher in 2021/22.
Examining trend data for Bury from 2013/14 to 2021/22, there is a slight decrease in HPV vaccination coverage from 88.8% in 2013/14 to 85.7% in 2014/15. The coverage remains relatively stable in 2015/16 at 87%. This is followed by a drop in 2016/17 to 76.1%. The coverage then increases in 2017/18 to 79.4% and further improves in 2018/19 to 86.5%. It experiences a decline in 2019/20 to 78% but coverage has increased over the past two data points from 81.8% in 2020/21 to 84.7% in 2021/22. Throughout this period, Bury coverage has not met the national target of 90%.
England saw a gradual decline in HPV vaccination coverage (one dose) from 91.1% in 2013/14 to 86.9% in 2017/18. Coverage then remained fairly stable at 88% in 2018/19. There was a large drop in vaccination coverage in 2019/20, where it declined to 59.2% followed by an increase to 76.7% in 2020/21. The most recent data from 2021/22 suggests another decline to 69.6% in 2021/22.
Comparing Bury with England, the population vaccination coverage for HPV vaccine (one dose) was lower than England average from 2013/2014 to 2018/2019. However, in the recent years (2020/21 and 2021/22) the coverage in Bury is higher than England average (Figure 3).
Figure 3: Trend in HPV vaccination coverage for one dose (12 to 13 year old) (Female) for Bury and England from the period 2013/14 to 2021/22
Bury has the 2nd highest coverage in its group of 6 statistical children service neighbours with the highest in Stockport at 90.3% and lowest in Stockton-on-Tees at 51.4% (Child and Maternal Health, 2022).
Data on inequalities for Bury and England are only available by Sex. As we are presenting data on HPV vaccinations by males next, this comparison will not be presented here.
No geographical by PCN or GP level data are present for the HPV vaccine.
Population vaccination coverage: HPV vaccination coverage for one dose (12 to 13 year old) (Male)
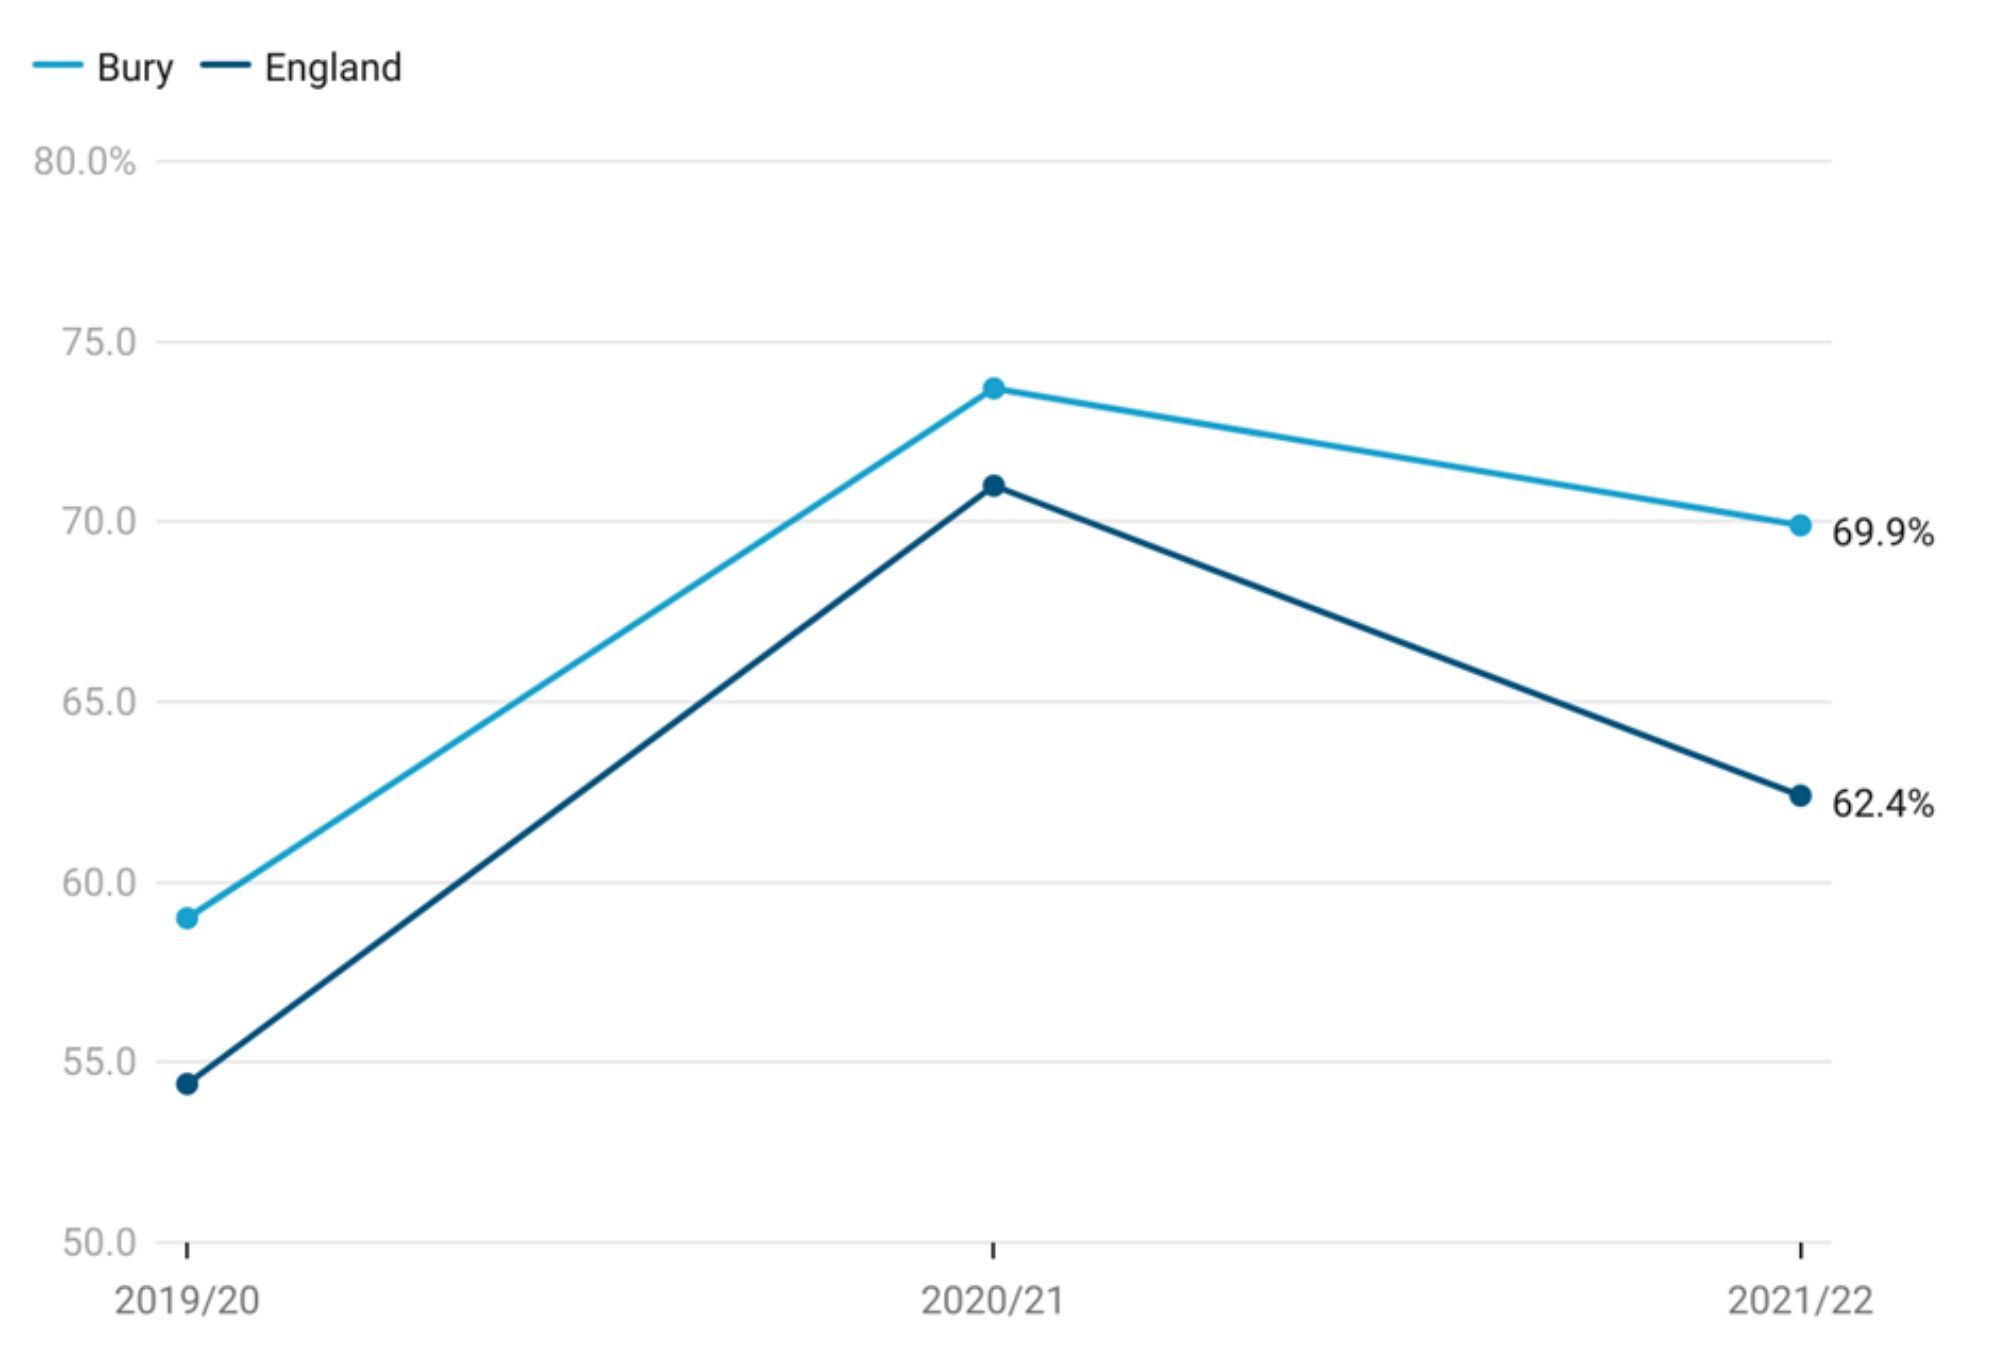
HPV vaccination coverage in Bury for one dose in males aged 12-13 years for the period 2021/22 is at 69.9%, higher than England average of 62.4% but not meeting the national target of 90% and over (Child and Maternal Health, 2022). Bury would have needed to vaccinate 250 additional males aged 12 to 13 years to reach the national target in 2021/22.
Examining trend data for Bury from 2019/20 (when HPV vaccines for males were recommended) to 2021/22, HPV vaccination coverage increased from 59% in 2019/20 to 73.7% in 2020/21. This was followed by a drop in 2021/22 to 69.9%.
England saw a fairly similar trend with coverage increasing from 54.4% in 2019/20 to 71% in 2020/21. Similar to Bury, there was a decrease in coverage to 62.4% in 2021/22.
Comparing Bury with England, the population vaccination coverage for HPV vaccine (one dose) was consistently higher than England average from 2019/20 to 2021/2022 but did not meet the national target of 90% or higher (Figure 4).
Figure 4: Trend in HPV vaccination coverage for one dose (12 to 13 year old) (Male) for Bury and England from the period 2019/20 to 2021/22
Bury has the 2nd highest coverage in its group of statistical neighbours with the highest in Stockport at 85.5% and lowest in Rochdale at 37% (Child and Maternal Health, 2022). Data are available in males by CIPFA nearest neighbours and not by children services statistical neighbours.
No geographical by PCN or GP level data are present for the HPV vaccine.
Meningitis ACWY
The MenACWY vaccination was introduced into the national immunisation programme in autumn 2015. The MenACWY conjugate vaccine provides direct protection to the vaccinated cohort and, by reducing MenW carriage, also provides indirect protection to unvaccinated children and adults. This follows advice from the Joint Committee on Vaccination and Immunisation (JCVI). It is routinely offered through schools in academic school Years 9 and 10 (rising 14 and rising 15 year olds).
Population vaccination coverage: Meningococcal ACWY conjugate vaccine (MenACWY) (14 to 15 years)
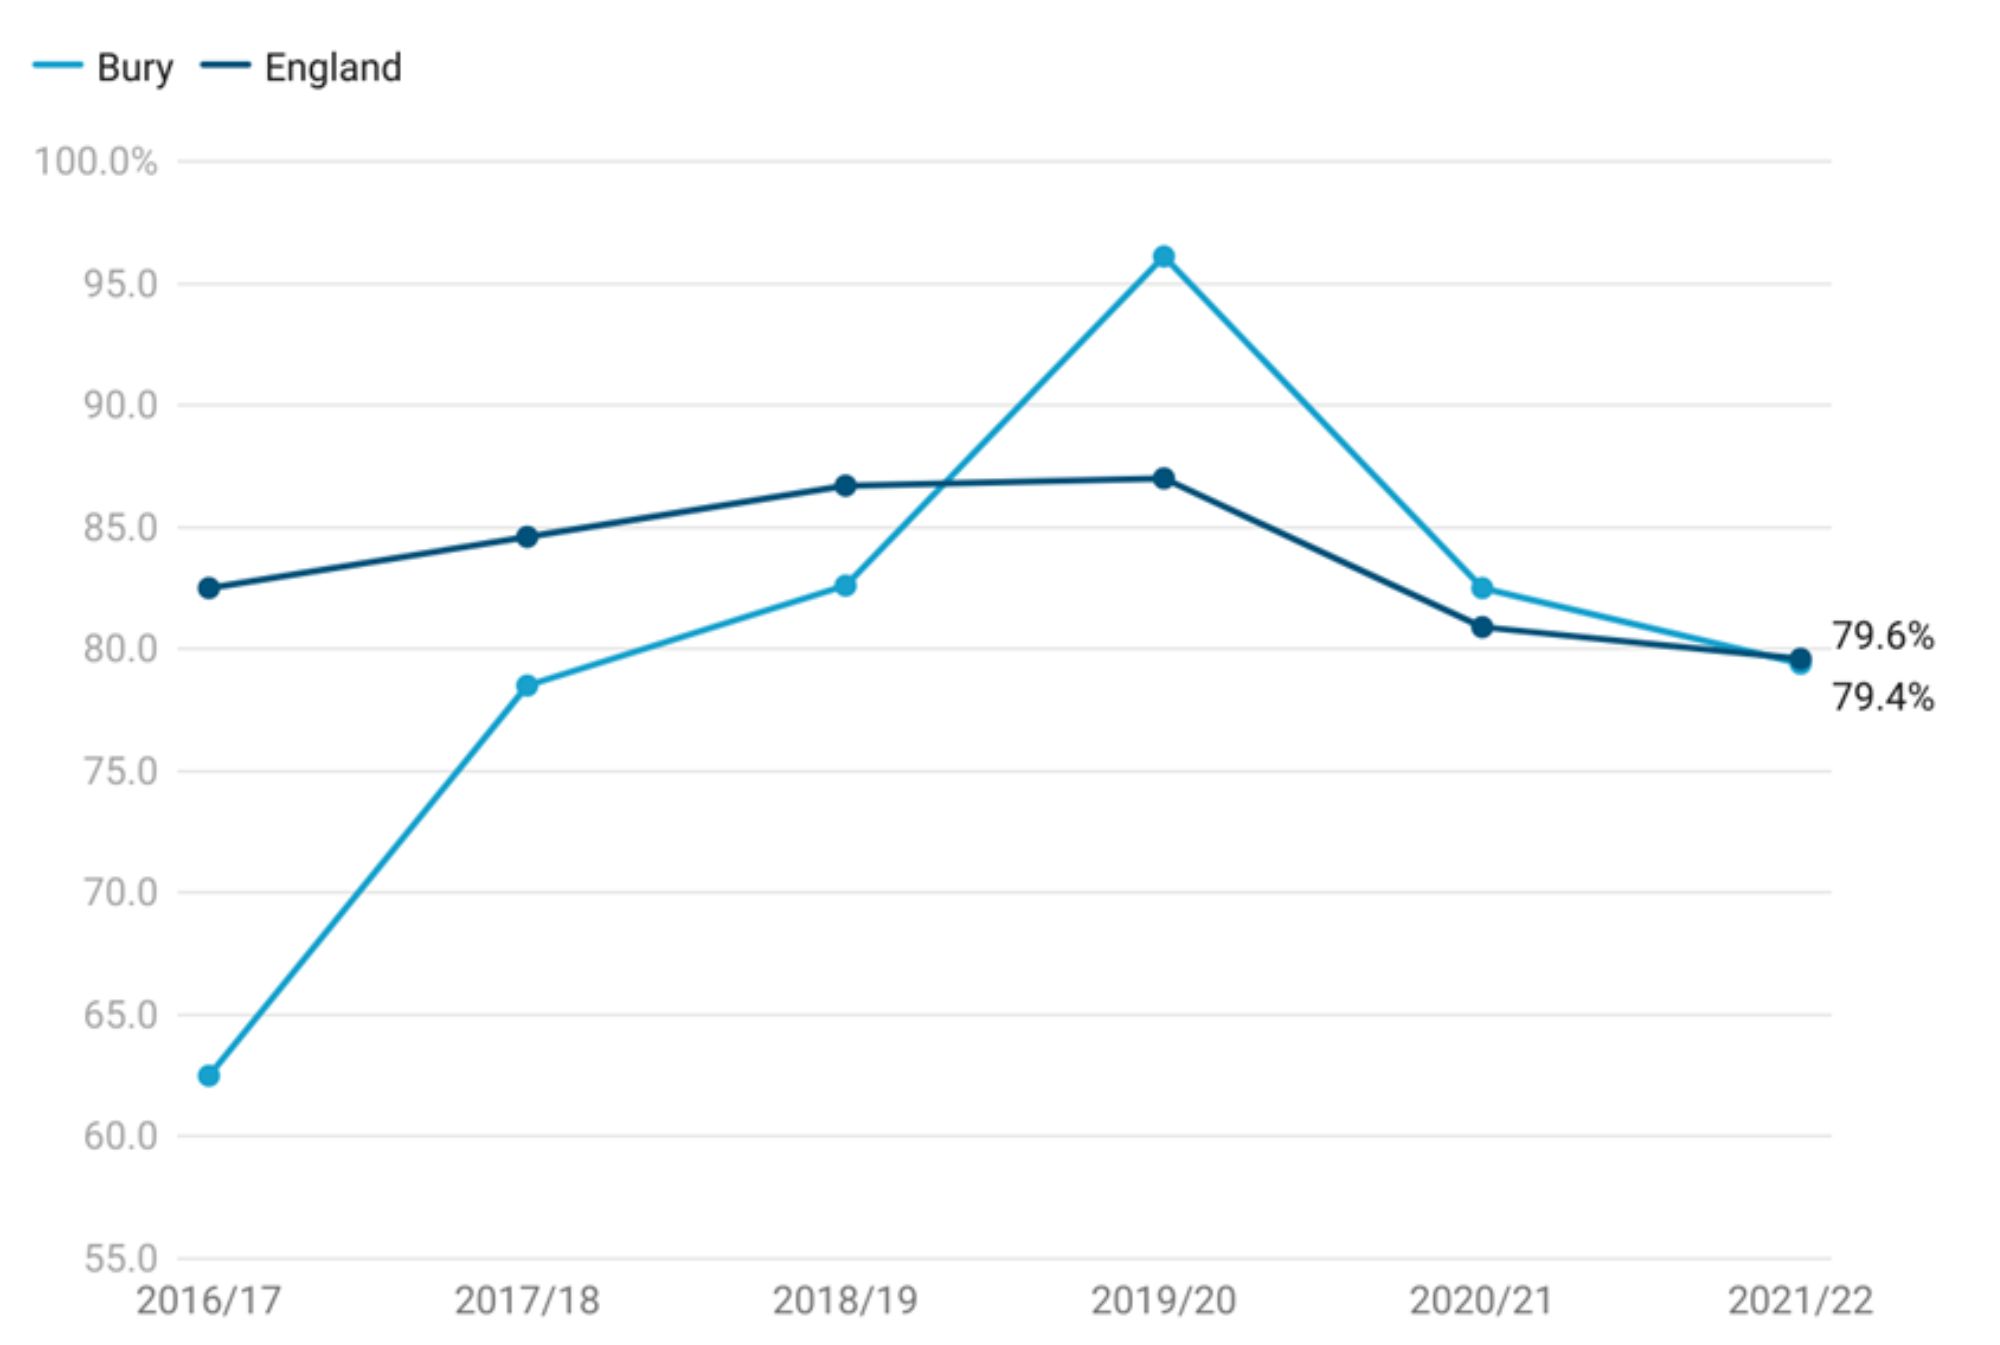
This indicator measures local authority level MenACWY vaccine coverage for pupils at the end of school Year 10. For the year 2021/22, Bury has a vaccination coverage of 79.4%, slightly higher than North-West (NW) average of 78.7% and similar to England average of 79.6%. The coverage in Bury is below the target of 90% and over. In 2021/22, Bury needed to vaccinate 255 additional children to reach the national target (Child and Maternal Health, 2022).
Examining trend data for Bury, immunisation coverage increased from 62.5% in 2016/17 to 78.50% in 2017/18. The coverage continued to improve in the following years, reaching 82.6% in 2018/19 and peaking at 96.1% in 2019/20. This was followed by a decline to 82.5% in 2020/21 and 79.4% in 2021/22.
England saw a fairly similar trend with coverage increasing from 82.5% in 2016/17 to its peak at 87% in 2019/20. Similar to Bury, there has been a decline in coverage from 2019/20, with coverage at 80.9% in 2020/21 and 79.6% in 2021/22.
Comparing Bury with England, we see that Bury's Meningococcal ACWY vaccination coverage remained below National average of 90% and over from 2016/17 to 2018/19. However, Bury’s coverage was higher than England’s average for 2019/20 and 2020/21 and went above the national target of 90% and over in 2019/20. Most recent data suggests similar coverage for Bury and England (Figure 5).
Figure 5: Trend in Population vaccination coverage: Meningococcal ACWY conjugate vaccine (MenACWY) (14 to 15 years) for Bury and England from the period 2016/17 to 2021/22
Bury has the 8th highest coverage in its group of 16 statistical neighbours with the highest in Stockport at 91.7% and lowest in Wigan at 58% (Child and Maternal Health, 2022). Data are available in males by CIPFA nearest neighbours and not by children services statistical neighbours.
There are no data on inequalities at Bury level but England data suggests decreasing coverage of MenACWY vaccine with increasing levels of deprivation. The most deprived decile in England has a coverage of 70.8% compared with 85% in the least deprived decile for the year 2021-22 (Child and Maternal Health, 2022).
No geographical by PCN or GP level data are present for the HPV vaccine.
Emergency care
This section provides data on emergency cases requiring immediate attention for school-aged children in Bury. This data assists in identifying gaps in care, effective resource allocation, assessment of management of diseases, informing prevention efforts and evaluating healthcare services.
Common causes for emergency hospital admissions in school-aged children often include respiratory ailments like asthma and pneumonia, which can make children susceptible to infections. Certain chronic conditions like diabetes and epilepsy may require hospitalisation for effective management and monitoring.
Accidental injuries resulting from falls and mishaps, leading to fractures and head trauma, also contribute significantly. Moreover, mental health concerns, including self-harm and contemplation of self-harm, have emerged as crucial matters, underscoring the necessity for comprehensive support and assistance. Admissions from injuries and mental health concerns will be presented in their relevant sections.
Emergency admissions (aged under 18 years)
Emergency admissions for children and young people under 18 years of age are available as a crude rate per 1,000 population aged under 18 years.
Emergency admissions for children and young people under 18 years of age in Bury for period 2021/22 is 79.4, statistically higher than England average of 70.7. No trend data are available for Bury and England.
Bury has the lowest rate of emergency admissions in its group of 6 statistical children service neighbours with the highest rate in Stockton-on-Tees at 104.6 (Child and Maternal Health, 2022).
Data on inequalities for Bury are available by Sex only with higher rates in males (83.7 per 1000 and statistically worse than Bury average) compared with females (75.6 per 1000 and statistically better than Bury average) (Child and Maternal Health, 2022). England data are available by sex and levels of deprivation. Similar to Bury, males aged under 18 years have a higher admission rate (73.9 per 1000) compared with females (67.4 per 1000) Data by deprivation based on LSOA deprivation deciles suggests a deprivation gradient with increasing emergency admission rates with increasing levels of deprivation. The most deprived decile in England has an admission rate of 84.1 compared with 57.5 in the least deprived decile for the year 2021/22 (Child and Maternal Health, 2022).
A&E attendances (under 18 years)
A&E visits among children and young individuals under the age of 18 are often avoidable and commonly caused by accidental injuries or minor illnesses that could have been treated in primary care settings. From 2008 to 2012, there were over 320,000 road-related injuries and 2,300 road fatalities involving children and young people under the age of 25 in England. In the year 2014/15, there were 19.6 million recorded attendances at major A&E departments, single specialty A&E departments, walk-in centres, and minor injury units in England. Approximately one-quarter (25.9%) of these attendances were made by children and young people aged 0-19 years.
This indicator covers A&E attendances for children as crude rates per 1000 population aged under 18 years. We have included this indicator as the age range covers school-aged children.
A&E attendances for children as crude rates per 1000 population aged under 18 years under in Bury for 2021/22 is 485.5 per 1000 population aged under 18 years and statistically higher than England average of 439.8 (Child and Maternal Health, 2022).
Bury has the 4th highest rate of A&E attendance rates in its group of 6 statistical children service neighbours with the highest rate in Stockton-on-Tees of 625.1 and lowest rate in Calderdale at 418.3 for the year 2021/22 (Child and Maternal Health, 2022).
Data on inequalities for Bury are available by Sex only with higher rates in males (481.6 per 1000) compared with females (433.6 per 1000) (Child and Maternal Health, 2022). England data are available by sex and levels of deprivation. Males under 18 years of age have a higher A&E attendance rate (464.6 per 1000) compared with females (412.7 per 1000). Data by deprivation based on deprivation deciles suggests decreasing emergency admission rates with increasing levels of deprivation. The most deprived decile in England has an attendance rate of 520.9 compared with 359.9 in the least deprived decile for the year 2021-22 (Child and Maternal Health, 2022).
Asthma
Asthma is the most common chronic medical condition in children in the UK (1.1 million), and it is characterised by varying levels of inflammation in the airways. Symptoms of airways inflammation include coughing, wheezing, shortness of breath, and chest tightness. Standard asthma therapies, when used regularly and correctly, can control inflammation and symptoms in most children. Having well-controlled asthma reduces the likelihood of needing hospital care.
Acute asthma episodes are preventable. Often, asthma symptoms are accepted as normal, leaving airway inflammation untreated, increasing chances of those suffering from asthma having a life-threatening asthma attack. As a result, there are increased rates of acute care episodes and preventable deaths.
Understanding local trends in emergency admissions for asthma in children and young people with this long-term condition, as well as benchmarking against geographical and statistical neighbours, will aid in service review and redesign (Child and Maternal Health, 2022).
Admissions for Asthma (0-9 years)
This indicator covers emergency admissions for asthma for children as crude rates per 100,000 population aged 0-9 years. We have included this indicator as the age range (0-9 years) covers school-aged children.
Please note: Since we completed the early years section, OHID has updated the figures. This section contains the most up to date data on asthma admissions. No trend data are available for Bury and England as the indicators are being revised by the ONS based on Census 2021. Once revised population estimates are published, updated back-series data would be made available.
Emergency admissions crude rate for asthma for children aged 0-9 years in Bury for 2021/22 is 255.1 per 100,000 population aged 0-9 years, statistically higher than England average of 172.7 (Child and Maternal Health, 2022).
Bury has the 2nd highest rate of emergency admissions for asthma in its group of 6 statistical children service neighbours with the highest rate in Stockport of 274.9 and lowest rate in Stockton-on-Tees at 152.3 for the year 2021-22 (Child and Maternal Health, 2022).
Data on inequalities for Bury are available by Sex only with slightly higher rates in females (263.5 per 100,00) compared with males (247.2 per 100,000) (Child and Maternal Health, 2022). England data are available by sex and levels of deprivation. Males aged 0-9 years have a higher asthma admission rate (214 per 100,000) compared with females (129.3 per 100,000). Data by deprivation based on deprivation deciles suggests decreasing emergency admission rates with increasing levels of deprivation. The most deprived decile in England has an admission rate of 277.7 compared with 81.4 in the least deprived decile for the year 2021-22 (Child and Maternal Health, 2022).
Diabetes
Insulin-dependent diabetes mellitus (IDDM), commonly known as type 1 diabetes, is a chronic (long-term) condition characterised by the inability of the pancreas to produce sufficient insulin. It primarily affects children and young individuals.
Effective management of insulin-dependent diabetes in children plays a crucial role in preventing emergency admissions. With proper education and support, children and their families can learn to recognise and respond to warning signs and symptoms of complications. Timely monitoring of blood glucose levels, adherence to insulin regimens, and regular healthcare follow-ups are key to preventing acute episodes. Additionally, promoting healthy behaviour including a balanced diet and regular physical activity, can help maintain stable blood sugar levels and reduce the risk of emergencies. By implementing comprehensive diabetes care programmes, ensuring access to necessary medications and supplies, and fostering awareness among healthcare providers, families, and schools, the occurrence of emergency admissions related to insulin-dependent diabetes in children can be significantly reduced.
Admissions for Diabetes (0-9 years)
This indicator covers emergency admissions for diabetes among children, presenting the crude rates per 100,000 population aged 0-9 years. The inclusion of this indicator is based on the age range's relevance to school-aged children.
For the year 2021/22, the crude rate of emergency admissions for diabetes among children aged 0-9 years in Bury was 42.5 per 100,000 population, which is statistically similar to the England average of 37 (Child and Maternal Health, 2022). Bury ranks third in terms of emergency admissions for diabetes among its group of 6 statistical children service neighbours, with Stockton-on-Tees having the highest rate at 43.5 and Sefton having the lowest rate at 35 for the same period (Child and Maternal Health, 2022).
Please note: no trend data are available for Bury and England, as the ONS is revising the indicators based on Census 2021. Once revised population estimates are published, updated back-series data will be made available.
Regarding inequalities, there are no available data specifically for Bury. However, England data indicates no significant disparities between sexes in terms of admission rates for diabetes, with 36.8 per 100,000 in males compared to 37.2 per 100,000 in females. There is no significant deprivation gradient by deprivation decile, although children in the least deprived deciles have the lowest emergency admission rate at 27.1 (Child and Maternal Health, 2022).
Epilepsy
Childhood epilepsy is a neurological condition characterised by recurring seizures. Seizures occur due to abnormal electrical activity in the brain, causing temporary disruptions in a child's normal functioning. These seizures can present in various ways, such as convulsions, loss of consciousness, confusion, or unusual sensations. The causes of epilepsy in children can be diverse, including genetic factors or brain injuries, although some cases have unknown origins. Collaborating closely with healthcare professionals is crucial for developing an individualised treatment plan, which may involve medications or other interventions to effectively manage and control seizures.
Emergency hospital admissions of children aged 0-9 years with a primary diagnosis of epilepsy provides valuable insights into the management and impact of epilepsy in this age group. These admissions reveal instances where children with epilepsy experienced seizures that required immediate medical attention and hospitalisation. Monitoring the frequency and causes of these emergency admissions can help identify potential gaps in epilepsy management, including medication adherence, seizure control, and access to specialised care. It also highlights the need for effective education and support for families, caregivers, and healthcare professionals in managing epilepsy and preventing seizures. By analysing these admissions, healthcare providers and policymakers can work towards improving epilepsy care, reducing the occurrence of status epilepticus, and enhancing the overall well-being of children with epilepsy.
Admissions for epilepsy (0-9 years)
This indicator covers emergency admissions for epilepsy among children, presenting the crude rates per 100,000 population aged 0-9 years. The inclusion of this indicator is based on the age range's relevance to school-aged children.
For the year 2021/22, the crude rate of emergency admissions for epilepsy among children aged 0-9 years in Bury was 63.8 per 100,000 population, which is statistically similar to the England average of 89.7 (Child and Maternal Health, 2022). Bury has the lowest emergency admissions for epilepsy among its group of 6 statistical children service neighbours, with Sefton having the highest rate at 139.9 for the same period (Child and Maternal Health, 2022).
Please note: no trend data are available for Bury and England, as the ONS is revising the indicators based on Census 2021. Once revised population estimates are published, updated back-series data will be made available.
Regarding inequalities, specific data for Bury are unavailable. However, data for England reveals higher admission rates for epilepsy among males (93.7 per 100,000) compared to females (85.4 per 100,000). A slight deprivation gradient is observed by deprivation decile, with children in the third least (73.2) and least deprived deciles (75.1) having the lowest emergency admission rates. Conversely, children in the most deprived decile (106.6) have the highest emergency admission rate (Child and Maternal Health, 2022).
Injuries
Injuries are a leading cause of hospitalisation and premature mortality in children and adolescents. They are also a source of long-term health problems, such as mental health issues related to the experience(s).
Examining hospital admissions caused by unintentional and deliberate injuries in children and young people is crucial for public health surveillance, injury prevention planning, resource allocation, policy development, and evaluation of interventions. Understanding the causes of hospital admissions helps shape child safety policies, ensures appropriate allocation of healthcare resources, and allows evaluation of preventive measures. This helps create safer environments for children and promotes their overall well-being.
Specific data regarding the ages that correspond to children in school are not available. Therefore, we will present data for two age groups: children aged 0-14 years and young people aged 15-24 years, which encompass the school-age range.
Hospital admissions caused by unintentional and deliberate injuries in children aged 0-14 years
The admissions data for children aged 0-14 are available as a crude rate of hospital admissions caused by unintentional and deliberate injuries in children aged under 15 years per 10,000 resident population aged under 15 years.
Hospital admissions caused by unintentional and deliberate injuries in children (aged 0 to 14 years) in the period 2021-22 for Bury are 90.8 per 10,000 resident population aged under 15 years, similar (statistically significant) to England average of 84.3. There are no available trend data on hospital admissions caused by unintentional and deliberate injuries in children 0-14 years old for Bury and England (Child and Maternal Health, 2022).
Amongst Bury’s group of 6 statistical children service neighbours, Bury has the 2nd lowest hospital admissions in this age range, with the highest rate in Lancashire at 114.8 per 10,000 and lowest in Stockton-on-Tees at 84.6 per 10,000 (Child and Maternal Health, 2022)
Data on inequalities are present by sex only for Bury that suggest slightly higher hospital admissions rates in females of 93.3 per 10,000 resident population aged under 15 years (statistically similar to England average) compared with 88.4 per 10,000 in males (statistically similar to England average) (Child and Maternal Health, 2022).
Contrary to the situation in Bury, there is a greater incidence of hospital admissions among males, with a rate of 87.6 per 10,000 residents under the age of 15, in comparison to females, who have a rate of 80.8 per 10,000. Examining data by levels of deprivation, the highest hospital admissions rates are in the most deprived deciles (96) and the lowest in the least deprived decile (76 per 10,000 resident population aged under 15 years) (Child and Maternal Health, 2022).
Children killed and seriously injured (KSI)
Road traffic collisions are a major cause of deaths in children and comprise higher proportions of accidental deaths as children get older. Parents cite vehicle speed and volume as reasons why they do not allow their children to walk or cycle, thereby reducing opportunities for physical activity.
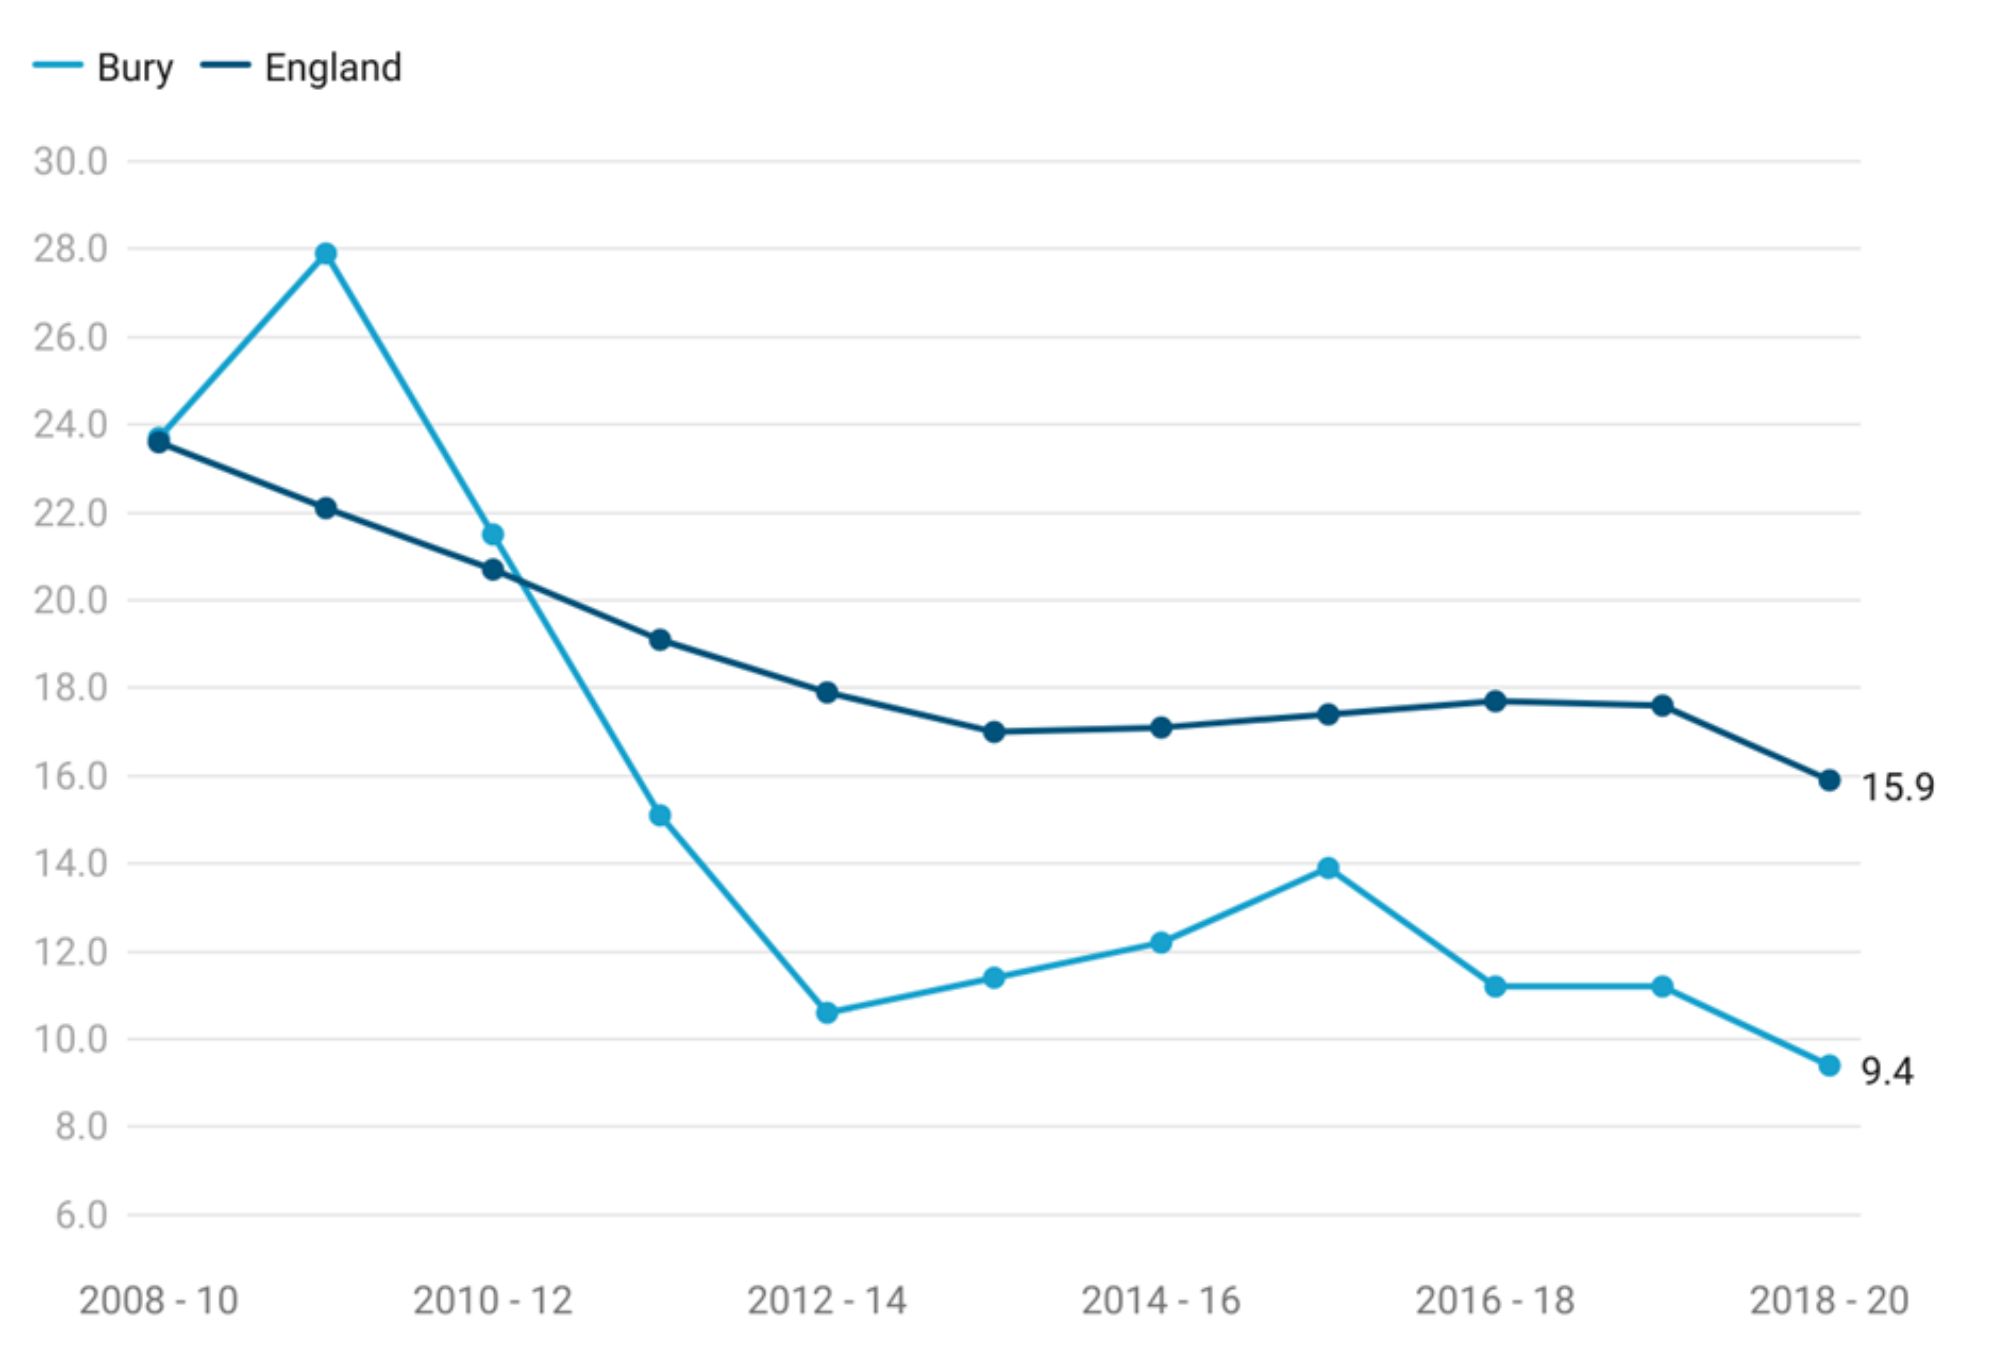
Children killed and seriously injured (KSI) is measured as a crude rate of children aged 0-15 years who were killed or seriously injured in road traffic accidents per 100,000 population. Children KSI for Bury for the period 2018-2020 is 9.4 per 100,000 population and is statistically similar to England average of 15.9 per 100,000 population (Child and Maternal Health Profile, 2020).
Bury has the lowest children killed and seriously injured rate in its group of 6 statistical children service neighbours with the highest in Lancashire at 33.2 per 100,000 population (Child and Maternal Health, 2020).
Examining trend data for Bury, children killed and seriously injured rate fluctuated between 2008-2010 to 2018-2020, with the rate declining from 23.7 in 2008-2010 to 9.4 in 2018-2020. From the period 2008-2010 to 2010-2012, the rate declined slightly from 23.7 to 21.5. This was followed by a notable decrease to 10.6 in 2012-2014. Following that, there was a slight decline in rate for the next few years, with some fluctuations, but it remained relatively stable overall. The rate for children killed and seriously injured reached its lowest point in 2018-2020 at 9.4 per 100,000 population.
In England as a whole, the trend in KSI rates also shows a decline over the given period. From 2008-2010 to 2013-2015, the rate decreased from 23.6 to 17. However, from 2014-16 to 2017-19, there is a slight increase in the rate before decreasing again to 15.9 in 2018-20.
Comparing Bury with England, we can observe that the KSI rate in Bury remained lower than England from the period 2011-2013 to 2018-2020 (Figure 6).
There may be several explanations for the declining trend including improvement in safety measures and infrastructures, enforcement of traffic laws, education and awareness campaigns on road safety, enforcement of traffic laws and increased parental supervision and responsible caregiving practices.
Figure 6: Trend in children killed and seriously injured crude rate for Bury and England from the period 2008-2010 to 2018-2020
Bury has the lowest rate for children killed and seriously injured in its group of 6 statistical children service neighbours with the highest rate in Lancashire at 33.2 (Child and Maternal Health, 2020). There are no data on inequalities for Bury. Examining data by deprivation rate for children killed and seriously injured shows an increasing rate with increasing levels of deprivation. The 2nd most deprived decile in England has the highest rate (23.5) followed by most deprived decile (20.3) compared with the lowest rate of 10.7 in the least deprived decile for the period 2018-2020 (Child and Maternal Health, 2020). Data by sex for England shows a higher rate in Males (20.8) compared with females (10.8).
Children aged 6-10 years killed or seriously injured in road traffic accidents
This indicator is measured as a crude rate of children aged 6-10 years who were killed or seriously injured in road traffic accidents per 100,000 population.
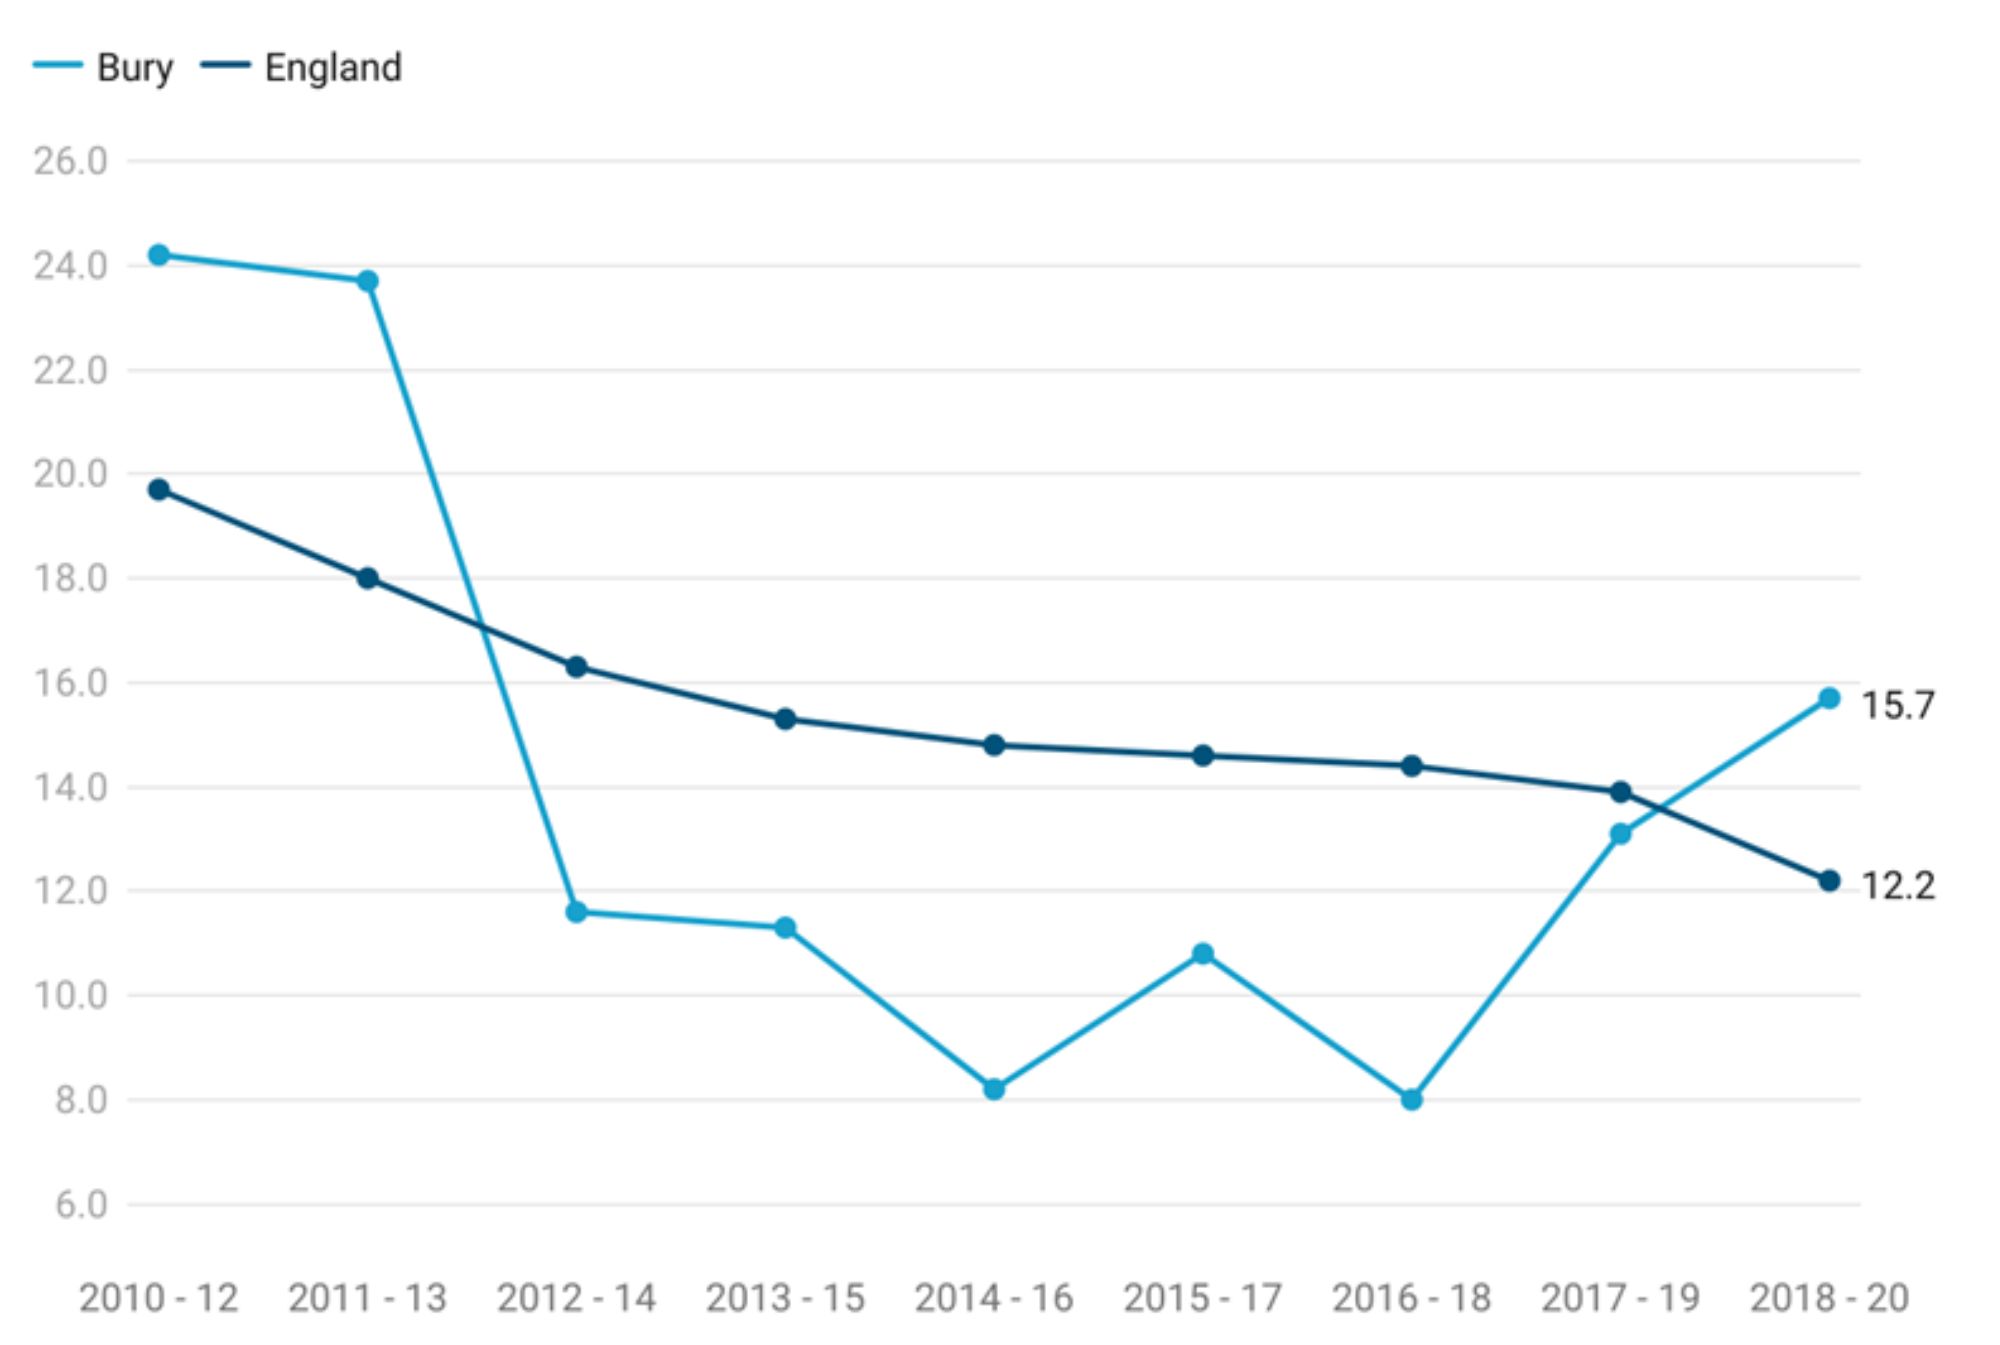
Crude rate for children aged 6-10 years who were killed or seriously injured in road traffic accidents for the period 2018-2020 is 15.7 per 100,000 population and is statistically similar to England average of 22.1 per 100,000 population (Child and Maternal Health Profile, 2020).
Examining trend data for Bury, crude rate for children aged 6-10 years who were killed or seriously injured fluctuated between 2008-2010 to 2018-2020, with the rate declining from 24.2 in 2008-2010 to the lowest rate throughout the observed period of 8 per 100,000 population in 2016-2018. From the period 2008-2010 to 2010-2012, the rate declined slightly from 23.7 to 21.5. This was followed by an increase over the two most recent periods to 13.1 in 2017-2019 and 15.7 in 2018-2020.
In England as a whole, the trend in KSI rates for children aged 6-10 years shows a gradual decline over the given period from the highest rate of 19.7 in 2008-2010 to the lowest rate of 12.2 in 2018-2020.
Comparing Bury with England, we can observe that the KSI rate in Bury remained lower than England average from the period 2012-2014 to 2017-2019. The rate in Bury for the period 2018-2020 is higher than the observed rate for England (15.7 in Bury vs 12.2 in England) (Figure 7).
Figure 7: Trend in children aged 6-10 years killed and seriously injured crude rate for Bury and England from the period 2008-2010 to 2018-2020
Bury has the 3rd highest rate for children aged 6-10 years who were killed or seriously injured in road traffic accidents in its group of 6 statistical children service neighbours with the highest in Lancashire at 31.2 per 100,000 population and lowest in Stockton-on-Tees at 5.1 per 100,000 population (Child and Maternal Health, 2020).
There are no data on inequalities for Bury, Examining data by deprivation rate for children aged 6-10 years killed and seriously injured suggests increasing rate with increasing levels of deprivation. The 2nd most deprived decile in England has the highest rate (19) followed by most deprived decile (17.6) compared with the lowest rate of 7.1 in the least deprived decile for the period 2018-2020 (Child and Maternal Health, 2020). Data by sex for England shows a higher rate in Males (15.3 per 100,000 population) compared with females (9 per 100,000 population).
Children aged 11-15 years killed or seriously injured in road traffic accidents
This indicator is measured as a crude rate of children aged 11-15 years who were killed or seriously injured in road traffic accidents per 100,000 population.
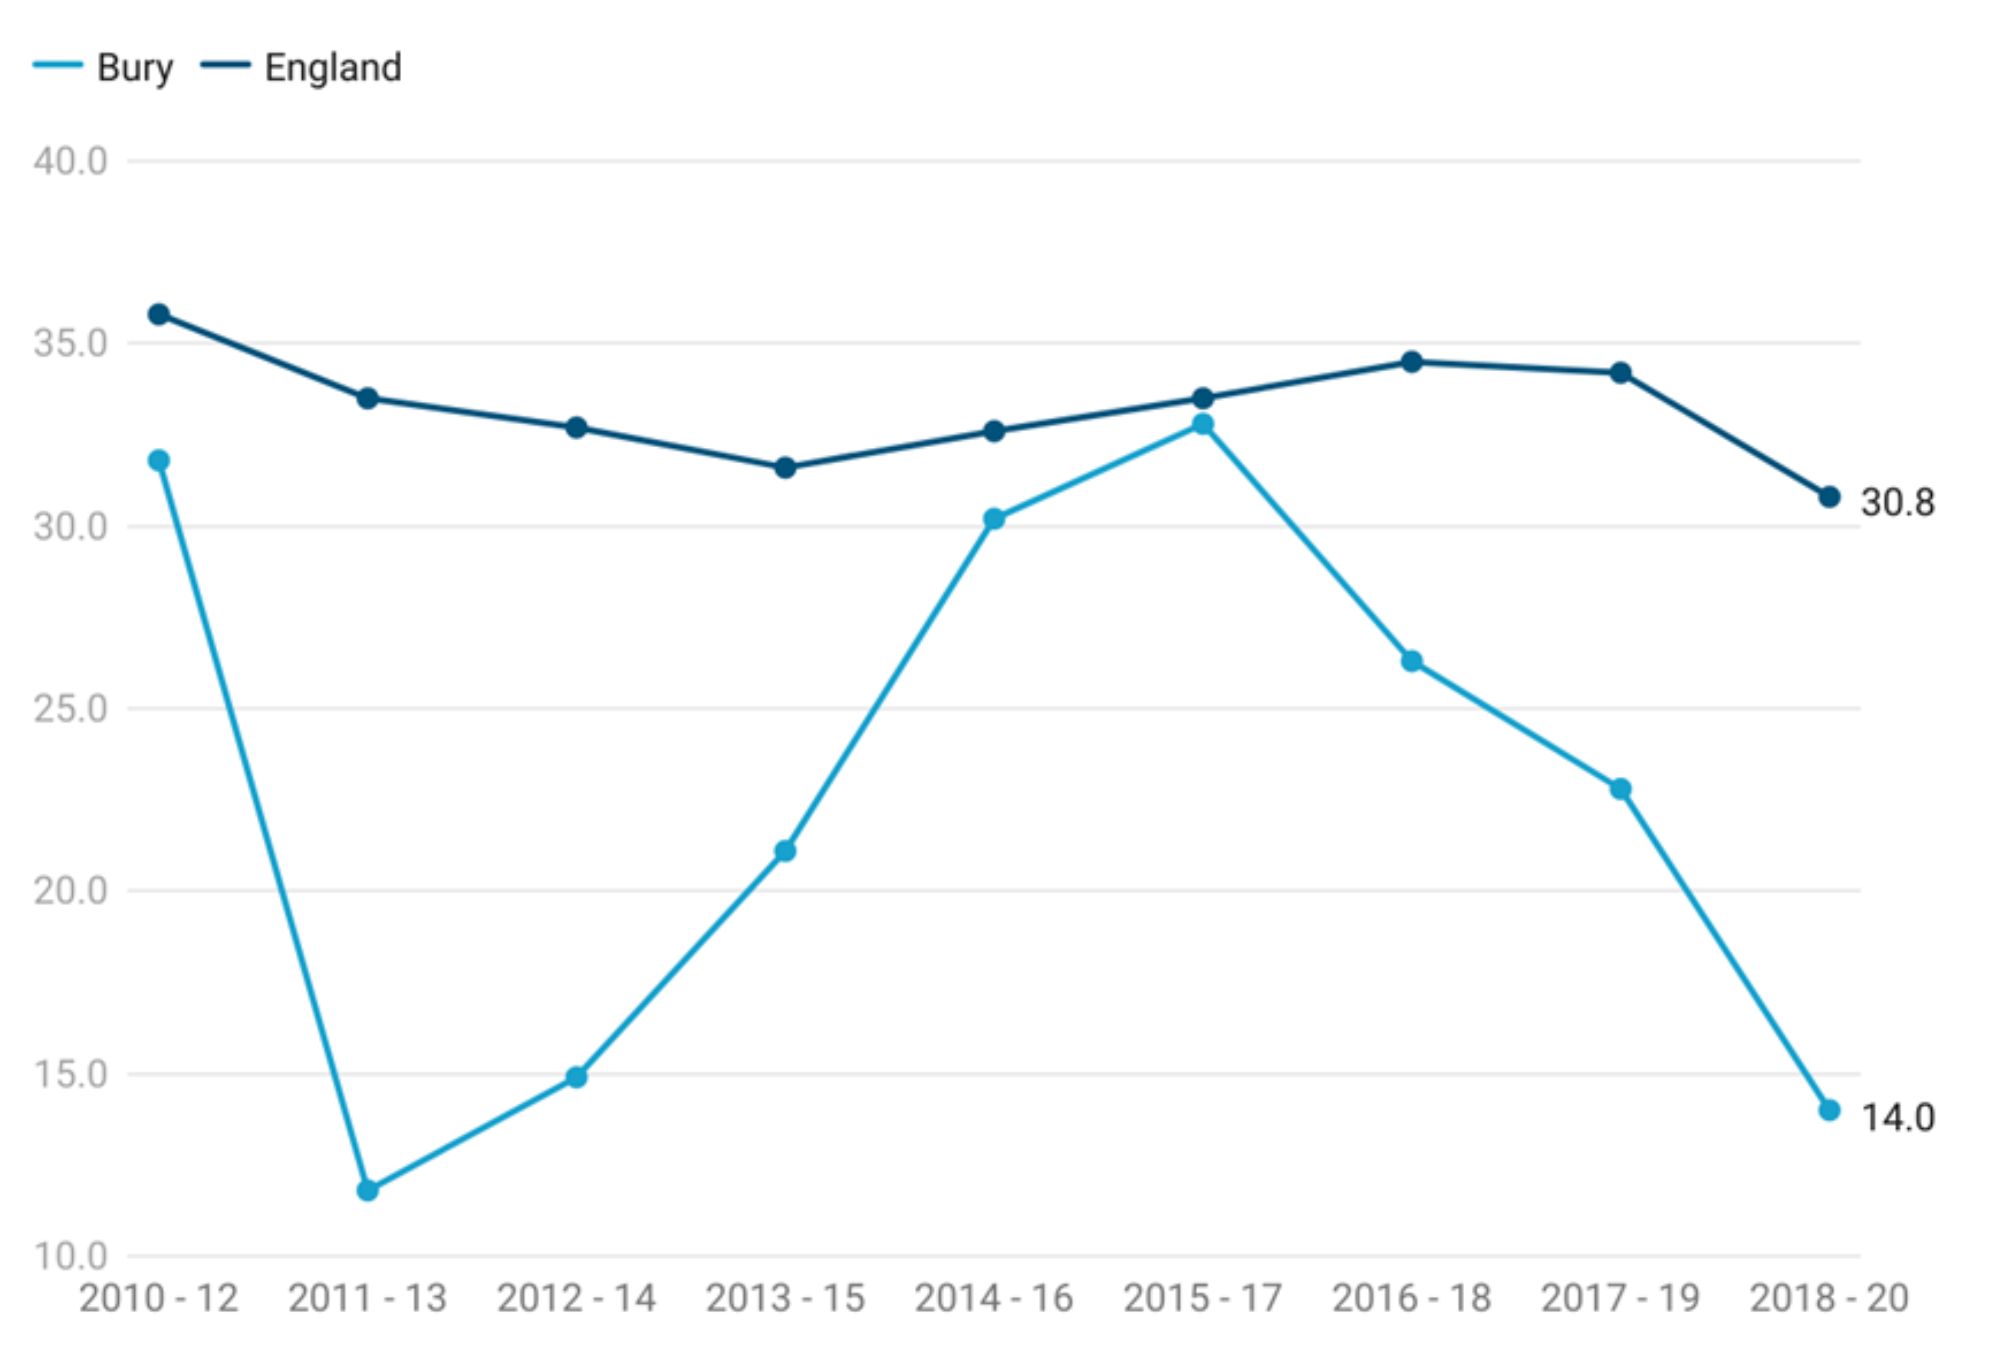
Crude rate for children aged 11-15 years who were killed or seriously injured in road traffic accidents for the period 2018-2020 is 14 per 100,000 population and is statistically similar to England average of 30.8 per 100,000 population (Child and Maternal Health Profile, 2020).
Examining trend data for Bury, crude rate for children aged 11-15 years who were killed or seriously injured fluctuated between 2010-2012 to 2018-2020. In 2010-12, the KSI rate in Bury was 31.8 per 100,000 population decreasing to the lowest rate over the observed period at 11.8 in 2011-13. This was followed by a slight increase to 14.9 in 2012-14 and further increase in rates over the subsequent period to its peak at 32.8 in 2015-17. The rates then declined over the last three measured periods to 14.0 per 100,000 population in 2018-2020.
Looking at the data for England, we observe a different trend in KSI rates for children aged 11-15 years. In 2010-12, the KSI rate in England was 35.8 per 100,000 population, decreasing to 31.6 in 2013-2015. The rates then gradually increased to 34.5 in 2016-2018, followed by a decline to 30.8 in 2018-20.
Comparing Bury with England, KSI in Bury has been consistently lower than England average over the observed period. In 2011-2013, the rate in Bury (11.8) was lower (statistically significant) than England average. For all other periods, the rates were similar (statistically significant) to England average https://fingertips.phe.org.uk/profile/child-health-profiles/data (Figure 8).
Figure 8: Trend in children aged 11-15 years killed and seriously injured crude rate for Bury and England from the period 2008-2010 to 2018-2020
Bury has the lowest rate for children aged 11-15 years who were killed or seriously injured in road traffic accidents in its group of 6 statistical children service neighbours with the highest in Stockton-on-Tees at 54.3 per 100,000 population (Child and Maternal Health, 2020).
There are no data on inequalities for Bury. Examining data by deprivation rate for England suggests increasing rate with increasing levels of deprivation. The 2nd most deprived decile in England has the highest rate (46.6) followed by most deprived decile (37.6) compared with the lowest rate of 20.4 in the least deprived decile for the period 2018-2020 (Child and Maternal Health, 2020). Data by sex for England shows a higher rate in Males (41.5 per 100,000 population) compared with females (19.5 per 100,000 population).
Mental Health
Understanding and addressing mental health in children is crucial for their overall well-being. Various risk factors, including adverse childhood experiences, family dynamics, socioeconomic factors, and access to mental health services, can impact children's mental well-being.
Hospital admissions as a result of self-harm (10-24 years)
Analysing data on hospital admissions for self-harm in children is of utmost importance in this regard. By closely examining such data, valuable insights are gained into the prevalence, patterns, and severity of self-harm behaviours among children. Hospital admissions for self-harm in children have increased in recent years, with admissions for young women being much higher than admissions for young men. With links to other mental health conditions such as depression, the emotional causes of self-harm may require psychological assessment and treatment. This information helps identify high-risk groups, tailor interventions, and provide timely support and prevention strategies. Accurate and comprehensive data on hospital admissions for self-harm in children is essential for shaping effective mental health policies, improving service provision, and promoting the mental well-being of children.
Data for this indicator are presented as directly standardised rate of finished admission episodes for self-harm per 100,000 population aged 10-24 years. Hospital admissions rate as a result of self-harm for Bury during the period 2021/22 was 408.3 per 100,000 population aged 10-24 years, statistically similar to England average of 427.3. There are no trend data comparing these hospital admissions for both Bury and England (Child and Maternal Health, 2022).
In comparison to its 6 neighbouring statistical children services, Bury has the 3rd highest rate of hospital admissions within this age range. The highest rate among Bury neighbours is observed in Sefton, with a rate of 695.5 per 100,000 population 10-24 years of age, while the lowest rate is in Calderdale, at 282.4 per 100,000 population (Child and Maternal Health, 2022).
Data on inequalities in Bury are present by sex only. These indicate significantly higher rates of hospital admissions in females (statistically significant), with a rate of 738.9 per 100,000. On the other hand, males in Bury have a rate of 103.9 per 10,000, which is statistically lower than the England average (Child and Maternal Health, 2022).
Data for England by Sex suggests a similar pattern with higher (statistically significant) hospital admissions rates in females of 711.4 per 100,000 compared to males who have a rate of 153.8 per 100,000 (Child and Maternal Health, 2022).
Generally, higher rates of hospital admissions related to self-harm among females reflects complex emotional and societal realities. Females often find themselves navigating a path that can lead to feelings of intense pressure or distress, sometimes culminating in acts of self-harm. Influences such as societal expectations around appearance and traditional roles can intensify this journey. It's worth noting that females also tend to experience certain mental health challenges, like anxiety and depression, at a higher rate. These conditions are known to increase vulnerability to self-harming behaviours. However, these numbers solely represent hospital admissions and don't necessarily encompass the full spectrum of individuals who self-harm. In fact, males might not always reach out for or receive the help they need as readily.
Examining the data based on levels of deprivation, the lowest rates of admission are in the most deprived decile (391.6) and the highest rate of admissions are in the 5th most deprived (508.7), the third less deprived (479.2) and the least deprived decile (462.4) (Child and Maternal Health, 2022).
Hospital admissions as a result of self-harm (10-14 years)
This indicator is presented as a crude rate of finished admission episodes for self-harm per 100,000 population. Hospital admissions rate as a result of self-harm in 10-14 years for Bury for the period 2021/22 is 233.8 per 100,000 similar (statistically significant) to England average of 307.1 (Child and Maternal Health, 2022). There are no trend data for Bury and England as the trend data are being reviewed by ONS.
Bury has the 4th highest rate for admission episodes of self-harm in its group of 6 statistical children service neighbours with the highest rate in Sefton at 619.7 and lowest in Stockton-on-Tees at 153.1 (Child and Maternal Health, 2022).
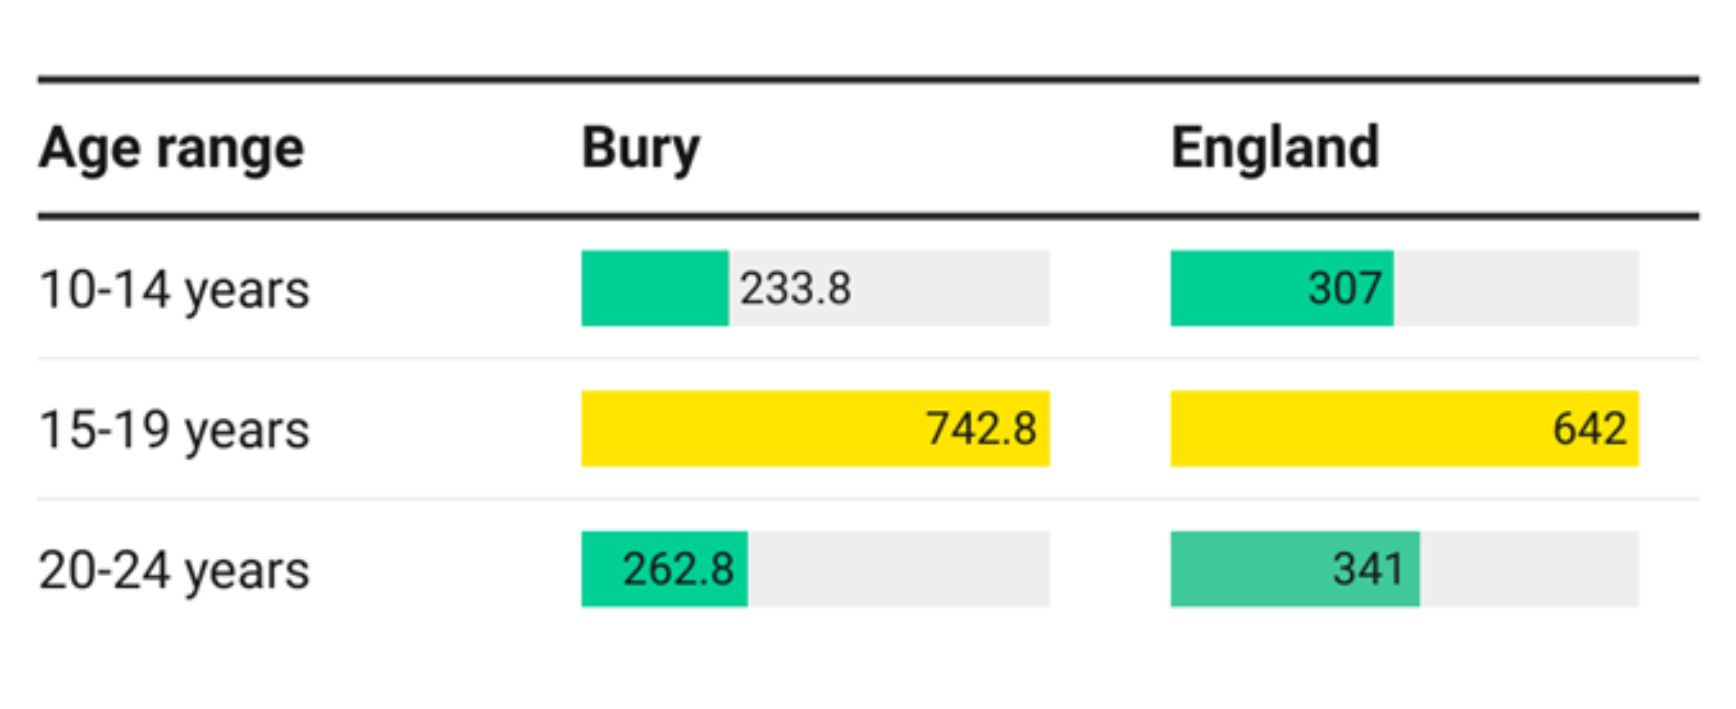
Data on inequalities for Bury are available by age, with lower rates in 10–14 year olds (233.8) and 20-24 year olds (262.8) and average rates (742.8) for 15-19 year olds. Examining data on inequalities for England, a similar pattern is seen by age with lower rates in 10-14 year olds (307) and 20-24 year olds (341) and average rates (642) in 15-19 year olds (Figure 9).
Figure 9: Inequalities in crude rates of finished admission episodes for self-harm per 100,000 population by age in Bury and England
Examining data by deprivation for England shows lower rates of self-harm in the most deprived deciles compared with the least deprived decile. The highest rate is in the fifth more deprived decile (364.6) followed by the fourth less (350.8) and third less (340.4) deprived decile and the lowest rate (270.9) is in the third most deprived decile for 2021/22 (Child and Maternal Health, 2022).
Hospital admissions as a result of self-harm (15-19 years)
This measure is presented as the crude rate of completed admissions for incidents of self-harm per 100,000 individuals in the population. The rate of hospital admissions resulting from self-inflicted harm among individuals aged 15-19 years in Bury during the period 2021/22 stands at 742.8 per 100,000 statistically similar to the average rate of 642 in England (Child and Maternal Health, 2022). Presently, there are lack of available data on trends for both Bury and England, as the data on trends is currently undergoing evaluation by the Office for National Statistics (ONS). Bury has the 2nd highest rate of admission episodes for self-harm in its group of 6 statistical children service neighbours with the highest rate in Sefton at 879.1 and lowest in Calderdale at 423 (Child and Maternal Health, 2022).
Data on inequalities for Bury are available by age and sex. For inequalities by age, please see Figure 9. Data by sex suggests a higher rate (statistically significant) of self-harm in females aged 15-19 years (1386.1) in Bury compared with males (165.8). Examining data on inequalities for England, a similar pattern is seen by sex with significantly higher rates in females (1088.3) compared with males (215.2) (Child and Maternal Health, 2022).
Examining data by deprivation for England shows increasing rates of self-harm by decreasing levels of deprivation overall. However, the highest rate is in the fifth more deprived decile (775.2) followed by the least deprived decile (749.6) and the lowest rate (562.9) is in the most deprived decile for 2021/22 (Child and Maternal Health, 2022).
Hospital admissions for mental health conditions (<18 years of age).
One in ten children aged 5-16 years has a clinically diagnosable mental health problem and, of adults with long-term mental health problems, half will have experienced their first symptoms before the age of 14. Self-harming and substance abuse are known to be much more common in children and young people with mental health disorders – with ten per cent of 15-16 year olds having self-harmed. Failure to treat mental health disorders in children can have a devastating impact on their future, resulting in reduced job and life expectations.
Hospital admissions for mental health conditions are presented as a crude inpatient admission rate for mental health disorders per 100,000 population aged 0-17 years. The crude rate in Bury for 2021/22 was at 91.4, similar to England’s average of 99.8 (Child and Maternal Health, 2022). There are no trend data available for Bury and England.
Bury has the 2nd lowest admission rates from its group of 6 children statistical neighbours with the highest rate in Stockton-on-Tees at 115.8 and lowest in Calderdale at 77.7 (Child and Maternal Health, 2022).
Data on inequalities in Bury are available by Sex only, with higher admission rates in Females (118.1 per 100,000 population aged 0-17 years) compared with Males (44.3 per 100,000 population aged 0-17 years) (Child and Maternal Health, 2022).
England data by Sex shows higher admission rates (statistically significant) in Females at 143.4 compared with Males at 58.1 (Child and Maternal Health, 2022). Examining data by deprivation for England shows increasing rates of hospital admissions for mental health conditions (<18 years) by decreasing levels of deprivation overall. The highest rate is in the second least deprived decile (119.9) followed by the least deprived decile (113.6) and the lowest rate (85.4) is in the most deprived decile for 2021/22 (Child and Maternal Health, 2022).
Hospital admissions as a result of self-harm (15-19 years)
This measure is presented as the crude rate of completed admissions for incidents of self-harm per 100,000 individuals in the population. The rate of hospital admissions resulting from self-inflicted harm among individuals aged 15-19 years in Bury during the period 2021/22 stands at 742.8 per 100,000 statistically similar to the average rate of 642 in England (Child and Maternal Health, 2022). Presently, there are lack of available data on trends for both Bury and England, as the data on trends is currently undergoing evaluation by the Office for National Statistics (ONS). Bury has the 2nd highest rate of admission episodes for self-harm in its group of 6 statistical children service neighbours with the highest rate in Sefton at 879.1 and lowest in Calderdale at 423 (Child and Maternal Health, 2022).
Data on inequalities for Bury are available by age and sex. For inequalities by age, please see Figure 9. Data by sex suggests a higher rate (statistically significant) of self-harm in females aged 15-19 years (1386.1) in Bury compared with males (165.8). Examining data on inequalities for England, a similar pattern is seen by sex with significantly higher rates in females (1088.3) compared with males (215.2) (Child and Maternal Health, 2022).
Examining data by deprivation for England shows increasing rates of self-harm by decreasing levels of deprivation overall. However, the highest rate is in the fifth more deprived decile (775.2) followed by the least deprived decile (749.6) and the lowest rate (562.9) is in the most deprived decile for 2021/22 (Child and Maternal Health, 2022).
Hospital admissions for mental health conditions (<18 years of age)
One in ten children aged 5-16 years has a clinically diagnosable mental health problem and, of adults with long-term mental health problems, half will have experienced their first symptoms before the age of 14. Self-harming and substance abuse are known to be much more common in children and young people with mental health disorders – with ten per cent of 15-16 year olds having self-harmed. Failure to treat mental health disorders in children can have a devastating impact on their future, resulting in reduced job and life expectations.
Hospital admissions for mental health conditions are presented as a crude inpatient admission rate for mental health disorders per 100,000 population aged 0-17 years. The crude rate in Bury for 2021/22 was at 91.4, similar to England’s average of 99.8 (Child and Maternal Health, 2022). There are no trend data available for Bury and England.
Bury has the 2nd lowest admission rates from its group of 6 children statistical neighbours with the highest rate in Stockton-on-Tees at 115.8 and lowest in Calderdale at 77.7 (Child and Maternal Health, 2022).
Data on inequalities in Bury are available by Sex only, with higher admission rates in Females (118.1 per 100,000 population aged 0-17 years) compared with Males (44.3 per 100,000 population aged 0-17 years) (Child and Maternal Health, 2022).
England data by Sex shows higher admission rates (statistically significant) in Females at 143.4 compared with Males at 58.1 (Child and Maternal Health, 2022). Examining data by deprivation for England shows increasing rates of hospital admissions for mental health conditions (<18 years) by decreasing levels of deprivation overall. The highest rate is in the second least deprived decile (119.9) followed by the least deprived decile (113.6) and the lowest rate (85.4) is in the most deprived decile for 2021/22 (Child and Maternal Health, 2022).
Behavioural Risk Factors
To effectively nurture a healthier society, it is essential to address behavioural risk factors within our community. This section presents publicly available information on behavioural risk factors in school-aged children including obesity, physical activity, and substance misuse.
Overweight and Obesity
Overweight and obesity in children, while being behavioural risks, are also a reflection of these wider determinants of health. These determinants shape not only the behavioural risk factors but also underscore the context in which these behaviours are nurtured. The socioeconomic status of a child's household can drive dietary choices, often resulting in reliance on affordable yet calorie-rich and nutrient-poor foodstuffs. This choice is reinforced by the wider food environment, such as the saturation of fast-food outlets. Education - both of the child and within the family - can define the understanding of balanced diets, importance of physical activity, and the implications of excessive screen time. Moreover, the physical environment, or the extent of access to safe outdoor spaces for play and exercise, can substantially shape a child's physical activity levels.
Simultaneously, societal norms and community infrastructures can propel or deter active living. Consequently, overweight and obesity in children, while being behavioural risks, are also a reflection of these wider determinants of health.
Living with excess weight during childhood appears to be linked to lower educational achievement and with a worse state of mental and emotional health, partly as a result of the stigma attached with obesity. The health consequences of childhood obesity include: increased blood lipids, glucose intolerance, Type 2 diabetes, hypertension, increases in liver enzymes associated with fatty liver, exacerbation of conditions such as asthma and psychological problems such as social isolation, low self-esteem, teasing and bullying.
Numerous studies have demonstrated that childhood obesity strongly predicts adult obesity, with obese children and adolescents having a five-fold increased risk of being overweight as adults compared to non-obese individuals. Average life expectancy is decreased by about three years as a result of obesity, and severe obesity can reduce life expectancy as much as by lifelong smoking by up to ten years (Azhar, 2023)
Reception: Prevalence of overweight (including obesity)
This indicator is defined as proportion of children aged 4-5 years classified as overweight or living with obesity. For population monitoring purposes children are classified as overweight (including obesity) if their body mass index (BMI) is on or above the 85th centile of the British 1990 growth reference (UK90) according to age and sex. The population monitoring cut-off points for overweight, and obesity are slightly lower than the clinical cut-off points used to assess individual children, this is to capture those children with an unhealthy BMI for their age and those at risk of moving to an unhealthy BMI.
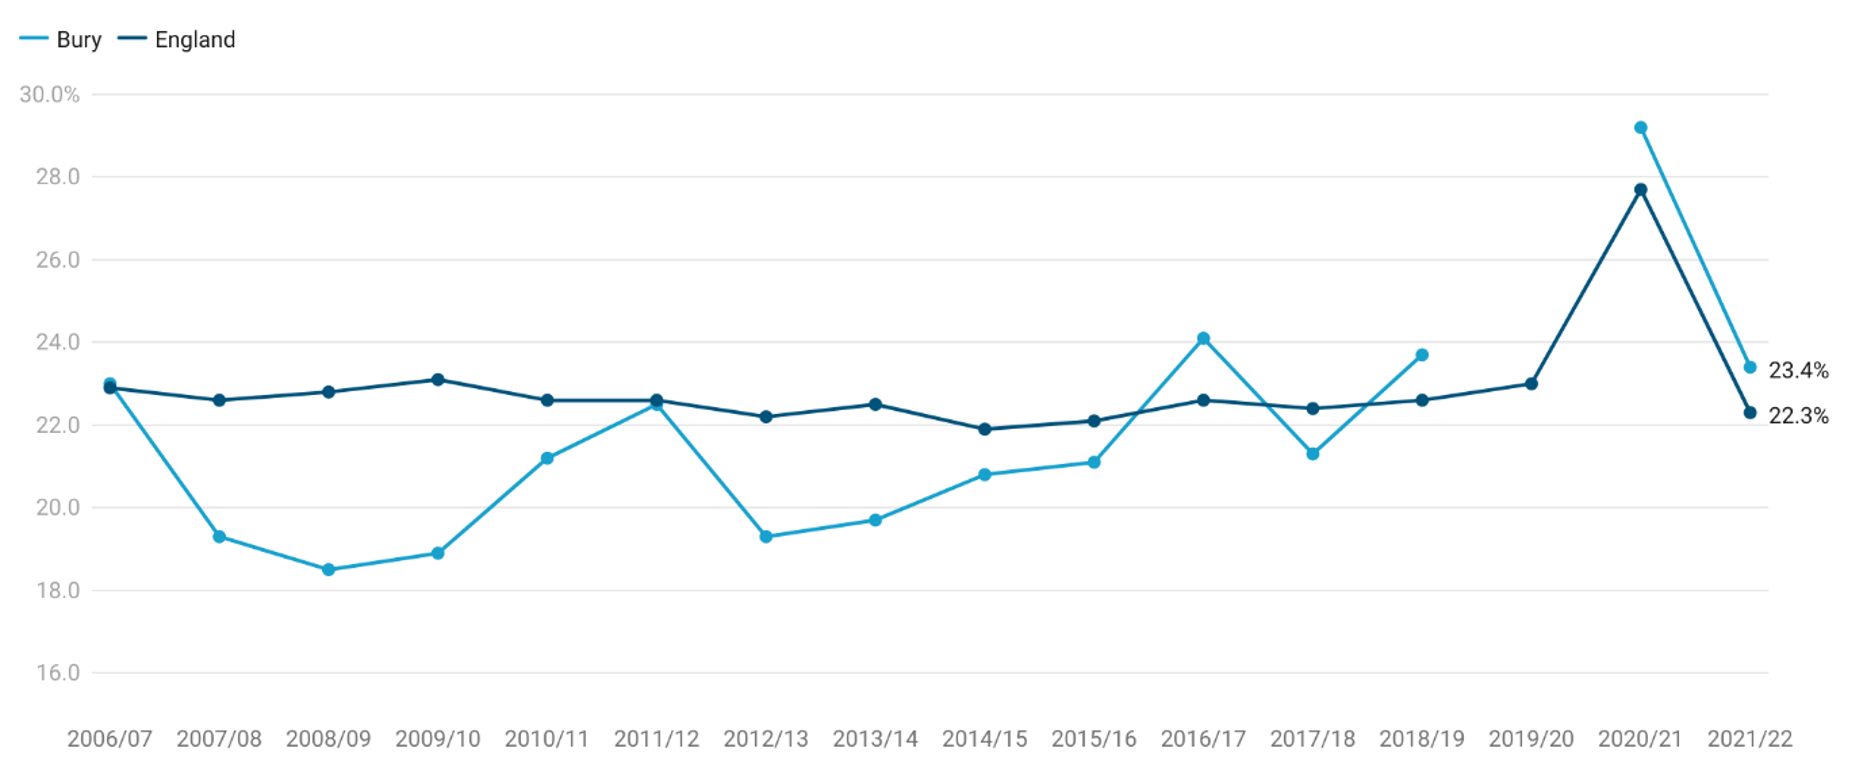
Prevalence of overweight (including obesity) in Bury for the most recent year 2021/22 was 23.4%, statistically similar to England average of 22.3% (Child and Maternal Health, 2022).
Examining trend data for Bury from 2006/07 to 2021/22, prevalence of overweight (including obesity) gradually declined from 23% in 2006/07 to 18.5% in 2008/09. The subsequent years, however, experienced a gradual yet somewhat inconsistent upswing, punctuated by notable peaks at 24.1% in 2016/17 and 29.2% in 2020/21. However, the most recent figure indicates a decline to 23.4% in 2021/22. A data gap exists for Bury in the 2019/20 period.
Data at the national level present a relatively consistent range of approximately 22.6% to 23.1% until 2020/21, when the data reflected a sharp rise to 27.7%. In the latest year of 2021/22, prevalence of obesity (including overweight) decreased to 22.3%. Comparing Bury and England, Bury's rates were lower than England average from 2007/08 to 2015/16 (although statistically significant only for 2007 to 2010 and 2012 to 2014). However, Bury’s prevalence displayed a greater degree of fluctuation over time. Both Bury and England observed marked increases in 2020/21, with Bury showing a surge of 5.5% from the last recorded data in 2018/19, and England recording a 4.7% increase from the previous year. These escalations could be indicative of broader behavioural shifts, potentially prompted by the pandemic in 2020, which might have influenced diet patterns and physical activity levels among children (Child and Maternal Health, 2022).
Figure 10: Trend in prevalence (%) of overweight (including obesity) in Reception for Bury and England from the year 2006/07 to 2021/22
Bury has the 4th highest prevalence (%) of overweight (including obesity) in its group of 6 statistical children service neighbours with the highest percentage in Sefton at 24.9% and lowest in Calderdale at 13.7% (Child and Maternal Health, 2022). There are no data on inequalities at Bury level but England data suggests increasing prevalence of overweight (including obesity) with increasing levels of deprivation. The most deprived decile in England has a prevalence of 26.9% compared with 16.9% in the least deprived decile for the year 2021-22 (Child and Maternal Health, 2022). Data by ethnicity suggests highest prevalence of overweight (including obesity) in Black African (30.3%), followed by any other black background (29.4%) and White and Black African (27.6%). The lowest prevalence by ethnicity is in Chinese (13.6%), Indian (14.4%) and White and Asian (16.2%) (Child and Maternal Health, 2022). By Sex, males have a higher prevalence of 22.5% (statistically significant) compared with females (22%).
Reception: Prevalence of obesity (including severe obesity)
This indicator is defined as the proportion of children aged 4-5 years classified as living with obesity. For population monitoring purposes children are classified as living with obesity if their body mass index (BMI) is on or above the 95th centile of the British 1990 growth reference (UK90) according to age and sex.
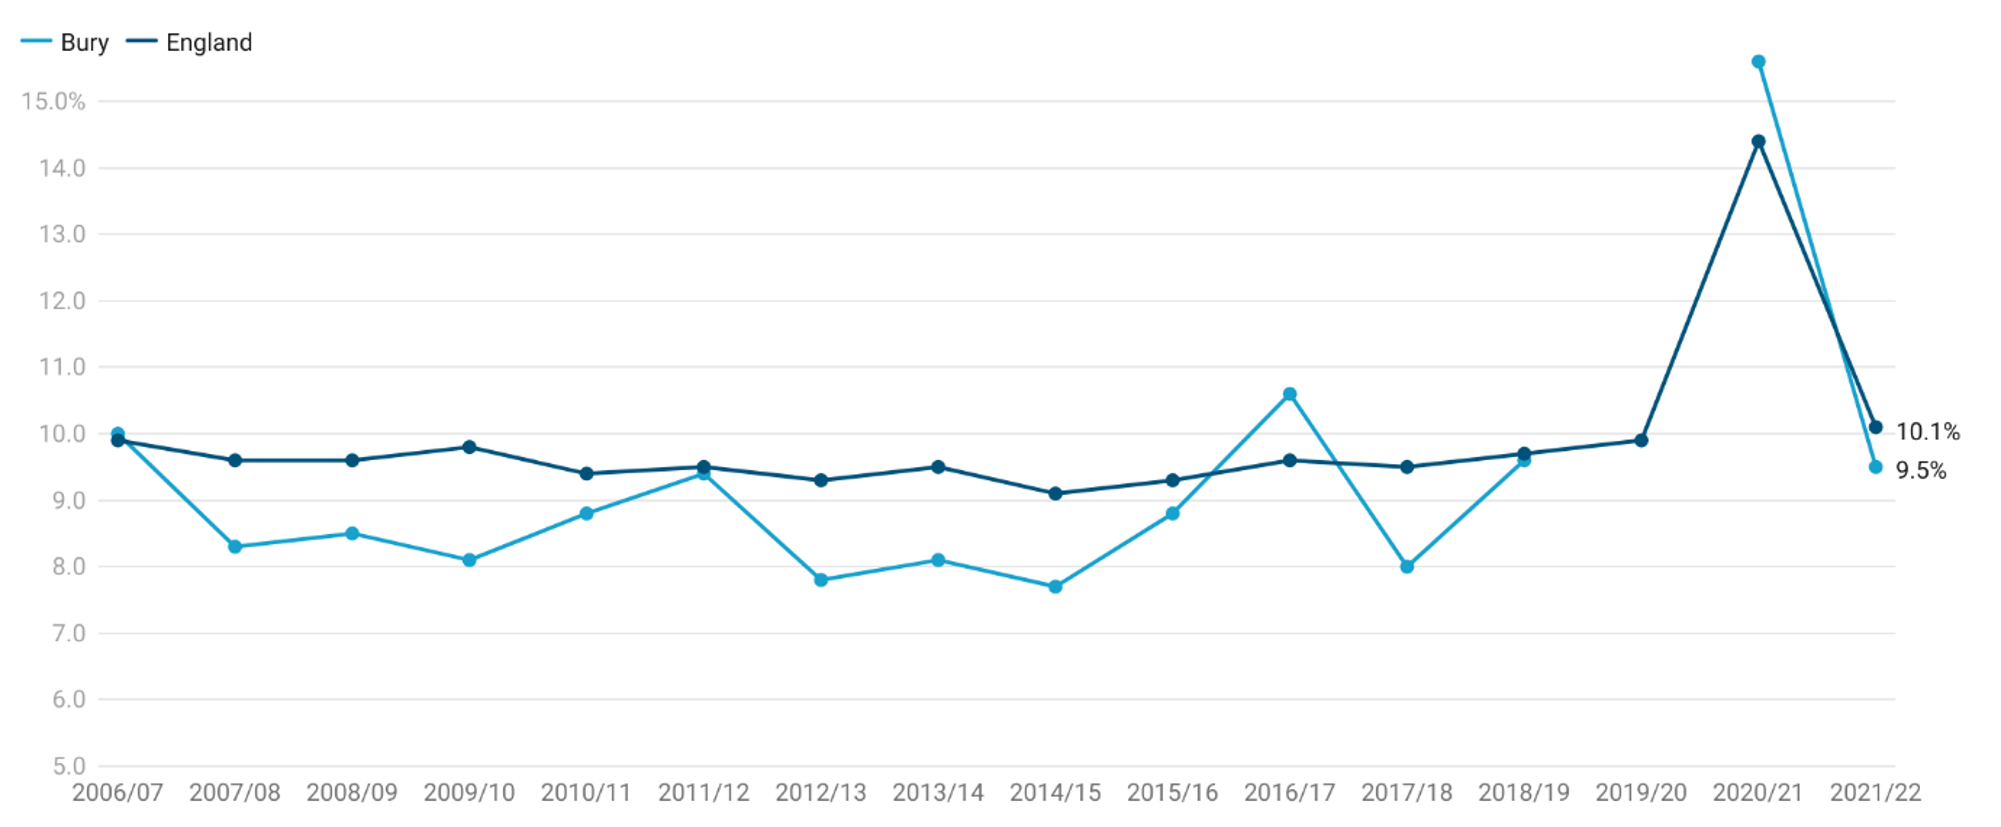
Prevalence of obesity (including severe obesity) in Reception for Bury is 9.5%, statistically similar to England average of 10.1% (Child and Maternal Health, 2022)
Trend data for Bury and England are available from 2006/07 to 2021/22. Obesity (including severe obesity) prevalence in Reception aged children in Bury ranged from 7.7% to 15.6%. Prevalence of obesity declined from 10% in 2006/07 to 7.7% in 2014/15. This was followed by an increase 10.6% in 2016/17 with fluctuations until reaching a peak in 2020/21 to 15.6%, before declining to 9.5% in 2021/22. Obesity in England was fairly stable with slight fluctuation from 2006/07 to 2019/20. In 2020/21, the prevalence increased by 4.5% to 14.4%, before declining to 10.1% in 2021/22.
Drawing a comparison between Bury and England, it is evident that Bury's rates, although initially mirroring the national figures closely, have displayed a greater degree of fluctuation over time. A data gap exists for Bury in the 2019/20 period, a factor to be acknowledged in any interpretation. Both Bury and England observed marked increases in 2020/21, with Bury showing a surge of 5% from the last recorded data in 2018/19, and England recording a 4.5% increase from the previous year (Figure 11) (Child and Maternal Health, 2022)
Figure 11: Trend in prevalence (%) of obesity (including severe obesity) in Reception for Bury and England from the year 2006/07 to 2021/22
Bury has the 4th highest prevalence of obesity (including severe obesity) in Reception in its group of 6 statistical children service neighbours with the highest prevalence in Sefton at 11.3% and lowest in Calderdale at 6.8 (Child and Maternal Health, 2022).
There are no data on inequalities for Bury. Data on inequalities are available at England level by sex, ethnicity and deprivation. The data on obesity prevalence, inclusive of severe obesity cases, within England shows higher prevalence in males at 10.3% (statistically significant), as compared to females at 9.9%. Furthermore, when the data is stratified by ethnicity, the highest prevalence rates are among those from Black African (16.7%), any other black background (16.2%), and White and Black Caribbean (13.8%) ethnic groups. Conversely, the ethnic groups with the lowest prevalence rates include Chinese (4.5%), White and Asian background (7.5%), and Indian (7.6%). Data by deprivation shows a clear deprivation gradient with higher prevalence of obesity in the most deprived decile at 13.6% and lowest in the least deprived decile at 6.2%.
Year 6: Prevalence of overweight (including obesity)
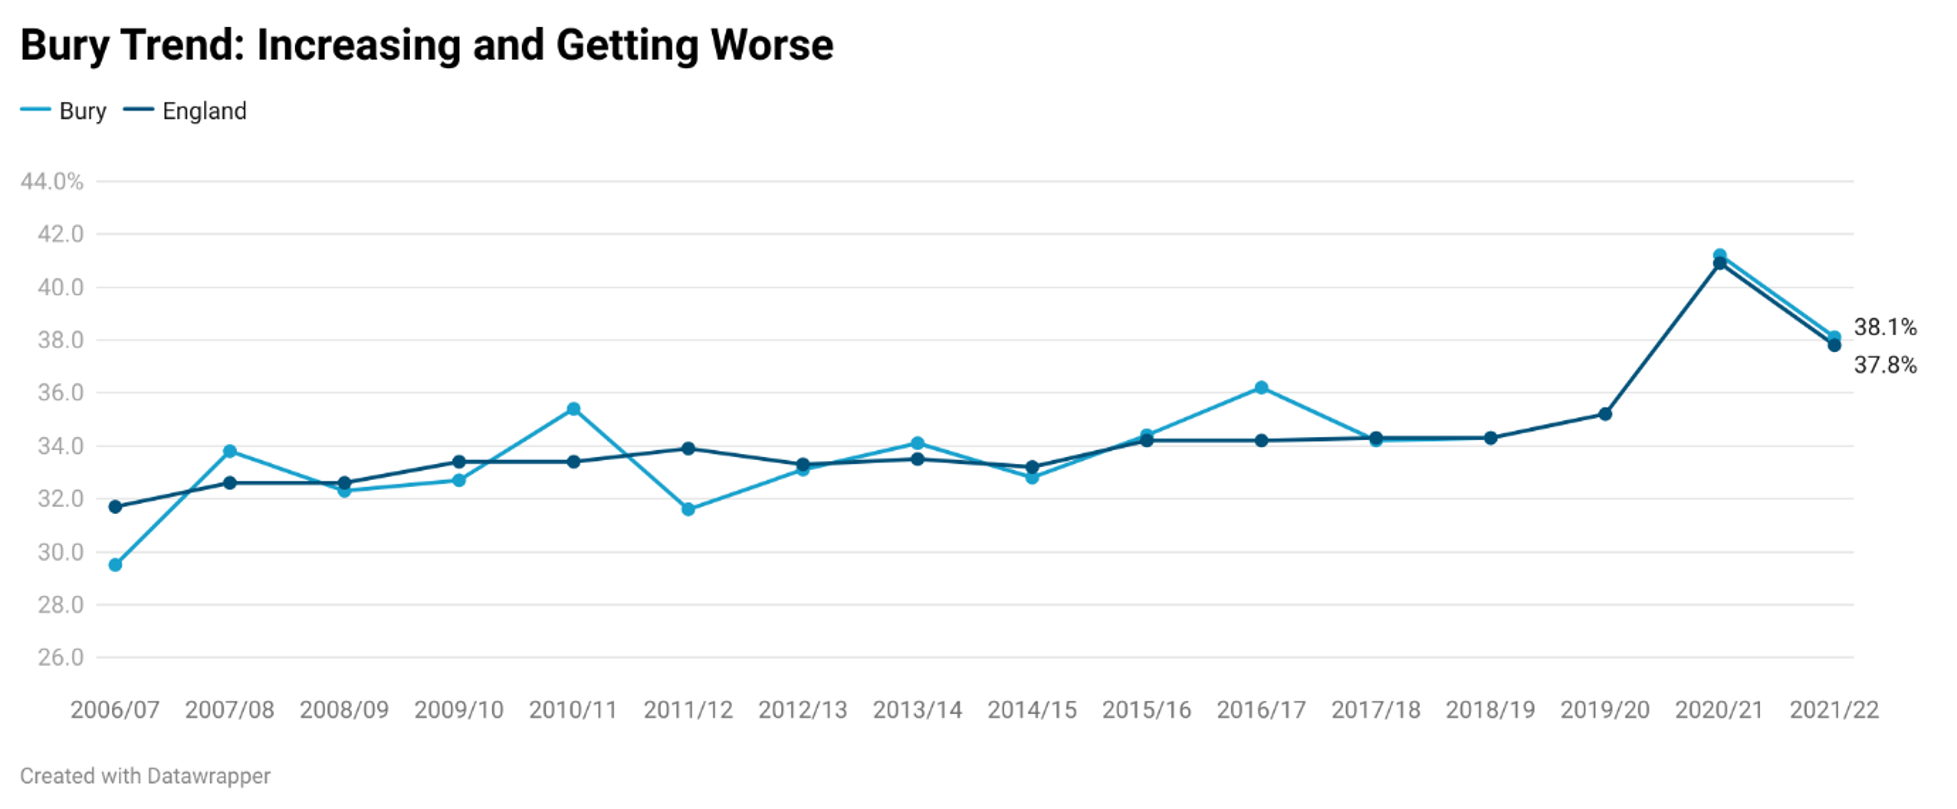
This indicator measures the proportion of children aged 10-11 years classified as overweight or living with obesity. For population monitoring purposes children are classified as overweight (including obesity) if their body mass index (BMI) is on or above the 85th centile of the British 1990 growth reference (UK90) according to age and sex. The population monitoring cut-off points for overweight, and obesity are slightly lower than the clinical cut-off points used to assess individual children, this is to capture those children with an unhealthy BMI for their age and those at risk of moving to an unhealthy BMI. Prevalence of overweight (including obesity) in Bury for the year 2021/22 is 38.1%, statistically similar to England average of 37.8% (Child and Maternal Health, 2022).
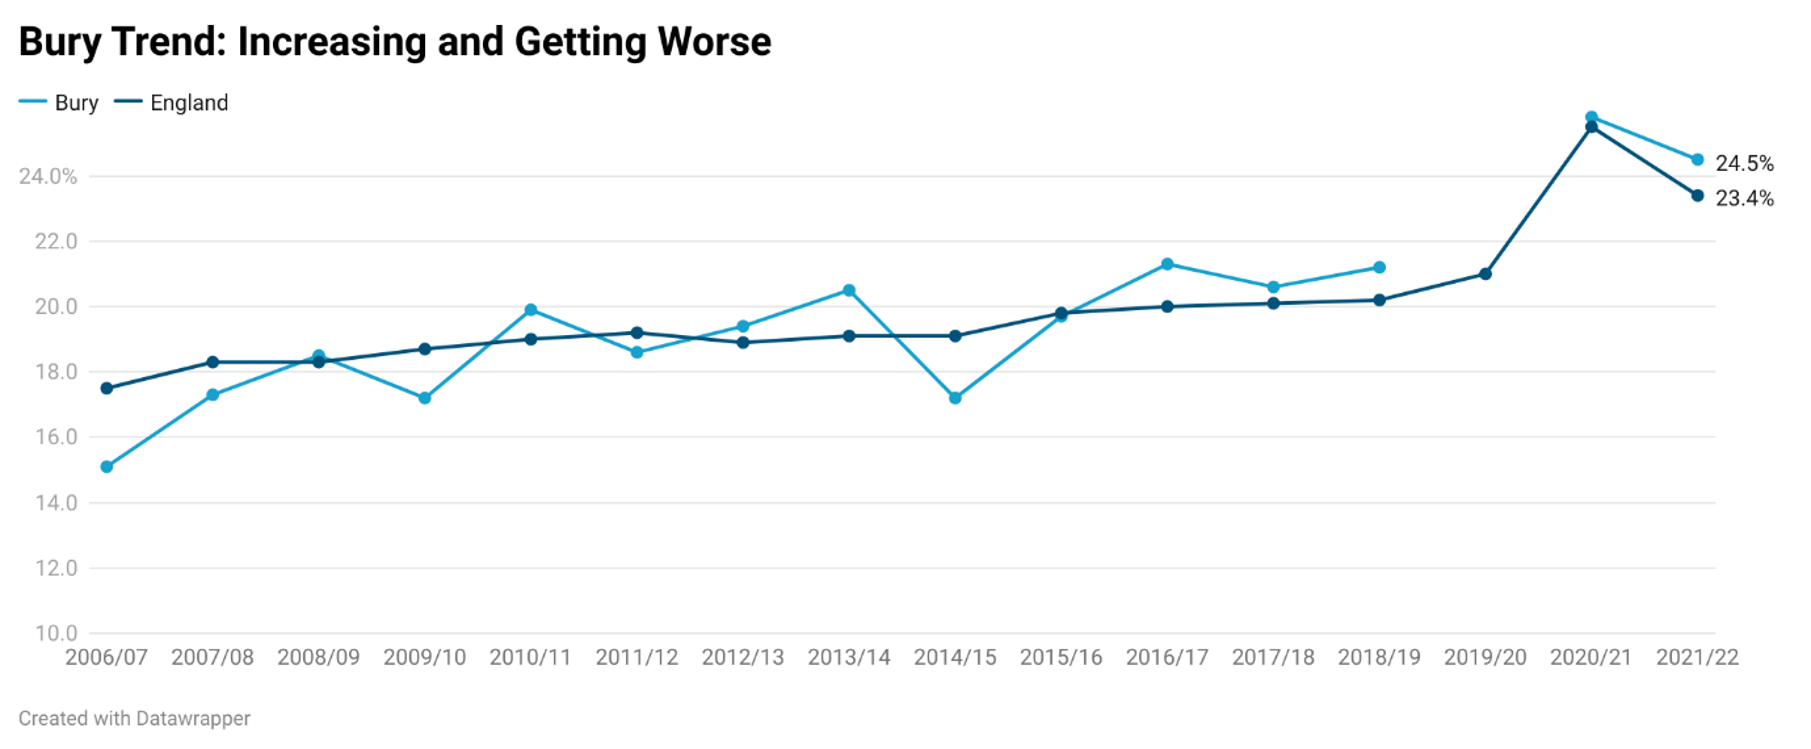
Examining trend data for Bury from 2006/07 to 2021/22, based on the five most recent data points, prevalence of overweight in Bury is increasing and getting worse (statistically significant). Prevalence of overweight (including obesity) gradually increased from 29.5% in 2006/07 to 34.3% in 2018/19. There is a data gap for 2019/20 but data for 2021/21 shows the highest rate for over a decade at 41.2%. The most recent figure indicates a slight decline to 38.1% in 2021/22. A data gap exists for Bury in the 2019/20 period.
Data at the national level follows a similar trend with increasing prevalence from 31.7% in 2006/07 to 35.3% in 2019/20. This was followed by a sharp rise to 40.9% in 2020/21. In the latest year of 2021/22, prevalence of obesity (including overweight) decreased to 37.8% Comparing Bury and England, Bury's rates were fairly similar to England average from 2007/08 to 2021/22, with the exception of 2011/12, where rates in Bury were lower (31.6%) than England average (33.9%) (Figure 12) (Child and Maternal Health, 2022).
Figure 12: Trend in prevalence (%) of overweight (including obesity) in Year 6 for Bury and England from the year 2006/07 to 2021/22
Bury has the 3rd highest prevalence (%) of overweight (including obesity) in its group of 6 statistical children service neighbours with the highest percentage in Stockton-on-Tees at 42% and lowest in Calderdale at 33.6% (Child and Maternal Health, 2022). There are no data on inequalities at Bury level but England data suggests increasing prevalence of overweight (including obesity) with increasing levels of deprivation. The most deprived decile in England has a prevalence of 43.3% compared with 27.7% in the least deprived decile for the year 2021-22 (Child and Maternal Health, 2022). Data by ethnicity suggests highest prevalence of overweight (including obesity) in Black African (49.6%), followed by any other black background (48.9%) and Black Caribbean (48.1%). The lowest prevalence by ethnicity is in Chinese (30.6%), White and Asian (34.2%) and White British (35.5%) (Child and Maternal Health, 2022). By Sex, males have a higher prevalence of 40.7% (statistically significant) compared with females (34.7%).
Year 6: Prevalence of obesity (including severe obesity)
This indicator measures proportion of children aged 10-11 years classified as living with obesity or severe obesity. For population monitoring purposes children are classified as living with obesity if their body mass index (BMI) is on or above the 95th centile of the British 1990 growth reference (UK90) according to age and sex.
Prevalence of obesity (including severe obesity) in Year 6 for Bury is 24.5%, statistically similar to England average of 23.4% (Child and Maternal Health, 2022)
Trend data for Bury and England are available from 2006/07 to 2021/22. Obesity (including severe obesity) prevalence in Year 6 children in Bury ranged from 15.1% to 25.8%. The five most recent data points for Bury suggests an increasing trend in prevalence of obesity and it is getting worse. In 2006/07, prevalence was the lowest at 15.1% lower (statistically significant) than England average of 17.5% during the same period. Prevalence increased gradually until 2013/14, where it was 20.5%. This was followed by a decline to 17.2% in 2013/14, statistically significant and lower than England average of 19.1% during this period. This was followed by another period of gradual increase to 25.8% in 2020/21. No data are available for Bury in 2019/20 (due to COVID-19). The most recent data for 2021/22 suggests a slight decline to 24.5%.
Prevalence of obesity in England increased gradually from 17.5% in 2006/07 to 21% in 2019/20. This was followed by a sharp rise to 25.5% in 2020/21, before declining to 23.4% in 2021/22 (Figure 13).
Figure 13: Trend in prevalence (%) of obesity (including severe obesity) in Year 6 for Bury and England from the year 2006/07 to 2021/22
Drawing a comparison between Bury and England, it is evident that Bury's rates, although initially mirroring the national figures closely, have displayed a greater degree of fluctuation over time. A data gap exists for Bury in the 2019/20 period, a factor to be acknowledged in any interpretation. Both Bury and England observed marked increases in 2020/21, with Bury showing a surge of 4.6% from the last recorded data in 2018/19, and England recording a 4.5% increase from the previous year (Child and Maternal Health, 2022).
Bury has the 2nd highest prevalence of obesity (including severe obesity) in Year 6 in its group of 6 statistical children service neighbours with the highest prevalence in Stockton-on-Tees at 26.3% and lowest in Calderdale at 20% (Child and Maternal Health, 2022).
Percentage of physically active children and young people
The UK Chief Medical Officers' (CMOs') recommend that children and young people (5 to 18 years) are physically active for an average of at least 60 minutes per day across the week. The evidence suggests, however, that a significant proportion of adolescents do not meet this minimum standard. Regular moderate to vigorous physical activity (MVPA) improves health and fitness, strengthens muscles and bones, develops coordination, maintains healthy weight, improves sleep, makes you feel good, builds confidence and social skills and improves concentration and learning.
Good physical activity habits established in childhood and adolescence are also likely to be carried through into adulthood. If we can help children and young people to establish and maintain high volumes of physical activity into adulthood, we will reduce the risk of morbidity and mortality from chronic non communicable diseases later in their lives. The percentage of children (5 to 15) undertaking an average of at least 60 minutes of physical activity per day across the week is a Key Performance Indicator for the Government’s sports strategy ‘Sporting Future: A new strategy for an active nation’.
The Active Lives Children and Young People (CYP) Survey is the only national data source for physical activity levels that is available at local authority level and the data will shape and influence local decision making as well as inform government policy on the Primary PE and Sports Premium, Childhood Obesity Plan and other cross departmental programmes.
Physical activity also forms a key component of the government’s plan for action to significantly reduce childhood obesity by supporting healthier choices, as outlined in ‘Childhood obesity: a plan for action’. One of the main aspects of the plan is to reduce childhood obesity by encouraging primary school children to eat more healthily and stay active.
Physically activity in CYP is measured as percentage of children aged 5 to 16 that meet the UK Chief Medical Officers' (CMOs') recommendations for physical activity (an average of at least 60 minutes moderate to vigorous intensity activity per day across the week).
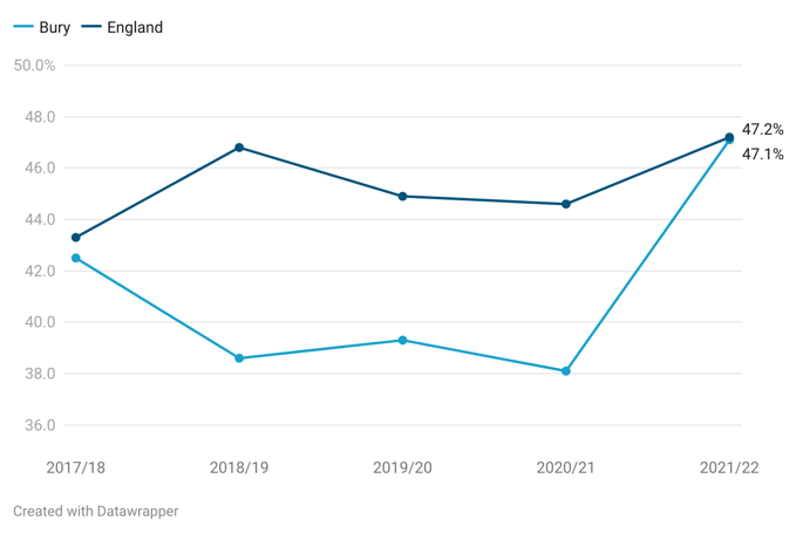
For the year 2021/22, 47.1% of CYP in Bury are physically active, compared with 47.2% in England for the same time period (Child and Maternal Health, 2022).
Examining trend for Bury, proportion of physically active CYP declined from 42.5% in 2017/18 to 38.1% in 2020/21. There was followed by a sharp increase in physical activity in CYP by 9% to 47.1% in 2021/22. England saw fluctuations in physical activity of CYP with proportion increasing from 43.3% in 2017/18 to 46.8% in 2018/19. This was followed by a decline to 44.6% in 2020/21. In the most year 2021/22, England saw an increase by 2.6% to 47.2%.
Figure 14: Trend in proportion of physically active CYP for Bury and England from the year 2017/18 to 2021/22
Bury ranks 4th in its group of 6 children services statistical neighbours with the highest proportion of physically active CYP in Stockton-on-Tees and lowest in Lancashire at 44.6% (Child and Maternal Health, 2022).
There are no data on inequalities for Bury. Data by Sex for England suggests that there are higher (49.8%) proportion (statistically significant compared to Bury average) of males that are physically active compared with females (44.9%). The highest levels of physical activity in CYP in England by ethnicity are in White other (50.4%), followed by White British (49.6%) and the lowest are in Black (40.5%) and Asian (40.8%). Comparing by school year group in England, the highest levels of physical activity is at 52% of Year 1 and 2 children, followed by 48.7% in Year 7-Year 11. The lowest proportion is in Year 3 to Year 6 at 43.1%.
Admission episodes for alcohol-specific conditions - Under 18s
The role of alcohol consumption in hospital admissions and mortality from various health conditions is noteworthy. Estimated annual expenditures stand around £3.5 billion for the NHS and £21 billion for society due to alcohol misuse. The government states that collective efforts are required to mitigate the excessive use of alcohol. In this context, this indicator serves as a pivotal strategy by the government and the Department of Health, to facilitate tangible, data-driven prevention activities at the local level. It aligns with the national goals outlined in the Government's Alcohol Strategy to decrease harm and is monitored through the Responsibility Deal Alcohol Network. Alcohol-related admissions can be curtailed via local strategies aimed at lessening alcohol misuse and related harm.
Public Health England has identified reducing alcohol-related harm as one of its top seven priorities for the upcoming five years, as per the 2014 "Evidence into action" report. The 2013 Sexual Health Framework brings to light several points:
A correlation exists between alcohol-related hospital admissions in both sexes and teenage pregnancy, even after adjusting for the prevalent and significant effect of deprivation, and similar is observed for common sexually transmitted infections.
There is substantiated evidence indicating that alcohol consumption and intoxication can lead to reduced inhibitions and imprudent judgements regarding sexual behaviour, vulnerability, and risky sexual practices, including lack of contraception or condom usage.
Alcohol intake among younger individuals is linked with a higher likelihood of early sexual activity. Alcohol misuse correlates with a higher number of sexual partners and an increase in regrettable or coerced sexual experiences.
Furthermore, alcohol increases the risk of sexual aggression, sexual violence, and sexual victimisation, particularly in women.
This indicator presents admissions to hospital for under 18s where the primary diagnosis or any of the secondary diagnoses are an alcohol-specific (wholly attributable) condition as a crude rate per 100,000 population under 18 years of age (OHID, 2022)
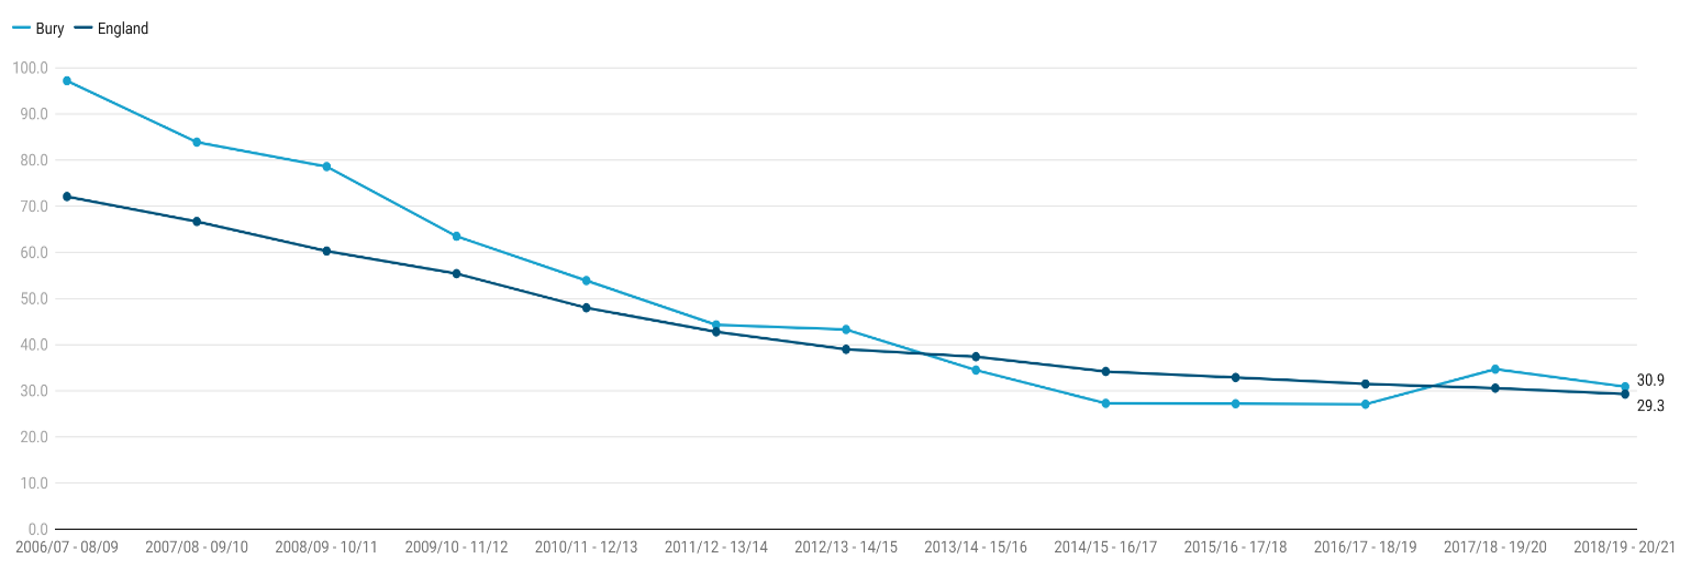
For the year period 2018/19-2020/21, the crude rate of admission episodes for alcohol-specific conditions for CYP under 18 years of age in Bury was 30.9 per 100,000 population aged under 18 years, statistically similar to England average of 29.3 per 100,000 (Child and Maternal Health, 2021).
to 27.1 in 2016/17-2018-2019. This was followed by the first increase for over a decade in 2017/18-2019/20 to 34.7 before declining to 30.9 in the next period. The decline in Bury signals a reduction in alcohol-specific admissions in the area, suggesting possible successful interventions or changes in drinking behaviours amongst this age group.
to 29.3 in 2017/18-2019/20 (Child and Maternal Health, 2021).
In comparing Bury to England, Bury's rates were consistently higher until 2012/13 - 2014/15. Since then, the gap has narrowed, with Bury's rates descending more rapidly than England's. By the 2018/19 - 2020/21 period, the rates are almost identical, demonstrating that the interventions or societal changes in Bury have been effective in reducing their previously higher-than-average rates (Figure 15).
Such trends underscore the importance of continued, and potentially increased, efforts in alcohol education and preventative strategies within both the local and national contexts.
Figure 15: Trend in crude rates of Admission episodes for alcohol-specific conditions rate per 100,000 population under 18 years of age for Bury and England from the year 2018/19 to 2020/21
Bury has the 2nd lowest crude rates of Admission episodes for alcohol-specific conditions rate per 100,000 population under 18 years of age in its group of 6 statistical children service neighbours with the highest rate in Sefton at 71 and lowest in Stockton-on-Tees at 22.8 (Child and Maternal Health, 2021).
Data on inequalities for Bury are available by sex only, with higher rates of admissions in females (31.9) compared with males (22.4). The rates in males and females are statistically similar to Bury average. Data by sex for England suggests that there are higher rates (36.1) of alcohol admissions in females compared with males (22.8). The rates in males are statistically lower and the rates in females are statistically higher than England average. Examining data by deprivation decile for alcohol-specific conditions admission rates in children under 18 years of age, the 5th more (32.4) and 2nd most deprived decile (31.2) in England has the highest rate and lowest rate of 25.6 is in the third more deprived decile for the period 2018/19-2020/21 (Child and Maternal Health, 2021).
Education
Education brings many benefits, for the individual, and for society as a whole. It improves career prospects, boosts the economy and even extends our lifespans. Education is not only about acquiring knowledge and skills but also about personal growth, critical thinking, and social development. Learning ensures that children develop the knowledge and understanding, skills, capabilities and attributes that they need for mental, emotional, social and physical wellbeing now and in the future.
Children with poorer mental health are more likely to have lower educational attainment and there is some evidence to suggest that the highest level of educational qualifications is a significant predictor of wellbeing in adult life; educational qualifications are a determinant of an individual's labour market position, which in turn influences income, housing and other material resources.
Educational attainment is influenced by both the quality of education children receive and their family socio-economic circumstances. Monitoring the achievements and outcomes of education is important for assessing how effective educational systems are and identifying areas that need improvement. Indicators such as educational attainment, resilience, and emotional well-being offer valuable insights into the experiences and outcomes of young people in education. These indicators guide policies and interventions to ensure equitable access to excellent education for all.
Key stage 1 attainment
Key Stage 1 (KS1) refers to the first two years of formal education in primary school, typically covering children aged 5 to 7 years old. It is part of the National Curriculum and serves as a foundational stage in a child's education.
At Key Stage 1, pupils are assessed in core subjects such as English (reading and writing), Mathematics, and science. The assessment process aims to gauge their understanding, skills, and knowledge in these areas. The assessments are conducted through a combination of teacher observations, classroom activities, and formal tests (UK Government, 2022).
Percentage of pupils meeting the expected standard in reading
This indicator presents the percentage of Key Stage 1 pupils meeting the expected standard in reading.
Most recent data from 2022 suggests that 65% of Bury’s Key Stage 1 pupils meet the expected standard in reading, similar to NW average (65%) but lower (statistically significant) than England average (67%).
The percentage of Key Stage 1 pupils in Bury meeting the expected standard in reading was 72.4% in 2016/17, increasing slightly to 73% in 2017/18 and remaining relatively stable at 72.9% in 2018/19. This was followed by a slight decrease to 72% in 2019/20 and a more significant decline to 65% in 2021/22. In England as a whole, the percentage of pupils meeting the expected standard in reading was 74.0% in 2016/17. This increased to 75.5% in 2017/18 and 75.4% in 2018/19, followed by a slight decrease to 74.9% in 2019/20. In 2021/22 there was a sharp decline to 67%. With the exception of the period 2016/17, where the percentage was statistically similar to England average, the percentage of Key Stage 1 meeting the expected standard in reading in Bury remained below England average from 2017/18 to 2021/22. Trend for Bury based on the 5 most recent data points could not be calculated (Figure 16).
Figure 16: Trend in percentage (%) of Key Stage 1 pupils meeting the expected standard in reading for Bury and England from the period 2016/17 to 2021/22
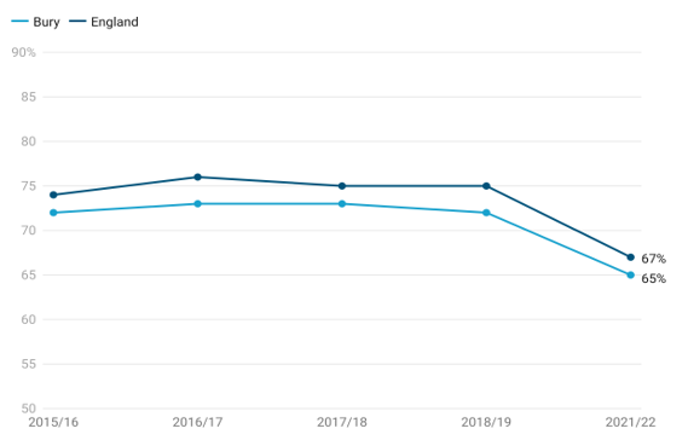
Bury has the 2nd lowest Key Stage 1 pupils who meet the expected standard in reading in its group of 6 statistical children service neighbours with the highest percentage in Stockport at 68% and lowest in Lancashire at 64% (Child and Maternal Health, 2022).
Data on inequalities for Bury are available by ethnic groups, first language status, eligibility for free school meals and sex.
Analysis of data by ethnic groups reveals that the proportion of Key Stage 1 pupils meeting the expected standard in reading varies among different ethnic groups. Black (51%) and Asian (54%) ethnic groups have the lowest proportion (statistically significant when compared to Bury average) of Key Stage 1 pupils meeting the expected standard in reading and the highest proportion (but statistically similar compared to Bury average) are in Other ethnicity (77%), Mixed (71%) and White (67%).
Inequalities are also observed by first language status of Key Stage 1, with those whose first language is not English having the lowest proportion of 58% (statistically lower than the Bury average) meeting the expected standard in reading. In contrast, pupils whose first language is English have a higher proportion of 66% meeting the expected standard.
Data by free school meals eligibility suggests that only 51% of Key Stage 1 children eligible for free school meals (statistically lower than Bury average) meet the expected standard of reading compared with 69% (statistically higher than Bury average) of children who are not eligible for free school meals (Figure 17).
Figure 17: Inequalities in percentage (%) of Key Stage 1 pupils meeting the expected standard in reading for Bury by free school meals eligibility for the period 2021/22
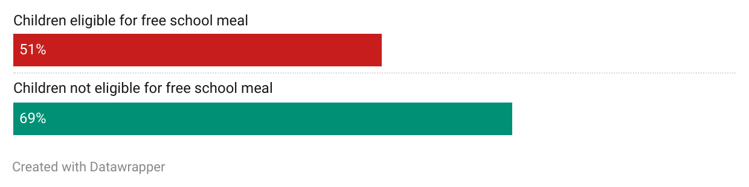
Data by sex suggests that a slightly higher proportion of females (66%) in Bury meet the expected standard of reading at Key Stage 1 compared with males (63%).
Data for England are also available by ethnic groups, first language status, eligibility for free school meals and sex.
Analysis of data for England by ethnic groups reveals that the proportion of Key Stage 1 pupils meeting the expected standard in reading varies among different ethnic groups. Unknown (48%) and Other ethnic group (59%) have the lowest proportion (statistically significant when compared to England average) of Key Stage 1 pupils meeting the expected standard in reading and the highest proportion (statistically significant compared to England average) are in Mixed (70%) and Asian (69%) ethnic groups.
Inequalities are also observed by first language status of Key Stage 1 pupils, with those whose first language is not English have a statistically lower proportion of 64% (statistically significant) meeting the expected standard in reading. In contrast, pupils whose first language is English have a higher proportion of 68% (statistically significant) meeting the expected standard.
Data by free school meals eligibility suggests that only 51% of Key Stage 1 children eligible for free school meals (statistically lower than England average) meet the expected standard of reading compared with 72% (statistically higher than England average) of children who are not eligible for free school meals. Data by sex suggests that a slightly higher proportion of females (71%) meet the expected standard of reading at Key Stage 1 compared with males (63%).
Percentage of pupils meeting the expected standard in writing
This indicator presents the percentage of Key Stage 1 pupils meeting the expected standard in writing.
Most recent data from 2022 suggests that 55% of Bury’s Key Stage 1 pupils meet the expected standard in writing, similar to NW average (55%) but lower (statistically significant) than England average (58%).
In Bury, the percentage of Key Stage 1 pupils meeting the expected standard in writing was 63.5% in 2016/17. This increased to 66.4% in 2017/18 and further to 67.4% in 2018/19. There was a slight decrease to 66.5% in 2019/20, followed by a more significant decline to 55.0% in 2021/22. In England, the percentage of Key Stage 1 pupils meeting the expected standard in writing was slightly higher than Bury throughout the specified years. It was 65.5% in 2016/17, increased to 68.2% in 2017/18, and further to 69.9% in 2018/19. There was a slight decrease to 69.2% in 2019/20, followed by a sharp decline to 58.0% in 2021/22.
With the exception of the period 2017/18, where the percentage was statistically similar to England average, the percentage of Key Stage 1 meeting the expected standard in writing in Bury remained below England average from 2017/18 to 2021/22. Trend for Bury based on the 5 most recent data points could not be calculated (Figure 18).
Figure 18: Trend in percentage (%) of Key Stage 1 pupils meeting the expected standard in writing for Bury and England from the period 2016/17 to 2021/22
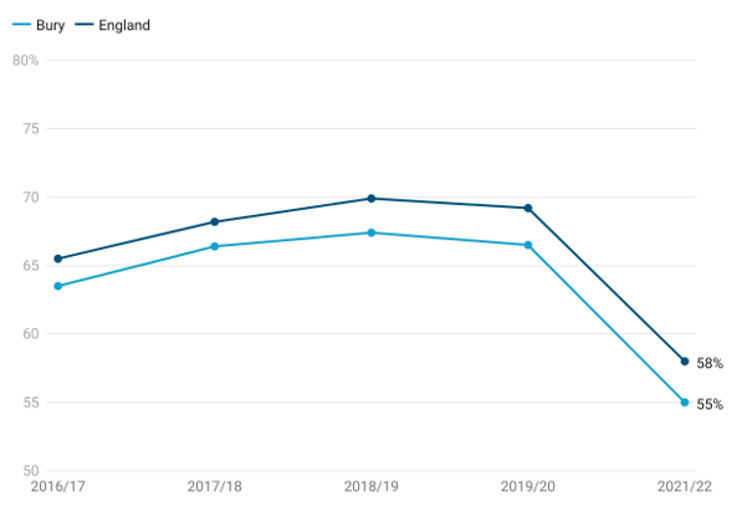
Bury has the 2nd lowest Key Stage 1 pupils meet the expected standard in writing in its group of 6 statistical children service neighbours with the highest percentage in Stockton-on-Tees at 62% and lowest in Sefton at 54% (Child and Maternal Health, 2022).
Data on inequalities for Bury are available by ethnic groups, first language status, eligibility for free school meals and sex.
Analysis of data by ethnic groups reveals that the proportion of Key Stage 1 pupils meeting the expected standard in writing varies among different ethnic groups. Black (46%) and Asian (48%) ethnic groups have the lowest proportion of Key Stage 1 pupils meeting the expected standard in writing and the highest proportion (but statistically similar compared to Bury average) are in Other ethnicity (63%), Mixed (61%) and White (57%).
Inequalities are also observed by first language status of Key Stage 1 pupils, with those whose first language is not English having the lowest proportion of 49% (statistically lower than the Bury average) meeting the expected standard in writing. In contrast, pupils whose first language is English have a higher proportion of 57% meeting the expected standard.
Data by free school meals eligibility suggests that only 44% of Key Stage 1 children eligible for free school meals (statistically lower than Bury average) meet the expected standard of writing compared with 59% (statistically higher than Bury average) of children who are not eligible for free school meals (Figure 19).
Figure 19: Inequalities in percentage (%) of Key Stage 1 pupils meeting the expected standard in writing for Bury by free school meals eligibility for the period 2021/22
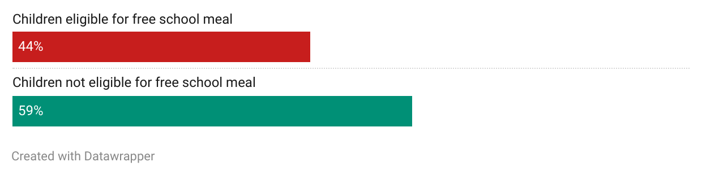
Data by sex suggests that a slightly higher proportion of females (60%) in Bury meet the expected standard of writing at Key Stage 1 compared with males (51%).
Data for England are also available by ethnic groups, first language status, eligibility for free school meals and sex.
Analysis of data for England by ethnic groups reveals that the proportion of Key Stage 1 pupils meeting the expected standard in writing varies among different ethnic groups. Unknown (40%) and Other ethnic group (52%) have the lowest proportion (statistically significant when compared to England average) of Key Stage 1 pupils meeting the expected standard in writing and the highest proportion (statistically significant compared to England average) are in Asian (62%) and Mixed (60%) ethnic groups.
Inequalities are also observed by first language status of Key Stage 1, with those whose first language is not English have a statistically lower proportion of 57% meeting the expected standard in writing. In contrast, pupils whose first language is English have a higher proportion of 58% (statistically significant) meeting the expected standard.
Data by eligibility for free school meals suggests that only 41% of Key Stage 1 children eligible for free school meals (statistically lower than England average) meet the expected standard of writing compared with 63% (statistically higher than England average) of children who are not eligible for free school meals. Data by sex suggests that a higher proportion of females (64%) meet the expected standard of reading at Key Stage 1 compared with males (52%).
Percentage of pupils meeting the expected standard in maths
This indicator presents the percentage of Key Stage 1 pupils meeting the expected standard in maths.
Most recent data from 2022 suggests that 66% of Bury’s Key Stage 1 pupils meet the expected standard in maths, similar to NW average of 66% and statistically similar to England average of 68%.
In Bury, the percentage of Key Stage 1 pupils meeting the expected standard in maths was 71.0% in 2016/17. It increased to 72.2% in 2017/18 and further to 73.7% in 2018/19. The percentage remained relatively stable at 73.5% in 2019/20, followed by a decline to 66.0% in 2021/22. In comparison, the percentage of Key Stage 1 pupils meeting the expected standard in maths was consistently slightly higher in England. It stood at 72.6% in 2016/17, increased to 75.1% in 2017/18, and further to 76.1% in 2018/19. There was a slight decrease to 75.6% in 2019/20, followed by a decline to 68.0% in 2021/22. With the exception of the period 2016/17 and 2021/22, where the percentage was statistically similar to England average, the percentage of Key Stage 1 meeting the expected standard in reading in Bury remained below England average from 2017/18 to 2019/20. Trend for Bury based on the 5 most recent data points could not be calculated (Figure 20).
Figure 20: Trend in percentage (%) of Key Stage 1 pupils meeting the expected standard in maths for Bury and England from the period 2016/17 to 2021/22
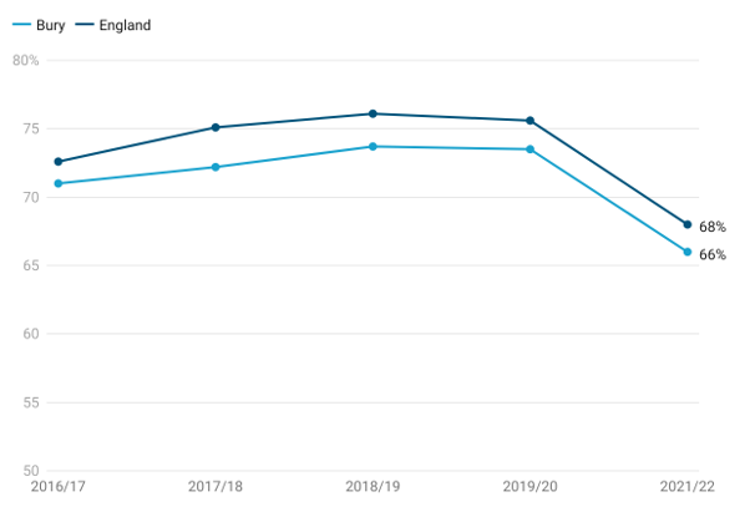
Bury has the 2nd lowest Key Stage 1 pupils meet the expected standard in maths in its group of 6 statistical children service neighbours with the highest percentage in Stockton-on-Tees at 70% and lowest in Lancashire at 65% (Child and Maternal Health, 2022).
Data on inequalities for Bury are available by ethnic groups, first language status, eligibility for free school meals and sex.
Analysis of data by ethnic groups reveals that the proportion of Key Stage 1 pupils meeting the expected standard in maths varies among different ethnic groups. Black (50%) and Asian (58%) ethnic groups have the lowest proportion (statistically significant when compared to Bury average) of Key Stage 1 pupils meeting the expected standard in maths and the highest proportion (but statistically similar compared to Bury average) are in Other ethnicity (77%), Mixed (72%) and White (68%).
Inequalities are also observed by first language status of Key Stage 1, with those whose first language is not English having the lowest proportion of 62% (statistically similar to Bury average) meeting the expected standard in maths. In contrast, pupils whose first language is English have a higher proportion of 67% meeting the expected standard.
Data by free school meals eligibility suggests that only 51% of Key Stage 1 children eligible for free school meals (statistically lower than Bury average) meet the expected standard of maths compared with 71% (statistically higher than Bury average) of children who are not eligible for free school meals (Figure 21).
Figure 21: Inequalities in percentage (%) of Key Stage 1 pupils meeting the expected standard in maths for Bury by free school meals eligibility for the period 2021/22
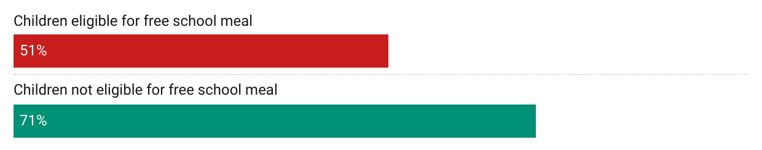
Data by sex suggests that a slightly higher proportion of males (69%) in Bury meet the expected standard of maths at Key Stage 1 compared with females (63%).
Data for England are also available by ethnic groups, first language status, eligibility for free school meals and sex.
Analysis of data for England by ethnic groups reveals that the proportion of Key Stage 1 pupils meeting the expected standard in maths varies among different ethnic groups. Unknown (50%) and Other ethnic group (62%) have the lowest proportion (statistically significant when compared to England average) of Key Stage 1 pupils meeting the expected standard in maths and the highest proportion (statistically significant compared to England average) are in Asian (71%) and Mixed (69%) ethnic groups.
Inequalities are also observed by first language status of Key Stage 1 pupils, with those whose first language is not English have a statistically lower proportion of 67% (statistically significant) meeting the expected standard in maths. In contrast, pupils whose first language is English have a slightly higher proportion of 68% (statistically significant) meeting the expected standard.
Data by free school meals eligibility suggests that only 52% of Key Stage 1 children eligible for free school meals (statistically lower than England average) meet the expected standard of maths compared with 73% (statistically higher than England average) of children who are not eligible for free school meals. Data by sex suggests that a slightly higher proportion of males (68%) meet the expected standard of maths at Key Stage 1 (statistically similar to England average) compared with females (67%).
Percentage of pupils meeting the expected standard in science
This indicator presents the percentage of Key Stage 1 pupils meeting the expected standard in science.
Most recent data from 2022 suggests that 76% of Bury’s Key Stage 1 pupils meet the expected standard in science, slightly higher than NW average of 75% and statistically similar to England average of 77%.
The percentage of Key Stage 1 pupils in Bury meeting the expected standard in Science was 80.6% in 2016/17. It slightly decreased to 80.4% in 2017/18, followed by a small increase to 81.1% in 2018/19. The percentage remained relatively stable at 80.6% in 2019/20, but there was a decline to 76.0% in 2021/22. In England, the percentage of Key Stage 1 pupils meeting the expected standard in Science was slightly higher than in Bury throughout the specified years. It was 81.8% in 2016/17, increased to 82.6% in 2017/18, and further to 82.8% in 2018/19. There was a slight decrease to 82.3% in 2019/20, followed by a decline to 77.0% in 2021/22.
With the exception of the period 2016/17 and 2021/22, where the percentage was statistically similar to England average, the percentage of Key Stage 1 meeting the expected standard in science in Bury remained below England average from 2017/18 to 2019/20. Trend for Bury based on the 5 most recent data points could not be calculated (Figure 22).
Figure 22: Trend in percentage (%) of Key Stage 1 pupils meeting the expected standard in science for Bury and England from the period 2016/17 to 2021/22

Bury has the 3rd lowest Key Stage 1 pupils meet the expected standard in science in its group of 6 statistical children service neighbours with the highest percentage in Stockport at 80% and lowest in Calderdale at 75% (Child and Maternal Health, 2022).
Data on inequalities for Bury are available by ethnic groups, first language status, eligibility for free school meals and sex.
Analysis of data by ethnic groups reveals that the proportion of Key Stage 1 pupils meeting the expected standard in science varies among different ethnic groups. Black (55%) and Asian (62%) ethnic groups have the lowest proportion of Key Stage 1 pupils meeting the expected standard in science and the highest proportion are in Other ethnicity (83%) and White and Mixed (both at 83%).
Inequalities are also observed by first language status, of Key Stage 1 pupils, with those whose first language is not English having the lowest proportion of 66% (statistically lower than the Bury average) meeting the expected standard in science. In contrast, pupils whose first language is English have a higher proportion of 79% meeting the expected standard (statistically higher than Bury average).
Data by free school meals eligibility suggests that only 64% of Key Stage 1 children eligible for free school meals (statistically lower than Bury average) meet the expected standard of science compared with 80% (statistically higher than Bury average) of children who are not eligible for free school meals (Figure 23).
Figure 23: Inequalities in percentage (%) of Key Stage 1 pupils meeting the expected standard in science for Bury by free school meals eligibility for the period 2021/22
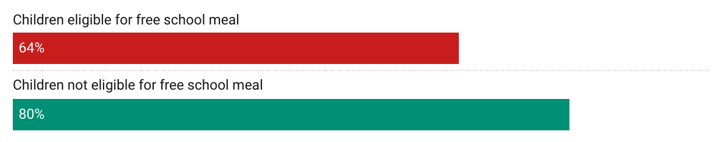
Data by sex suggests that a slightly higher proportion of females (77%) in Bury meet the expected standard in science at Key Stage 1 compared with males (76%).
Data for England are also available by ethnic groups, first language status, eligibility for free school meals and sex.
Analysis of data for England by ethnic groups reveals that the proportion of Key Stage 1 pupils meeting the expected standard in science varies among different ethnic groups. Unknown (56%) and Other ethnic group (67%) have the lowest proportion (statistically significant when compared to England average) of Key Stage 1 pupils meeting the expected standard in science and the highest proportion (statistically significant compared to England average) are in White and Mixed (both at 80%) ethnic groups.
Inequalities are also observed by first language status of Key Stage 1, with those whose first language is not English have a statistically lower proportion of 72% meeting the expected standard in science. In contrast, pupils whose first language is English have a higher proportion of 79% (statistically significant) meeting the expected standard.
Data by eligibility for free school meals suggests that only 63% of Key Stage 1 children eligible for free school meals (statistically lower than England average) meet the expected standard in science compared with 82% (statistically higher than England average) of children who are not eligible for free school meals. Data by sex suggests that a higher proportion of females (79%) meet the expected standard of science at Key Stage 1 compared with males (75%).
Key Stage 2 attainment
Key Stage 2 (KS2) is the key stage taught in Years 3 to 6, when children are between 7 and 11 years-old. It is a critical phase where pupils build upon the foundational skills and knowledge acquired in Key Stage 1 and further develop their abilities across various subjects.
National standardised assessments are carried out at end of Key Stage 2 to evaluate pupils' academic progress and attainment in core subjects such as English (including reading and writing) and Mathematics.
Key stage 2 pupils meeting the expected standard in reading, writing, and maths
This indicator provides information about the percentage of pupils at the end of Key Stage 2 who have achieved the expected level of proficiency in these three core subjects. This indicator is important as it helps evaluate the effectiveness of the education system in preparing pupils for their transition to secondary school.
Most recent data from 2020 suggests that 64.8% of Bury’s Key Stage 2 pupils meet the expected standard in reading, writing, and maths, similar to NW average (64.6%) and statistically similar to England average (65.3%).
The percentage of Key Stage 2 pupils in Bury meeting the expected standard in reading, writing, and maths has generally increased over the specified years. It was 54.6% in 2016/17 and increased to 63.3% in 2017/18. There was a slight increase to 63.8% in 2018/19 and a further increase to 64.8% in 2019/20. In England, the percentage of Key Stage 2 pupils meeting the expected standard in reading, writing, and maths has also shown an overall increase. It was slightly lower than Bury in 2016/17, at 53.8%, but increased to 61.6% in 2017/18. There was a slight increase to 64.9% in 2018/19 and a further increase to 65.3% in 2019/20. The percentage of Key Stage 2 pupils in Bury meeting the expected standard in reading, writing, and maths has remained similar to England average from 2016/17 to 2019/20. Trend for Bury based on the 5 most recent data points could not be calculated (Figure 24).
Figure 24: Trend in percentage (%) of Key Stage 2 pupils in Bury meeting the expected standard in reading, writing, and maths for Bury and England from the period 2016/17 to 2019/20
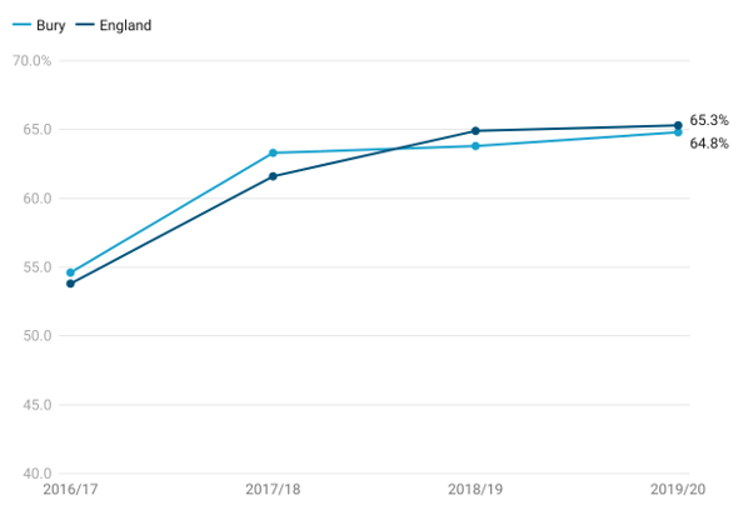
Bury has the 3rd lowest proportion of Key Stage 2 pupils in Bury meeting the expected standard in reading, writing, and maths in its group of 6 statistical children service neighbours with the highest percentage in Stockton-on-Tees at 70.8% and lowest in Sefton at 63.4% (Child and Maternal Health, 2022).
Data on inequalities for Bury are available by sex only. Data by sex suggests that a higher proportion of females (69.8%) in Bury meet the expected standard in reading, writing, and maths at Key Stage 2 compared with males (59.8%).
Data for England are also available by levels of deprivation and sex only.
There is a clear gradient by levels of deprivation with 62.8% of Key Stage 2 pupils in the most deprived decile meeting the expected standard in reading, writing, and maths compared with 67.9% in the least deprived decile. Similar to Bury, data by sex suggests that a higher proportion of females (70.2%) in England meet the expected standard in reading, writing, and maths at Key Stage 2 compared with males (60.7%).
Key stage 4
Key Stage 4 is the final stage of secondary education in England, typically covering Years 10 and 11, when pupils are aged 14 to 16. It is a crucial phase as it culminates in the completion of compulsory education and leads to various pathways for further education, training, or employment.
Average Attainment 8 score
Academic achievement of pupils at the end of Key Stage 4 is measured as the Average Attainment 8 score. The Attainment 8 score is calculated by assigning point values to a pupil's performance in a set of specified subjects, including English (both literature and language), mathematics, sciences, humanities, and additional optional subjects. Each subject is assigned a point value based on the pupil's attainment level, with higher scores awarded for higher grades. The points achieved across all subjects are then added up to calculate the Attainment 8 score.
This indicator is presented as a mean score for all pupils in state-funded schools, based on local authority of pupil residence.
Most recent data from 2021/22 suggests that the Average Attainment 8 score in Bury was 46.9 similar to NW average (47.1) and slightly lower than England average of 48.7 (Child and Maternal Health, 2022).
Please note that Trend chart is not displayed as the way GCSE grades were awarded changed during the Covid-19 pandemic. 2020 and 2021 data should not be directly compared to attainment data from previous years for the purposes of measuring changes in pupil performance.
Bury has the 3rd lowest Average Attainment 8 score in its group of 6 statistical children service neighbours with the highest score in Stockport at 51.1 and lowest in Sefton at 46.4 (Child and Maternal Health, 2022).
No data on inequalities are available for Bury and England.
Average Attainment 8 Score among children eligible for Free School Meals (FSM)
Educational attainment is influenced by both the quality of education children receive and their family socio-economic circumstances. Being on FSM is considered to be a good indicator of socio-economic disadvantage in the UK. Children and young people in the UK are usually eligible for free school meals (FSM) if their parents or carers are on a low income or in receipt of certain benefits. Children on FSM perform relatively poorly compared to counterparts without FSM.
This indicator shows attainment for children eligible for free school meals. Attainment is measured via the Average Attainment 8 measure which is calculated by adding together a pupil’s highest scores across eight government approved qualifications (including GCSEs and EBacc). Pupils are at the end of Key Stage 4 (KS4) aged 15-16 and attending state-funded schools in England.
Most recent data from 2020/21 suggests that the Average Attainment 8 score of children on FSM in Bury is in the 2nd worst quintile in England at 37.9, with the England average at 39.1 (Child and Maternal Health, 2021).
No trend data are available for Bury and England.
No inequalities data are present for Bury and England. However, this indicator should be compared to the general Average Attainment 8 Score. As pupils eligible for FSM fall under the definition of disadvantage, it can be useful to see the difference in average scores and whether local and national policy interventions are having an impact (Figure 25).
Figure 25: Inequalities in Average 8 Attainment scores comparing Average 8 Attainment score with Average 8 Attainment score among children eligible for FSM for the period 2020/21
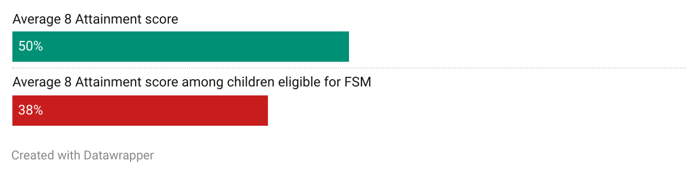
Average Attainment 8 score- Children in care
This indicator presents Key Stage 4 Average Attainment 8 score of children looked after continuously for at least twelve months at the end of March (excluding children in respite care). Only children who have been matched to Key Stage 4 data are included. This is the amended version of Key Stage 4 data. Includes entries and achievements for these pupils in previous academic years.
Most recent data from 2021/22 suggests that the Average Attainment 8 score of children in care in Bury is in the 2nd worst quintile in England at 22.2, with the England average at 23.2 (Child and Maternal Health, 2022).
Please note that Trend chart is not displayed as the way GCSE grades were awarded changed during the Covid-19 pandemic. 2020 and 2021 data should not be directly compared to attainment data from previous years for the purposes of measuring changes in pupil performance.
Bury has the 3rd lowest Average Attainment 8 score in its group of 6 statistical children service neighbours with the highest score in Stockton-on-Tees at 25.5 and lowest in Sefton at 19.2 (Child and Maternal Health, 2022).
Educational Inclusion and Engagement
Promoting educational inclusion and engagement is crucial for ensuring every child and young person has equal opportunities to thrive academically and socially. It involves creating an inclusive educational environment that supports the needs of all pupils, including those facing challenges or barriers to learning. By addressing factors like disengagement, absence, and exclusion, we can strive for educational equity and positive outcomes for every pupil. This set of indicators provides valuable insights into different aspects of educational inclusion and engagement, such as the rate of 16 to 17 year olds not in education, employment, or training (NEET) or whose activity is unknown, the rates of persistent absentees and fixed-term exclusions in both primary and secondary schools, pupil absence rates, and the percentage of pupils with special educational needs (SEN). These indicators help identify areas where support and interventions may be needed, guiding efforts to ensure all pupils have access to quality education and the opportunity to reach their full potential.
Pupil absence
Parents of children of compulsory school age (aged 5 to 15 at the start of the school year) have a legal responsibility to ensure that their children receive a suitable education through regular attendance at school or other approved educational arrangements. The educational attainment of children is influenced by multiple factors, including the quality of education they receive and their family's socio-economic circumstances. Educational qualifications play a significant role in determining an individual's position in the labour market, which, in turn, impacts their income, housing situation, and access to material resources. These factors are interconnected with health outcomes and disparities.
Promoting improved attendance in schools is a crucial aspect of the government's commitment to enhancing social mobility and ensuring that every child can fulfil their potential. Enhancing school attendance requires a collaborative effort among various services that engage with young people to establish local priorities and strategies. The indicator related to school attendance can serve as a valuable tool in achieving this objective and fostering positive educational outcomes for children and young individuals.
Percentage of pupil absence
This indicator is measured as a percentage of half days missed by pupils due to overall absence (including authorised and unauthorised absence).
Most recent data on pupil absence in Bury are available for year 2020/21, where pupil absence is at 4.6%, statistically similar to England average of 4.6%.
The percentage of pupil absence has shown some variations over the years. Pupil absence ranged from the highest at 5.2% in 2010/11 to 3.9% in 2013/14. From 2010/11, pupil absence decreased to 4.4% in 2011/12. There was a slight increase to 4.6% in 2012/13, followed by a decrease to 3.9% in 2013/14. The percentage remained relatively stable in subsequent years, with slight fluctuations between 4.2% and 4.9%. The percentage of pupil absence in England has followed a similar pattern. It was slightly higher than Bury in 2010/11 at 5.8% but decreased to 5.1% in 2011/12. There was a slight increase to 5.3% in 2012/13, followed by a decrease to 4.5% in 2013/14. The percentage remained relatively stable in subsequent years, with slight fluctuations between 4.6% and 4.8%.
Pupil absence in Bury remained lower than England average (statistically significant) from 2010/11 to 2015/16 and similar to England average from 2016/17 to 2020/21.
Trend data based on the 5 most recent data points show no significant change in trend (Figure 26).
Figure 26: Trend in percentage (%) of pupil absence for Bury and England from the period 2010/11 to 2020/21
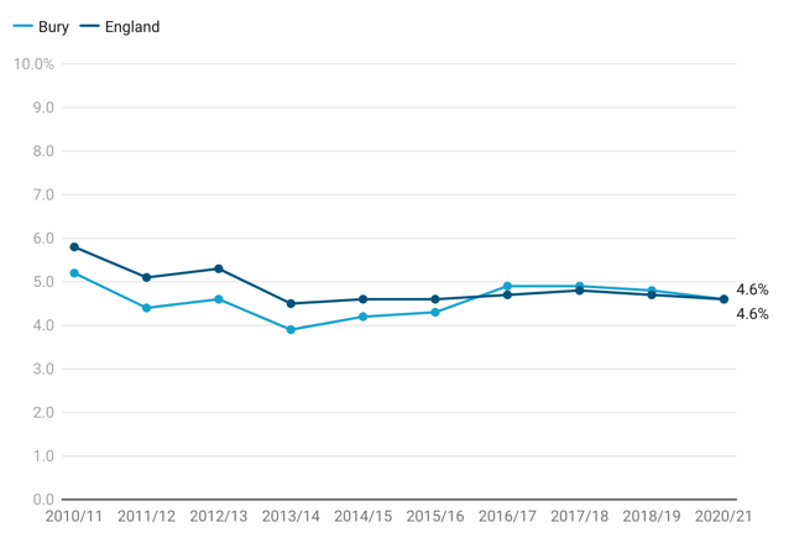
Bury has the 2nd highest proportion of pupil absence in its group of 6 statistical children service neighbours with the highest percentage in Sefton at 5% and lowest in Lancashire at 4.4% (Child and Maternal Health, 2021).
There are no data on inequalities in Bury.
Data for England are available by ethnic groups, deprivation and sex.
Analysis of data for England by ethnic groups reveals Chinese (2.1) and Black (3.8) ethnic groups have the lowest proportion (statistically significant when compared to England average) of pupil absence and the highest proportion (statistically significant compared to England average) are in Unknown (6%) and Mixed (5%) ethnic groups.
Inequalities are also observed by levels of deprivation with the increasing pupil absence with increasing levels of deprivation. The highest pupil absence is in the most deprived decile (5.7%) and lowest in the least deprived decile (3.8%)
Data by sex suggests that pupil absence is slightly higher in males (4.7%) compared with males (4.5%).
Persistent absentees - Primary school
This indicator is defined as the percentage of primary school enrolments classed as persistent absentees (defined as missing 10% or more of possible sessions).
Persistent absentees in primary school in Bury based on the most recent data from 2020/21 was at 8.1%, lower (statistically significant) than England average of 8.8%.
The percentage of persistent absentees in primary schools in Bury fluctuated over the years, with the highest percentage of 9.0% in 2016/17, and the lowest percentage of 7.0% in 2014/15. The percentage of persistent absentees was 7.0% in 2014/15 and increased slightly to 7.1% in 2015/16. However, there was a notable increase to 9.0% in 2016/17, indicating a significant rise in persistent absenteeism. The percentage then decreased to 8.8% in 2017/18, followed by a further decrease to 7.7% in 2018/19. In 2020/21, the percentage increased slightly to 8.1%.
Similarly, the percentage of persistent absentees in primary schools in England fluctuated over the years, with the highest percentage of 8.8% in 2020/21 and the lowest percentage of 8.2% in 2015/16. In England, the percentage of persistent absentees was 8.4% in 2014/15 and decreased to 8.2% in 2015/16. It remained relatively stable between 8.3% and 8.8% in the subsequent years. The percentage increased to 8.8% in 2020/21.
Bury generally had a lower percentage of persistent absentees compared to the national average for England, and the range of values in Bury was slightly wider. Bury’s values were lower than England average from 2014/15 to 2015/16 and 2018/19 to 2020/21. Throughout this period, Bury value was higher than England average for the period 2016/17 only. Both Bury and England experienced fluctuations in the percentage of persistent absentees over the years, but Bury's range of values was higher, suggesting a larger difference between the lowest and highest percentages (Figure 27).
Figure 27: Trend in persistent absentees - Primary school (%) for Bury and England from the period 2014/15 to 2020/21
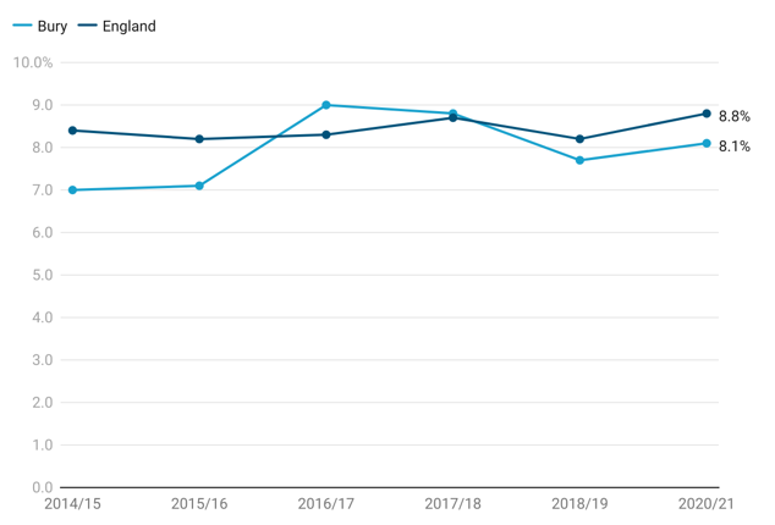
Bury has the 3rd highest proportion of persistent absentees in primary school in its group of 6 statistical children service neighbours with the highest percentage in Stockport at 10.3% and lowest in Stockton-on-Tees at 7.4% (Child and Maternal Health, 2021).
There are no data on inequalities in Bury.
Data for England are available by ethnic groups, deprivation, special educational needs (SEN) status, first language status, eligibility for free school meals and sex.
Analysis of data for England by ethnic groups reveals Chinese (4%) and Black (7.8) ethnic groups have the lowest proportion (statistically significant when compared to England average) of persistent pupil absentees in primary school and the highest proportion (statistically significant compared to England average) are in Unknown (14.1%) and Mixed (10.5%) ethnic groups.
Inequalities are also observed by levels of deprivation with the increasing persistent pupil absentees in primary school with increasing levels of deprivation. The highest pupil absentees are in the most deprived decile (11.8%) and lowest in the least deprived decile (6.9%).
Children with SEN support (14.6%) and EHCP or statement (32.2%) have a higher proportion of pupil absentees (statistically significant compared to England average). Children with no identified SEN have a lower proportion of pupil absentees (statistically significant) at 6.8%.
Inequalities are also observed by first language status in proportion of persistent absentees in primary school with those whose first language is not English have a statistically higher proportion (9.7%) of absenteeism in primary school. In contrast, pupils whose first language is English have a lower proportion of absenteeism at 8.5% (statistically significant).
Data by eligibility for free school meals suggests that 18.5% of children eligible for free school meals (statistically worse than England average) have persistent absenteeism in primary school compared with 5.5% (statistically better than England average) of children who are not eligible for free school meals.
Data by sex suggests that persistent absenteeism in primary school is slightly higher in males (9.2%) compared with females (8.3%).
Persistent absentees – Secondary school
This indicator is defined as percentage of secondary school enrolments classed as persistent absentees (defined as missing 10% or more of possible sessions).
Persistent absentees in secondary schools in Bury based on the most recent data from 2020/21 was at 15.3%, higher but not statistically different than the England average of 14.8%.
The percentage of persistent absentees in secondary schools in Bury showed some fluctuations over the years. The lowest percentage was 11.9% in 2015/16, and the highest percentage was 16.0% in 2016/17. The percentage then decreased to 15.3% in 2017/18 and remained relatively stable at that level in the subsequent years, with 15.0% in 2018/19 and 15.3% in 2020/21.
Similarly, the percentage of persistent absentees in secondary schools in England also showed minor fluctuations. The lowest percentage was 13.1% in 2015/16, and the highest percentage was 13.9% in 2017/18. The percentage then decreased slightly to 13.7% in 2018/19, before increasing to 14.8% in 2020/21.
Bury generally had a slightly higher percentage of persistent absentees compared to the national average for England. Bury's values were lower than the England average from 2014/15 to 2015/16 and remained higher than England average from 2016/17 to 2018/19 (Figure 28).
Figure 28: Trend in persistent absentees - Secondary school (%) for Bury and England from the period 2014/15 to 2020/21
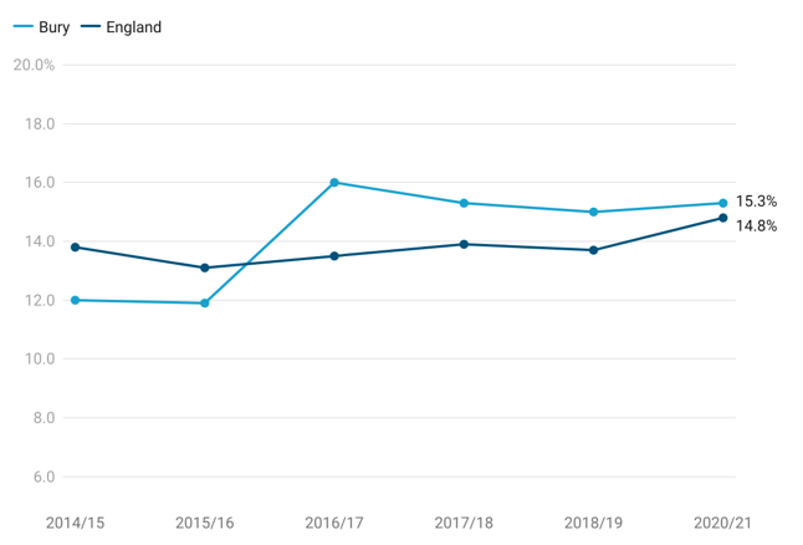
Bury ranked 4th highest in terms of the proportion of persistent absentees in secondary schools among its group of 6 statistical children service neighbours. The highest percentage was observed in Calderdale at 16.4%, while the lowest was in Stockport at 12.9%.
Inequalities in persistent absenteeism were observed across different factors. Analysis of data for England by ethnic groups revealed that the Chinese (4%) and Black (9.9%) ethnic groups had the lowest proportion of persistent absenteeism in secondary schools (statistically significant when compared to the England average), while the Unknown (20.3%) and Mixed (16.7%) ethnic groups had the highest proportion (statistically significant compared to the England average).
Inequalities were also observed by levels of deprivation, with higher levels of deprivation associated with increasing levels of persistent absenteeism. The most deprived decile had the highest proportion of persistent absentees at 18.8%, while the least deprived decile had the lowest at 12.4%.
Children with SEN support (24.5%) and EHCP or statement (43.7%) had a higher proportion of persistent absentees (statistically significant compared to the England average). In contrast, children with no identified SEN had a lower proportion of persistent absentees (statistically significant) at 12.4%.
Inequalities were also observed by first language status, with pupils whose first language is not English having a statistically lower proportion (12.4%) of absenteeism in secondary schools. In contrast, pupils whose first language is English had a higher proportion of absenteeism at 15.3% (statistically significant).
Data by eligibility for free school meals suggested that 30.3% of children eligible for free school meals (statistically worse than the England average) had persistent absenteeism in secondary schools compared to 10.7% of children who were not eligible for free school meals (statistically better than the England average).
Data by sex indicated that persistent absenteeism in secondary schools was slightly higher in females (15.2%) compared with females (14.5%).
Special Educational Needs
The Children and Families Act 2014 provides the statutory basis for the system for identifying children and young people (age 0-25) in England with special educational needs (SEN), assessing their needs and making provision for them. The statutory Special Educational Needs and Disability (SEND): Code of practice, first published in 2014, sets out detailed information on the support available for children and young people aged 0 to 25 under the 2014 Act. Broadly, there are two levels of support:
SEN Support, provided to a child or young person in their pre-school, school, or college.
Education, Health, and Care Plans which provide a formal basis for support for children and young people who need more support than is available through SEN Support.
There are 4 broad areas of Special Educational Needs, these are:
Cognition and Learning
This includes children with Specific Learning Difficulties, Moderate Learning Difficulties, Severe Learning Difficulties and Profound and Multiple Learning Difficulties.
Communication and Interaction
This area of needs includes children with Autism Spectrum Condition and those with Speech, Language and Communication Needs.
Social, Emotional and Mental Health
This includes any pupils who have an emotional, social or mental health need that is impacting on their ability to learn.
Sensory and/or Physical Difficulties
This area includes children with hearing impairment, visual impairment, multi-sensory impairment and physical difficulties.
Over 1.5 million pupils in England have special educational needs (SEN) in 2023, an increase of 87,000 from 2022. Both the number of pupils with an education, health and care (EHC) plan and the number of pupils with SEN support have increased. The percentage of pupils with an EHC plan has increased to 4.3%, from 4.0% in 2022 and the percentage of pupils with SEN but no EHC plan (SEN support) has increased to 13.0%, from 12.6% in 2022. The most common type of need for those with an EHC plan is autistic spectrum disorder and for those with SEN support is speech, language and communication needs.
Percentage (%) of school pupils with special educational needs.
This indicator is defined as the number of school children who are identified as having special educational needs expressed as a percentage of all school pupils. Publicly available data on fingertips are not recent and only available until 2018. According to the latest school census data from 2022, 12.3% of the school population were in receipt of SEN support. This is just slightly lower than the national figure (12.6%), although this headline figure disguises a disparity between Primary and Secondary school age children. More children are identified as needing SEN support in Bury Primary schools than in similar local authorities (3.4% more), while SEN support in Secondary schools is at levels 15% less than in similar authorities.4.4% of Bury’s school population had an EHCP, compared to 4% nationally.
It is important to note that not all the children resident in Bury with an EHCP will be attending Bury schools.
The number of EHCPs for Bury children, when scaled per head of population is substantially higher than national, regional or similar authority averages – typically between 20% and 25% in each of the last 5 years of nationally published data, with a slight narrowing of the gap over the five-year period.
Bury’s age distribution for EHCPs is interesting, with a higher rate than comparators for all age bands, but particularly marked in the under 5s (double the national rate). Primary school age children are 10% higher than the rate for England, while Secondary school age children are 10% and post 16 are almost 40% higher.
Analysis of the characteristics of children with SEND rests on the school census collected by the DfE and the children and schools covered by the census. Unfortunately, the SEN 2 return has not included ethnicity or sex or any other characteristic beyond age. Since SEN Support is mainly used by mainstream Primary and Secondary schools to identify children in need of further support, the coverage for these children is good. However, coverage in the school census for children and young people with EHCPs is not as comprehensive. For example, the school census in 2022 included 1,313 children in Bury schools with an EHCP, 63% of all the children for whom Bury holds an EHCP (2,087), according to the SEN 2 data return. Similarly, nationally, the school census covers 70% of all the children and young people with an EHCP. This is because the school census does not include children with EHCPs who are not in schools. It is also worth noting that the school census covers children in Bury schools, not Bury children. So, for EHCPs, the analysis needs to be regarded as indicative not definitive.
Analysis of the ethnicity of children in Bury’s schools overall, compared with children with identified SEND reveals a pattern of slight over-representation of White British pupils in the EHCP cohort; and slight under representation of most other groups, especially children of Pakistani heritage. This pattern increases for children supported at SEN support. This is the area of SEND with greater discretion at school level. It is particularly marked at Secondary school, although some caution needs to be exercised in arriving at general conclusions, as it could reflect individual school practice.
Percentage (%) of school pupils with social, emotional and mental health needs
According to the National Clinical Practice Guidelines issued by the British Psychological Society, children who have learning difficulties or physical disabilities are more likely to develop mental health issues when compared to the general population.
This indicator is defined as the number of school children with Special Education Needs (SEN) who are identified as having social, emotional and mental health as the primary type of need, expressed as a percentage of all school pupils.
Percentage (%) of school pupils with social, emotional and mental health needs in Bury based on the most recent data from 2021/22 was at 3.6%, higher (statistically significant) than the England average of 3%.
The percentage of school pupils with social, emotional, and mental health needs in Bury ranged from the lowest at 2.1% in 2015/16 and 2016/17 to the highest at 3.6% in 2021/22. In Bury, the percentage of school pupils with social, emotional, and mental health needs remained relatively stable at 2.1% in 2015/16 and 2016/17. It then increased to 2.4% in 2017/18 and continued to rise in subsequent years, reaching 3.6% in 2021/22. The percentage of school pupils in England with social, emotional, and mental health needs showed minor fluctuations. The percentages remained at 2.3% in 2015/16 and 2016/17, increased to 2.4% in 2017/18, and continued to rise gradually in the following years, reaching 3.0% in 2021/22.
Bury had lower percentage of school pupils with social, emotional, and mental health needs (statistically better) compared to England average from 2015/16 to 2016/17. From the period 2018/19 to the most recent data point in 2021/22, the percentage in Bury remained higher (statistically worse) compared to England average (Figure 29).
Data based on the five most recent data point suggests that the trend in Bury is increasing and getting worse.
Figure 29: Trend in percentage of school pupils with social, emotional, and mental health needs for Bury and England from the period 2015/16 to 2021/22
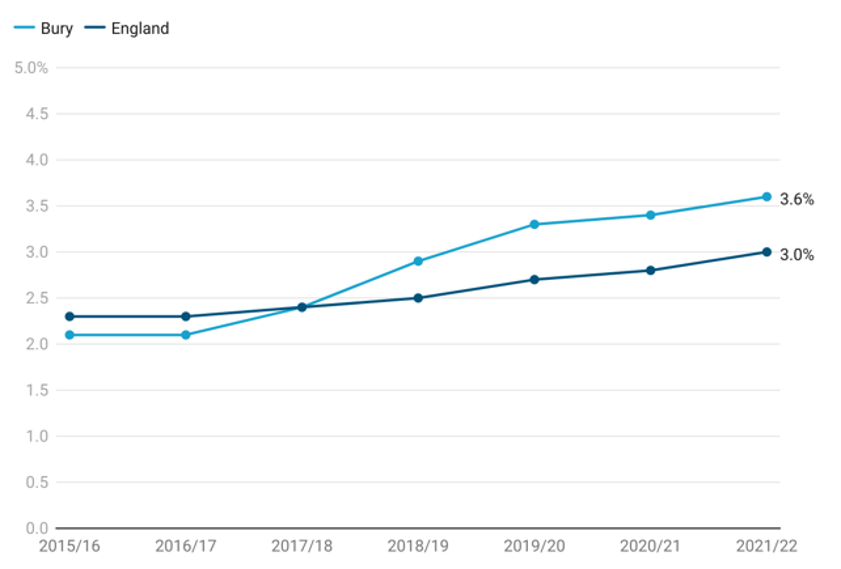
Bury ranked the highest in terms of the proportion of school pupils with social, emotional, and mental health needs among its group of 6statistical children service neighbours and the lowest proportion was in Calderdale at 2.3%.
Inequalities in proportion of school pupils with social, emotional, and mental health needs were observed across different factors. Data for Bury are available by age only and are categorised by primary and secondary school ages. Analysis of data for Bury by age revealed that a higher proportion of secondary school age pupils (3.7%) had social, emotional and mental health needs compared with primary school children at 2.4%.
When examining the data for England by age, it was observed that secondary school age pupils (2.4%) and primary school children (2.3%) had fairly similar proportions of social, emotional, and mental health needs.
Inequalities were also evident when considering levels of deprivation. Among the four most deprived deciles, there was a higher proportion of school pupils with social, emotional, and mental health needs, all 4 deciles at 2.7%. In contrast, all four least deprived deciles had a lower proportion of 2.4%.