Smoking
Smoking
Smoking
Smoking
Smoking tobacco is the leading behavioural cause of death in Bury (Global Burden of Disease, 2019). It causes a range of cancers, coronary heart disease, respiratory diseases – leading causes of death in Bury. The WHO estimates that smoking kills more than 8 million people globally every year, and up to half of smokers will be killed by smoking-related diseases (WHO, 2022).
In the UK, in 2021, 13.3% of people aged 18 years and over smoked cigarettes, which equates to around 6.6 million people in the population; this is the lowest proportion of current smokers since records started in 2011 based on estimates from the Annual Population Survey (APS). There has been a statistically significant decrease in the proportion of smokers from 2020 (14.0% of the population). The trend in smoking prevalence continued to decrease, and the latest figure represents a 6.9 percentage point decrease in current smokers compared with 2011 (20.2% of the population).
Those aged 25 to 34 years continued to have the highest proportion of current smokers (15.8%, around 1.3 million people), when compared with any other age group, and those aged 65 years and over continued to have the lowest proportion of current smokers (8.0%, around 900,000 people). Across time, the largest reduction in smoking prevalence has been among those aged 18 to 24 years; 25.7% of this group smoked in 2011 compared with 13.2% in 2021, which is a reduction of almost 12.5 percentage points. Research from the University of Essex suggests that increased taxation on tobacco products has been effective at reducing smoking prevalence among those aged under 25 years.
Smoking is an important contributor to health inequalities. National data suggest that smoking rates are around 17% in the most deprived tenth of areas compared with 10% in the least deprived tenth. National survey data show smoking rates above 23% in people employed in routine and manual jobs compared with around 9% for people in managerial and professional jobs. Smoking rates are also higher among people from white and mixed ethnic backgrounds, people with no religion, males, and in people with severe mental illnesses (Office for Health Improvement and Disparities).
Smoking prevalence for Bury, North West and England
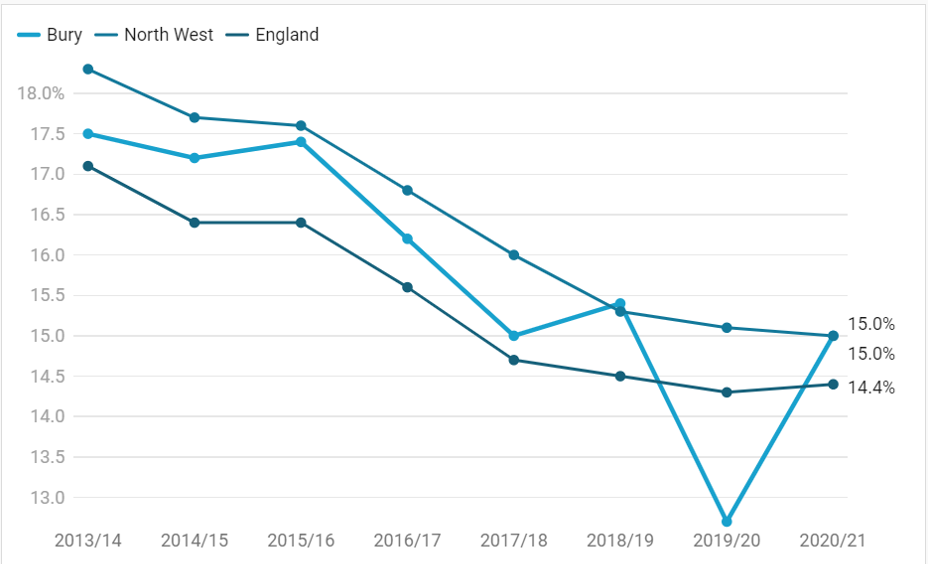
The smoking prevalence for adults 18+ in Bury is higher than in England but has continued to decline, as it has in the North West and England although it has not been a steady decline in Bury as can be seen in Figure 1 below.
In the year 2013/14, 17.5% of adult residents in Bury, 18.3% of adults in the North West and 17.1% of adults in England were smokers. The latest data for 2020/21 shows the rates have fallen to 15.0% in both Bury and the North West and to 14.4% in England.
Figure 1: Smoking prevalence, by percentage, Bury, North West and England, 2013/14 – 2020/21
Smoking prevalence in adults in Bury, by gender
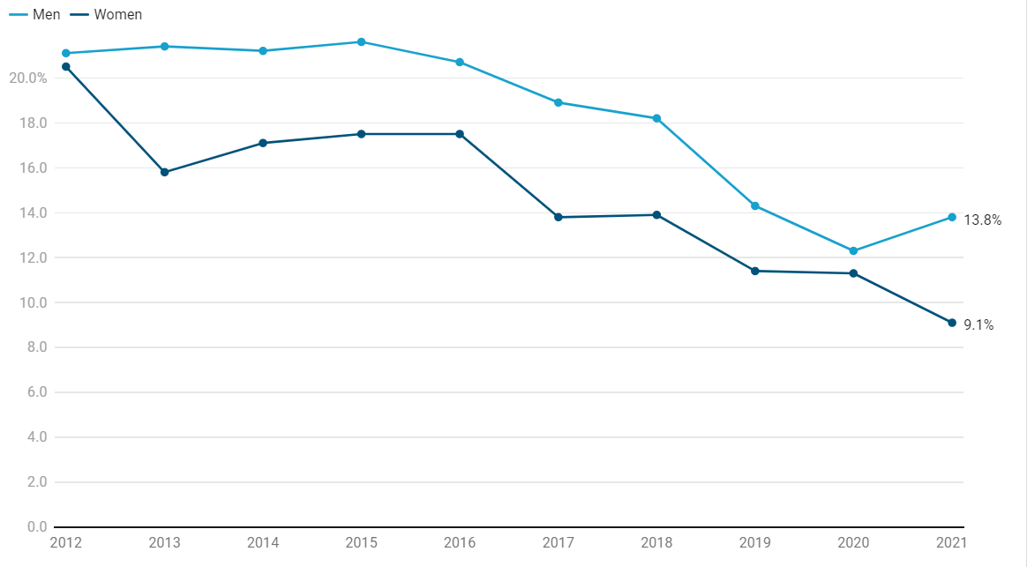
As in previous years, men were more likely to smoke than women. In Bury, in 2021, 13.8% of men and 9.1% of women were current smokers. National data show that smoking prevalence increased during COVID-19 lockdowns (Jackson et al, 2022). However, local data suggest that in Bury the increase in smoking prevalence was only seen in men, while smoking rates appeared to decrease in women over the same time period.
Figure 2: Smoking prevalence, by percentage, for adults in Bury, by gender, 2012 – 2021
Smoking prevalence in routine and manual workers
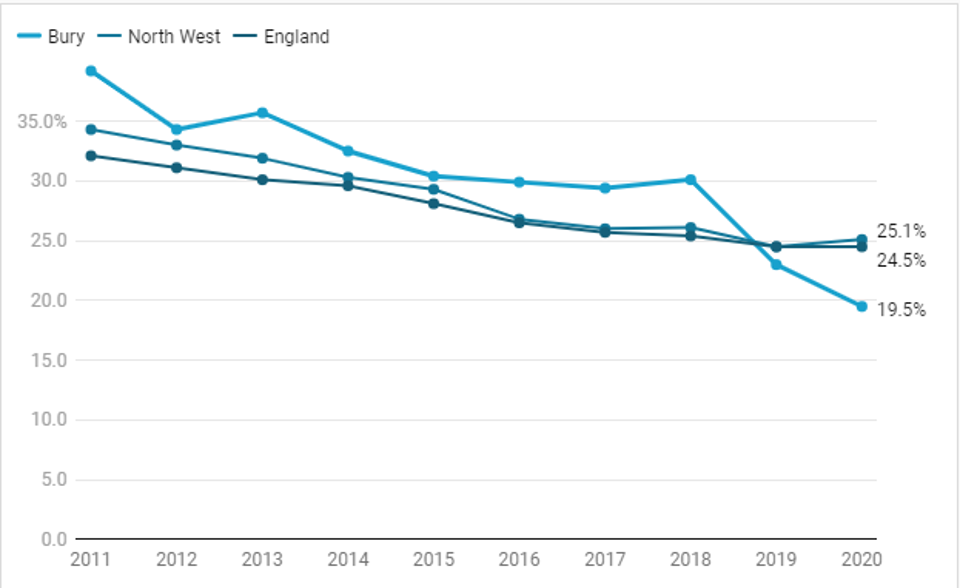
In 2011 Bury had the highest number of smokers in routine and manual workers at 39.2% compared to the North West at 34.3% and England at 32.1%. In 2020 Bury has now fallen to the lowest rate at 19.5% compared to 25.1% in the North West and 24.5% in England.
Figure 3: Smoking prevalence, by percentage, in routine and manual workers in Bury, North West and England, 2011 – 2020
Smoking prevalence in adults (18+) with serious mental illness (SMI)
Public Health England data from 2013/14 shows that 40.5% of adults in England with a serious mental health illness (SMI) are smokers, a figure which has remained steady over the past 20 years. Bury is very similar with a prevalence of 40.3% whereas the North West is higher at 45.0%.
Smoking prevalence in adults (18+) with a long term mental health condition
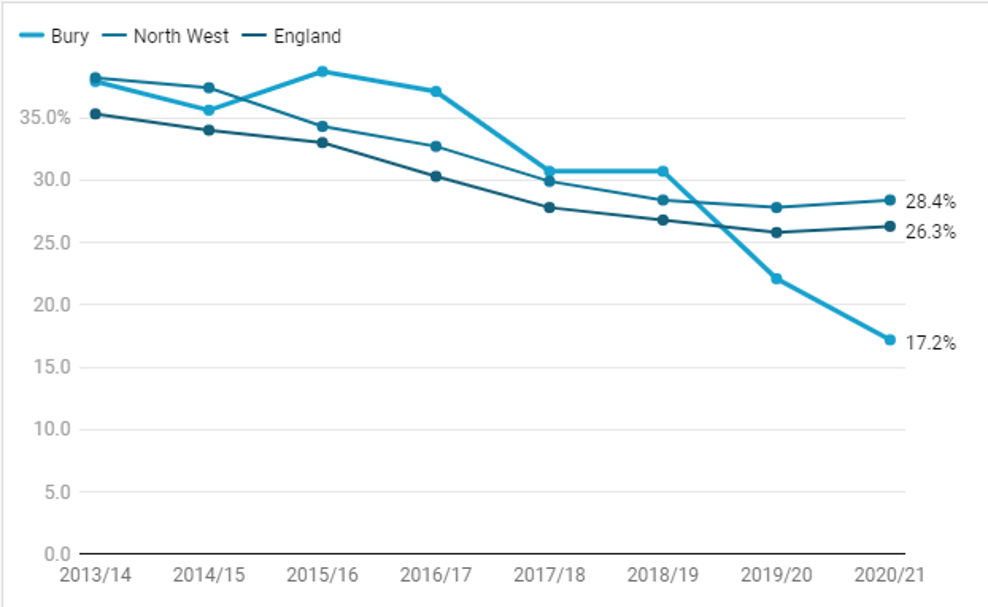
Smoking prevalence in adults with a long term mental health condition has decreased since 2011. The rates in Bury remained higher than England from 2013/14 until 2019/20 and data for 2020/21 shows it has dropped further.
Figure 4: Smoking prevalence, by percentage, of adults with a long term mental health condition in Bury and England, 2013/14 – 2020/21
Percentage of women smoking in pregnancy
Smoking in pregnancy is an important cause of complications in pregnancy, miscarriage, premature birth, low birth weight, and sudden infant death syndrome (SIDS, or ‘cot death’). The percentage of women smoking at the time of delivery in England has fallen steadily from 15.8% in 2006/7 to 9.1% in 2021/22.
Figure 5: Percentage of pregnant women in England smoking at the time of delivery, 2006/07 – 2021/22
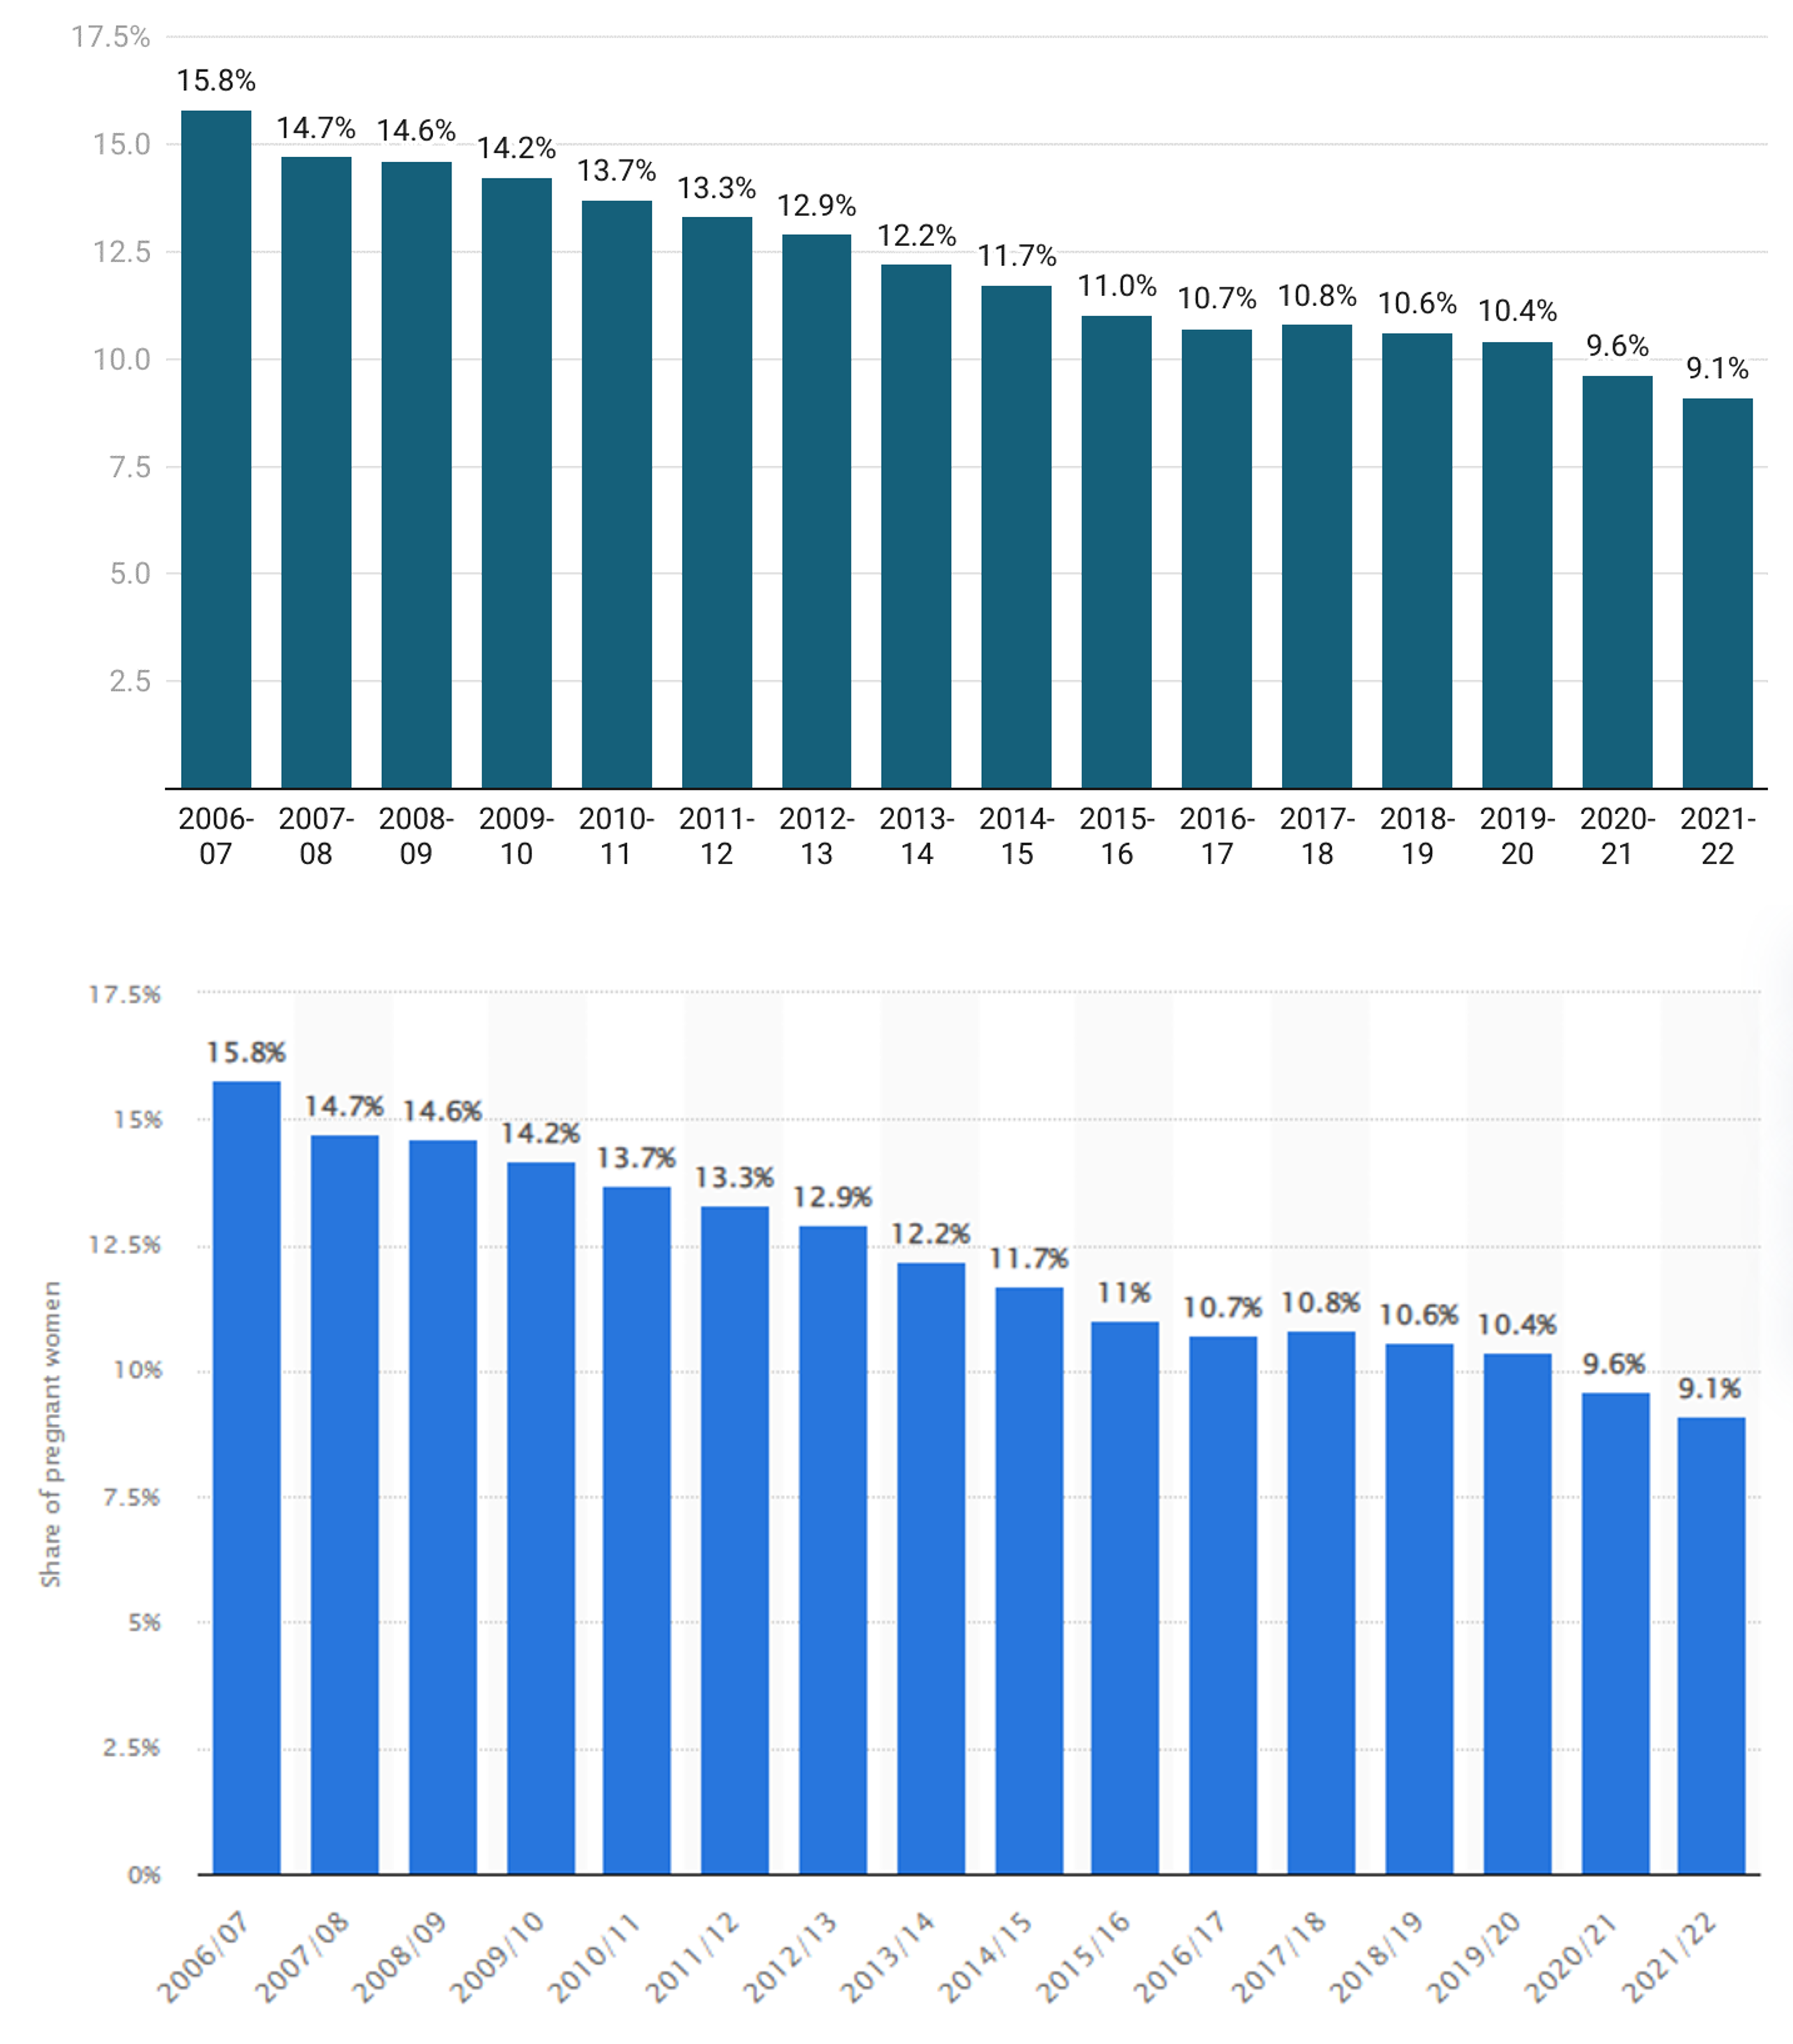
For Bury, the percentage in 2021/22 is lower, at 8.8%.
Smoking attributable hospital admissions
Smoking contributes to a wide range of diseases. The rate of hospital admissions caused by diseases associated with smoking can be used as an indicator of the overall impact of smoking on the NHS.
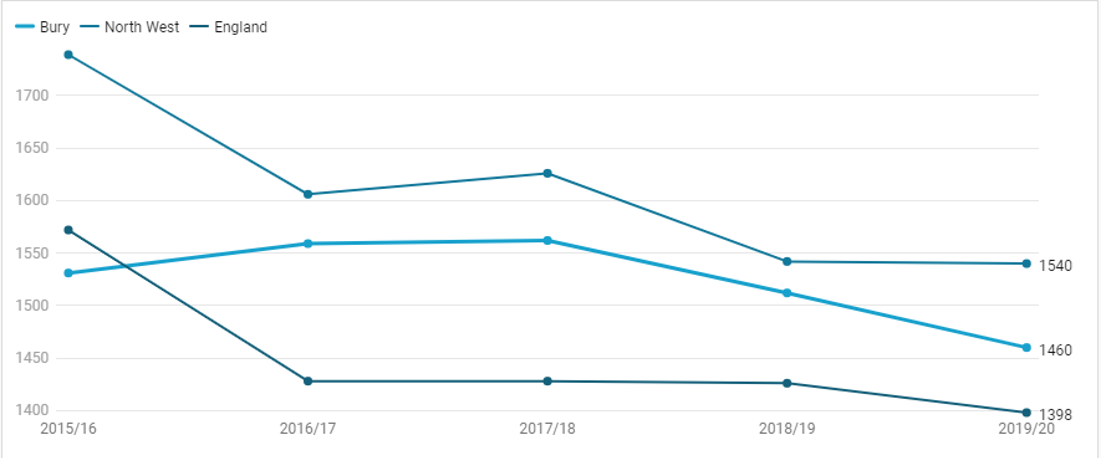
The rate of hospital admissions attributable to smoking in Bury has decreased overall from 1531 (per 100,000) in 2016/16 to 1460 (per 100,000) in 2019/20, despite increasing in 2016/17 and 2017/18. In England, the rate of hospital admissions attributable to smoking has decreased from 1572 (per 100,000) in 2015/16 to 1398 (per 100,000) in 2019/20, following a sharp decline between 2015/16 and 2016/17.
Bury rates have fallen between England and the North West for the last 4 recording periods.
Figure 6: Smoking attributable hospital admissions per 100,000 comparing Bury, North West and England, 2015/16 – 2019/20
Emergency hospital admissions for COPD
COPD is an important cause of disability, and exacerbations of COPD make up a significant proportion of smoking-related hospital admissions.
In England, there has not been any significant change over time. Bury has fluctuated however the rate is increasing with the latest data for 2019/20 showing the trend as significantly worse than England. Bury is better than the North West.
Figure 7: Emergency hospital admissions for COPD, directly standardised ratio per 100,000 for Bury, North West and England, 2010/11 – 2019/20
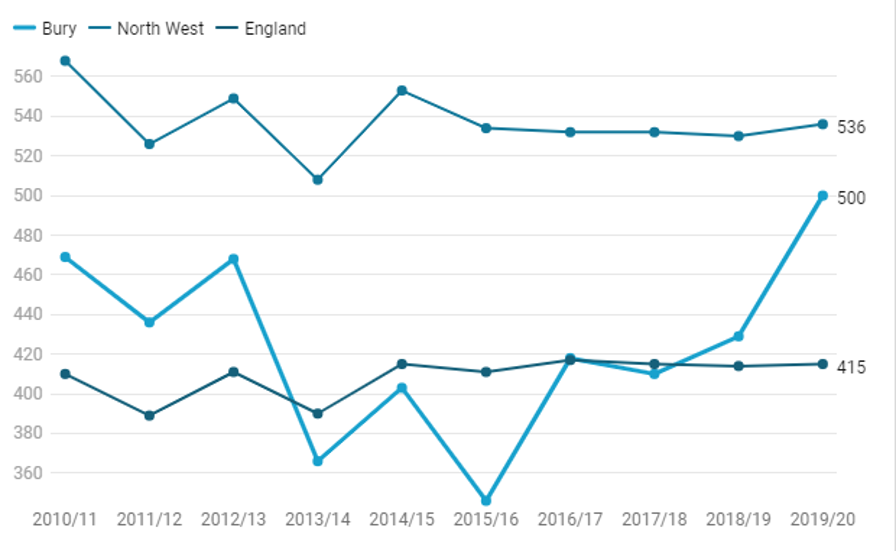
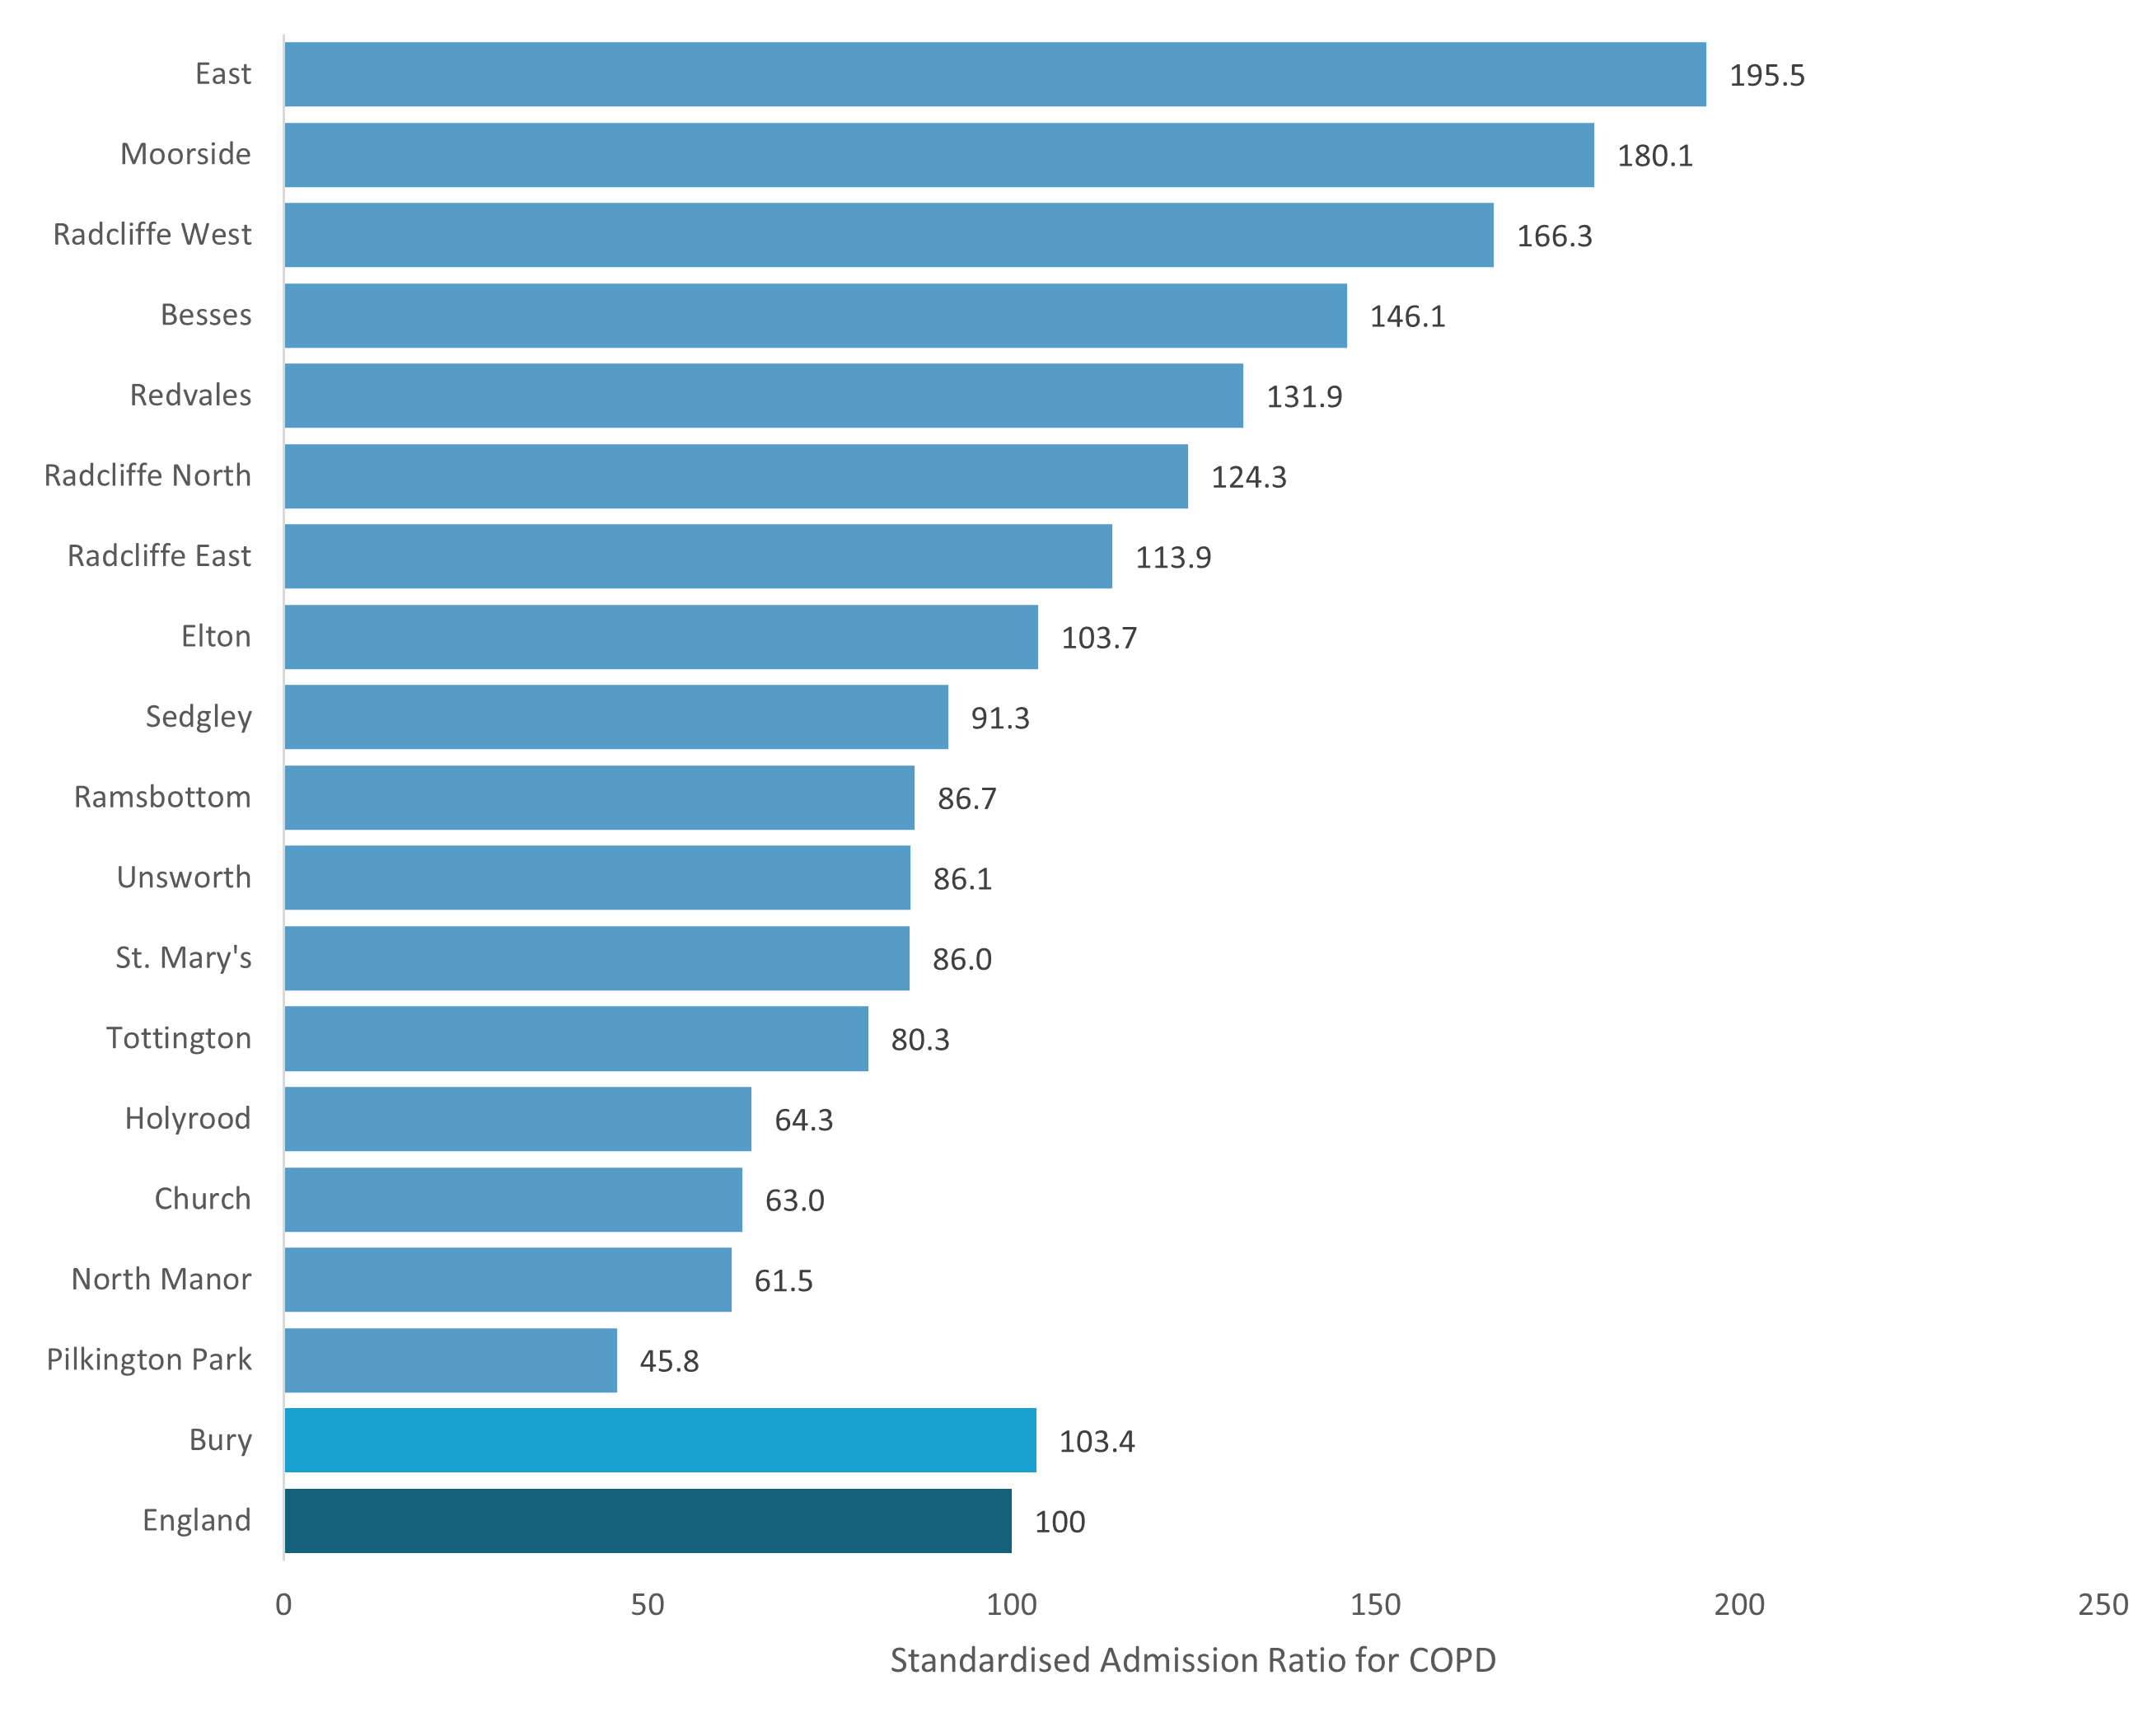
Figure 8 below shows data for Bury wards on emergency hospital admissions for COPD from 2016/17 to 2020/2021 as a standardised admission ratio.
There are 5 wards significantly better than England – Pilkington Park, North Manor, Church, Holyrood and Tottington.
There are 6 wards significantly similar - St Mary’s, Unsworth, Ramsbottom, Sedgley, Elton and Radcliffe East.
There are also 6 wards significantly worse – Radcliffe North, Redvales, Besses, Radcliffe West, Moorside and East.
Figure 8: Emergency hospital admissions for COPD by Bury wards and Bury overall, standardised admission ratio compared to England.
Lung Cancer
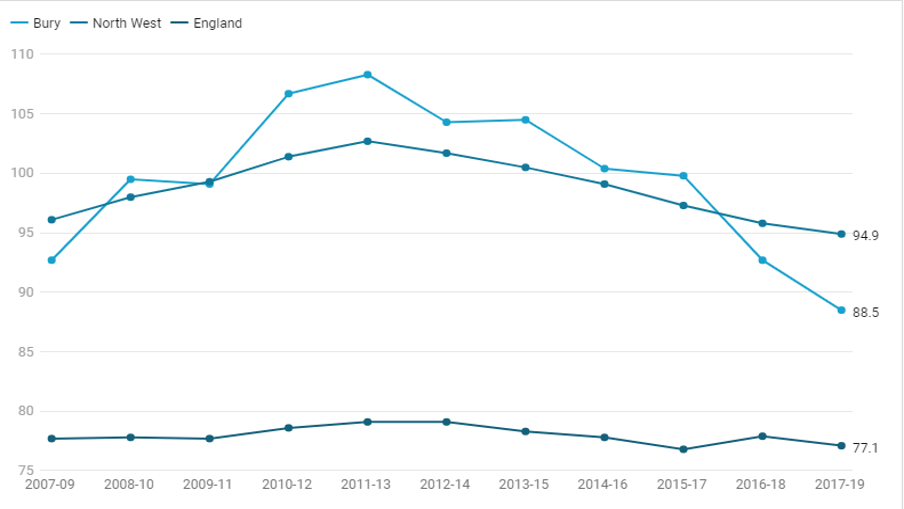
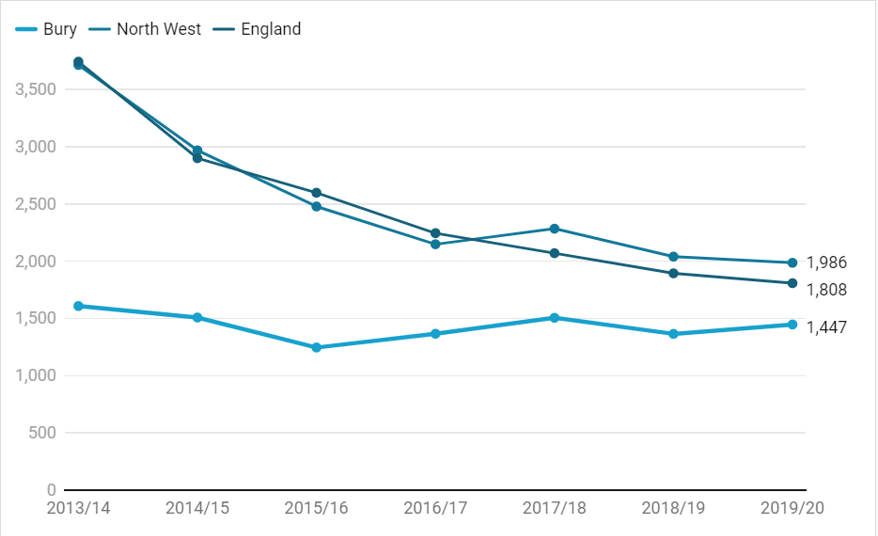
The number of lung cancer cases in Bury is significantly worse than in England but comparable with the North West. However, incidence has been falling at a faster rate than England or the North West since the 2013-2015 period.
Figure 9: Rate of lung cancer cases per 100,000 by 3-year period, comparing Bury, North West and England, 2007-09 – 2017-19
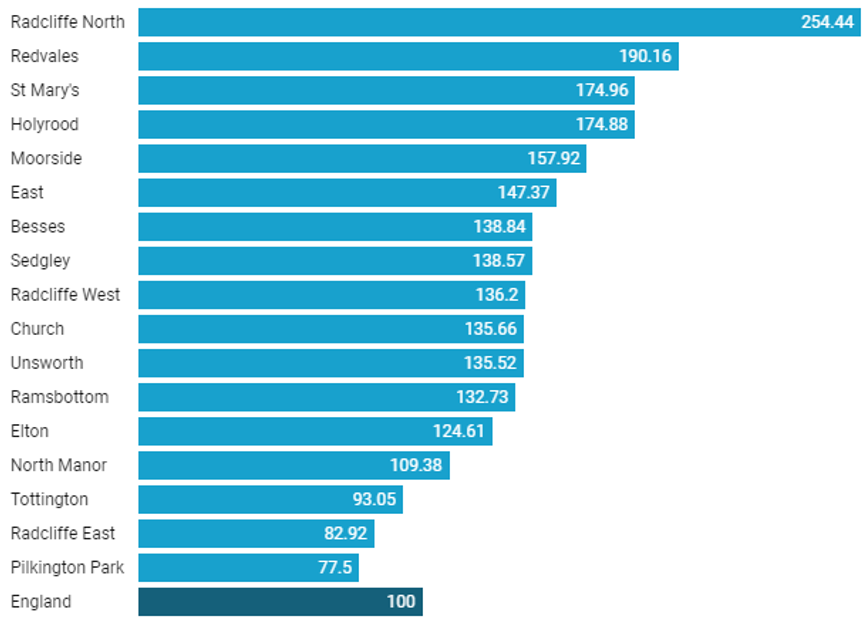
There are also marked inequalities in lung cancer incidence within Bury. Figure 10 below shows lung cancer incidence data for 2018-2020, as a standardised ratio per 100.
There are only 3 Bury wards with lower incidences than England, these are Tottington, Radcliffe East and Pilkington Park.
Radcliffe North is significantly worse of the 17 wards, with more than 3 times the number of cases than Pilkington Park and Radcliffe East and more than double the number for England. Redvales is almost double the rate for England.
These data make it clear that focusing only on the 20% most deprived areas will not be enough to get lung cancer incidence for Bury as a whole down to the national average.
Figure 10: Lung cancer incidence 2018-2020 as a standardised ratio per 100 for Bury wards compared to England
Deaths attributable to smoking
Roughly half of smokers will be killed by smoking-related illnesses. Lung cancer is among the most important of these. Lung cancer deaths in Bury are the highest among its statistically similar areas, and are higher than the English average (though on a declining trend).
Figure 11: Aged-standardised mortality rate from lung cancer, all ages for Bury and its statistical neighbours per 100,000 population (Mortality Profile, 2021)
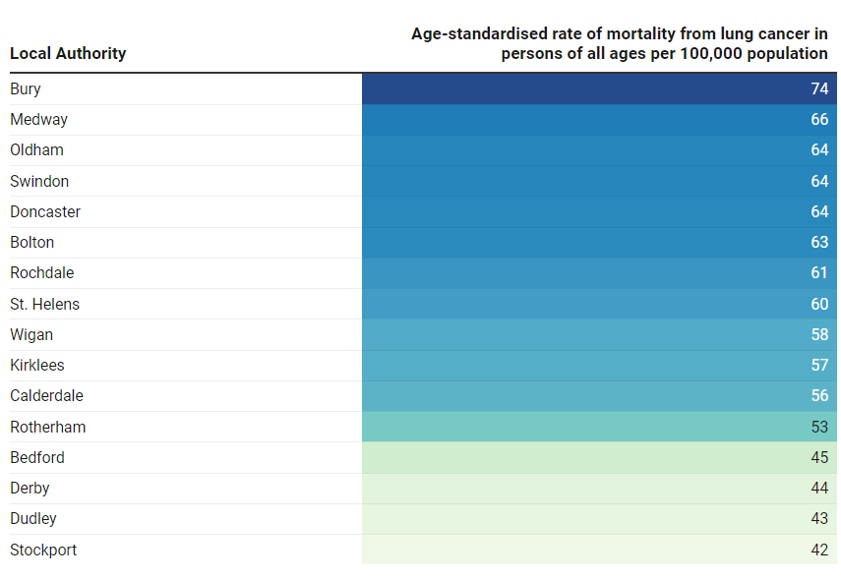
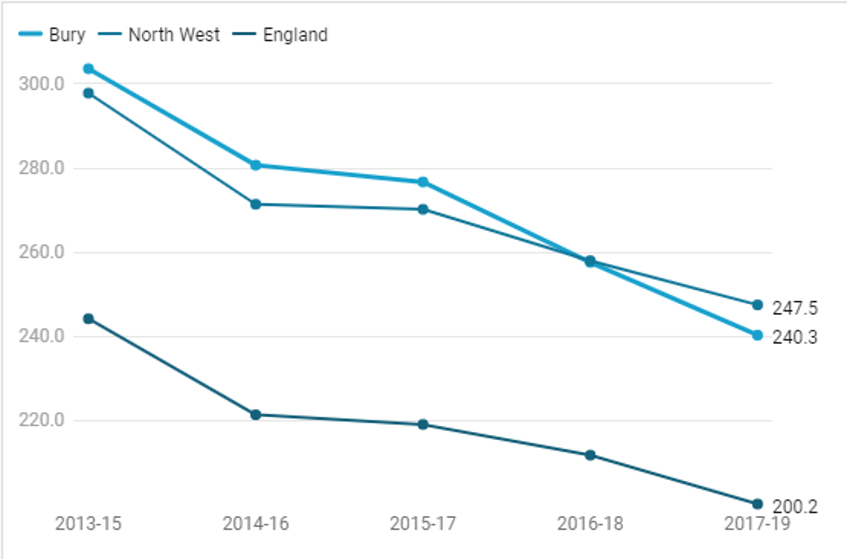
Figure 12: Deaths per 100,000 attributable to smoking for 3-year periods, comparing Bury, North West and England, 2013-15 – 2017-19
Quitting Smoking
Prior to the 2008/09 data collection, the NHS Information Centre collected quarterly data from local Stop Smoking Services via aggregated Strategic Health Authority (SHA) returns. From 2008/09 the data have been collected at PCT level, and from 2013 at LA level.
Previously this indicator was calculated using the Integrated Household Survey (IHS) however in 2013 several survey modules were removed from the Integrated Household Survey (IHS) to leave a dataset solely based upon the Annual Population Survey (APS). Therefore the ONS announced it would no longer produce the IHS. Instead the questions formerly regarded as the IHS core continue to be asked in the APS.
The APS is designated as a National Statistic and provides a consistent time series of data. Some differences in survey coverage, imputation and weighting methodology may result in some discontinuity for certain 'core' variables compared to estimates previously provided as part of the IHS and as a result the IHS and APS should not be directly compared. ONS have drafted a note (available here) to explain the differences further.
NHS Digital are responsible for validating the data and ensuring that the data are as accurate and complete as possible.
In December 2018 the entire time series was recalculated based on the revised mid-year population estimates published by ONS. Therefore estimates may differ from those published by other sources which use different population estimates to calculate the smoking population.
NHS Digital identified an issue with the data used to compile the Stop Smoking Services publication, originally released on 3rd September 2019. The annual dataset did not contain the revised data for Quarters 1 to 3 that local authorities had submitted along with their quarter 4 data; instead the provisional data for those quarters was included in the annual dataset. This has caused differences throughout the publication. Data for 2018/19 was updated on that tool on 1 October 2019.
Public health profiles - OHID (phe.org.uk)
Bury was performing significantly worse than England in 2013/14, narrowing the gap consistently over the next 3 years and from 2017/18 has been similar to England, continually improving. Bury has not followed the decline trend shown by England and the North West.
Figure 13: Smokers setting a quit date, by percentage, aged 16+ comparing Bury, North West and England, 2013/14 – 2019/20
-
 Source: NHS Digital Stop Smoking Services data, Annual Population Survey, and PHE Population Health Analysis Team Statistics on NHS Stop Smoking Services in England - NHS Digital
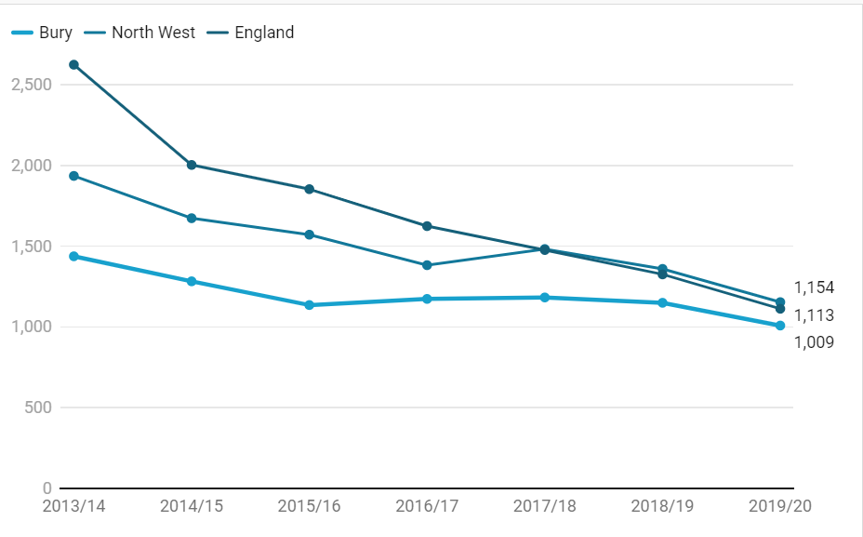
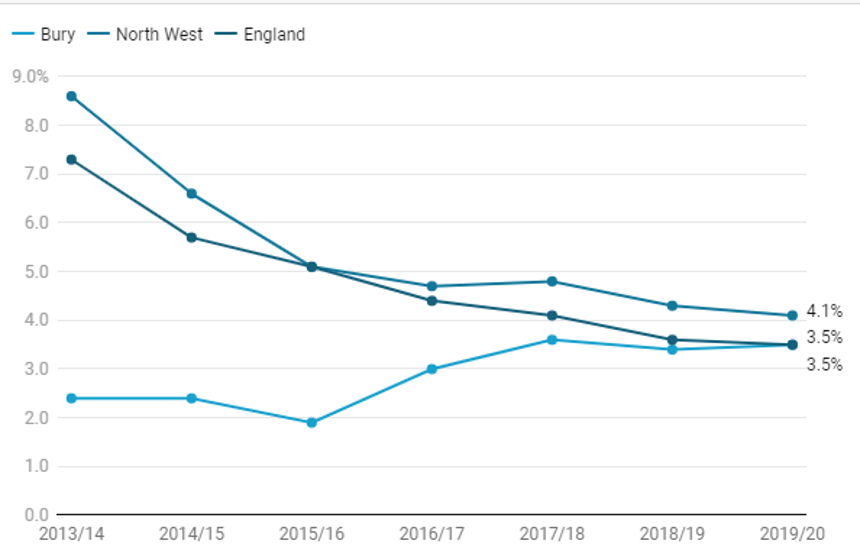
Successful quitters are those smokers who successfully quit at the four-week follow-up. A client is counted as a ‘self-reported 4-week quitter’ when assessed four weeks after the designated quit date, if they declare that they have not smoked, even a single puff on a cigarette, in the past two weeks. This information is collected on NHS Stop Smoking returns in line with requirements from the Department of Health (DH).
England and the North West have both followed a very similar decline pattern over time. Bury has fewer quitters but has remained stable over the same period.
Figure 14: Rate of successful quitters at 4-weeks - per 100,000 smokers aged 16+ comparing Bury, North West and England, 2013/14 – 2019/20
-
 Source: Population Health Analysis Team, Public Health England
The rate of successful quitters (CO validated) at 4-weeks - per 100,000 smokers aged 16+ is a guide to how effective local NHS Stop Smoking Services are at helping people quit smoking and how many people are stopping smoking as a result of the service in the area.
It is recognised that in certain cases some time may need to be spent with clients before they are ready to set a quit date. However only actual quit attempts are counted for national monitoring.
Carbon Monoxide (CO) validation measures the level of carbon monoxide in the bloodstream and provides an indication of the level of use of tobacco: it is a motivational tool for clients as well as validation of their smoking status. CO validation is attempted on all clients who self-report as having successfully quit at the 4-week follow-up, except for those who were followed up by telephone.
CO validated smoking quits provide an objective measure in addition to self-reported quits, and CO validation may also help incentivising clients to quit.
Similarly to the above, Bury has remained relatively stable over time, not seeing the steeper declines shown by England and the North West. However by 2019/20 all 3 areas are showing similar data.