Deprivation
Deprivation
Deprivation
-
 Deprivation: information about deprivation in Bury
Deprivation
Deprivation refers to a lack of access to opportunities and resources required for a sufficient standard of living such as quality housing, access to health care and employment. Deprivation is not the same as poverty and although both are related, they are distinct concepts. As an example, despite having a relatively high income, a person or family may still experience deprivation because of other factors like poor housing conditions, a lack of social support systems, or limited access to opportunities and services (PSE, 2016). Deprivation can have a significant impact on health outcomes of an individual, increasing the risk of poor health, injury and premature mortality. This is because people who experience deprivation are more likely to be exposed to physical, social and environmental factors that can have a negative impact on their health, as well as face barriers to accessing healthcare and other services (Hanif, 2015).
A person or household is said to be in poverty when they do not have enough money or resources to take care of their basic needs, such as clothing, housing, and food. Poverty is often measured using income-based thresholds or poverty lines, such as the percentage (%) of households with income below 60% of the median income (CPAG, 2023).
Deprivation and poverty can both have a negative impact on the health and wellbeing of an individual through limiting access to essential resources and services and increasing risk factors exposure related to poorer health outcomes. As deprivation takes into account broader range of factors beyond just income, public health professional and policymakers can better understand the multiple dimensions of disadvantage that people may face, and design interventions that address the complex and interlinked factors contributing to inequalities in health (Hanif, 2015).
Measuring Deprivation:
Since the 1970s, the Ministry of Housing, Communities and Local Government (and its predecessors) in the UK have calculated deprivation statistics for England. The Index of Multiple Deprivation (IMD), which defines deprivation in terms of a variety of living conditions or domains of deprivation, is an important component of the indices.
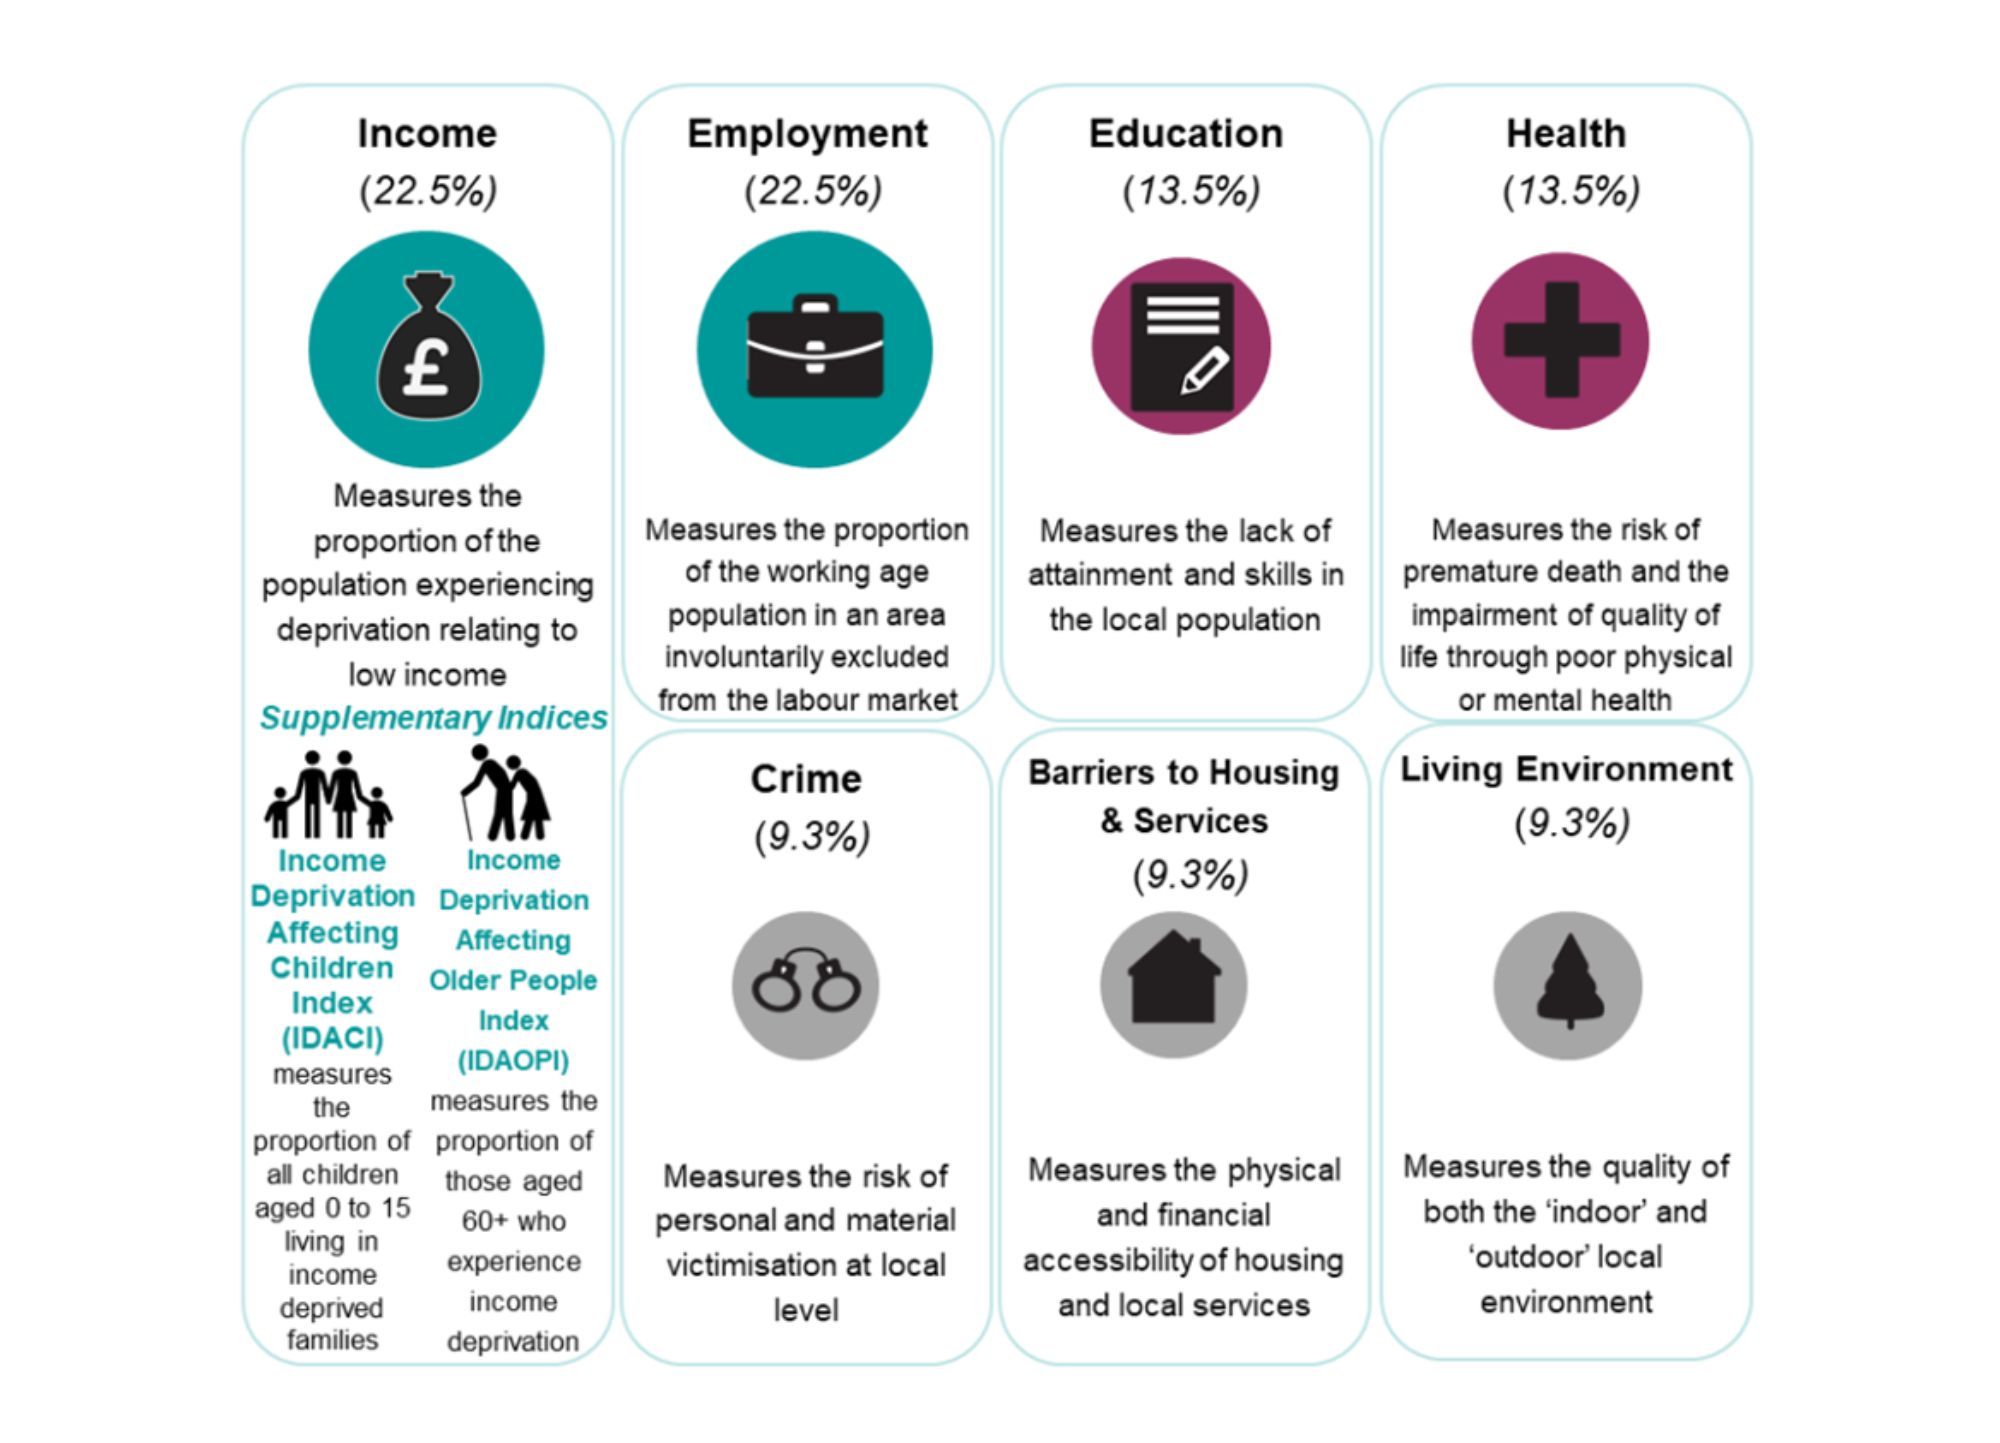
The IMD (last updated in 2019) is a composite measure that combines 39 different indicators of deprivation into 7 domains that include income, employment, education, health, crime, barriers to housing and services, and living environment. Each of the domains is specified a weight based on its importance in contributing to overall levels of deprivation, and the scores for each indicator are combined to give an overall IMD score as an official measure of relative deprivation for small areas in England (Figure 1). There is no definitive threshold for a place to be classed as ‘deprived’. The data and analysis in the IMD 2019 span from the years 2011 to 2019, and each indicator is based on the most recently available information. In particular, the Income Deprivation domain and Employment Deprivation domain of the Indices of Deprivation 2019 draw from tax year 2015/16. Therefore, the indicators do not take into account any changes in policy that have occurred since the given time point, e.g. the 2015/16 benefits data does not reflect the full implementation of Universal Credit, which began in April 2016.
The 2019 Indices of Deprivation were generated by utilising comparable approaches, frameworks, and methodologies as the 2015, 2010, 2007, and 2004 Indices of Deprivation. Modifications have been applied to the indicators between versions, including changes to eligibility for some benefits that are used to gauge income and employment deprivation, alterations to population denominator data and LSOA area definitions. Comparisons can be drawn from the several versions of the Indices of Deprivation; however, they should not be constructed as time-series.
Figure 1: Domains of deprivation used to create IMD and their weightings
Source: The seven different domains, their weightings and supplementary indices (HM Government)
-
 To download a copy of this chart, please left click the button below or use the 'Related Files' section located at the bottom of the page.
The small geographical areas are called Low Super Output Areas (LSOAs) and they have an average population of 1500 residents or 650 households. The IMD scores ranks the LSOAs from 1 to 32,844, with 1 denoting the area with the most deprivation and 32,844 denoting the area with the least deprivation. The scores are then divided into 10 equal groups as deprivation deciles, with 10% of the population in each decile. These groups range from the most deprived 10 per cent (decile 1) to the least deprived 10 per cent (decile 10), of LSOAs nationally. The Income Deprivation Affecting Children Index (IDACI) and the Income Deprivation Affecting Older People Index (IDAOPI), concentrating on deprivation among children and older people, respectively, are two additional measures of deprivation used in England (IMD, 2019). Combining these measurements with the IMD results in a more complete picture of deprivation in different geographical areas (Figure 1).
Use of IMDs:
The Index of Multiple Deprivation (IMD) is a useful measure to highlight the most deprived areas in England. Local decision makers can use it to form the foundation of strategies and service planning, including understanding the necessity and predicting the demand for services. Office for Health Improvement and Disparities (OHID) have taken advantage of the Indices to display differences in the Public Health Outcomes Framework (PHOF) indicators and users of the PHOF data tool are now able to examine the correlation between every indicator and deprivation (OHID, 2023). The voluntary and community sector also uses IMD to understand where people may benefit from the services they provide.
Deprivation in Bury
Although the IMD is designed to be used for small areas (LSOAs), ranks are also published for other geographies, including Local Authorities (IMD 2019).
Some key deprivation statistics for Bury are below:
Bury ranks 95th from the 317 Local Authorities in England in terms of deprivation ranking in the 3rd most deprived decile in England at Local Authority level.
Overall, Bury is the 8th most deprived of the 10 GM districts (where 1st is the most deprived).
Amongst our CIPFA Statistical Neighbours, Bury is ranked 15th out of 16, making it the 2nd least deprived.
Out of 120 Lower Super Output Areas in Bury, 12 (10%) of them fall within the 10% most deprived areas of the nation, concentrated primarily around the Bury town centre, Radcliffe and Besses.
In 2015, Bury was ranked 117th of the recalculated 317 Local Authority districts – this means that the borough has become more deprived relative to other places over the intervening four years.
Wards
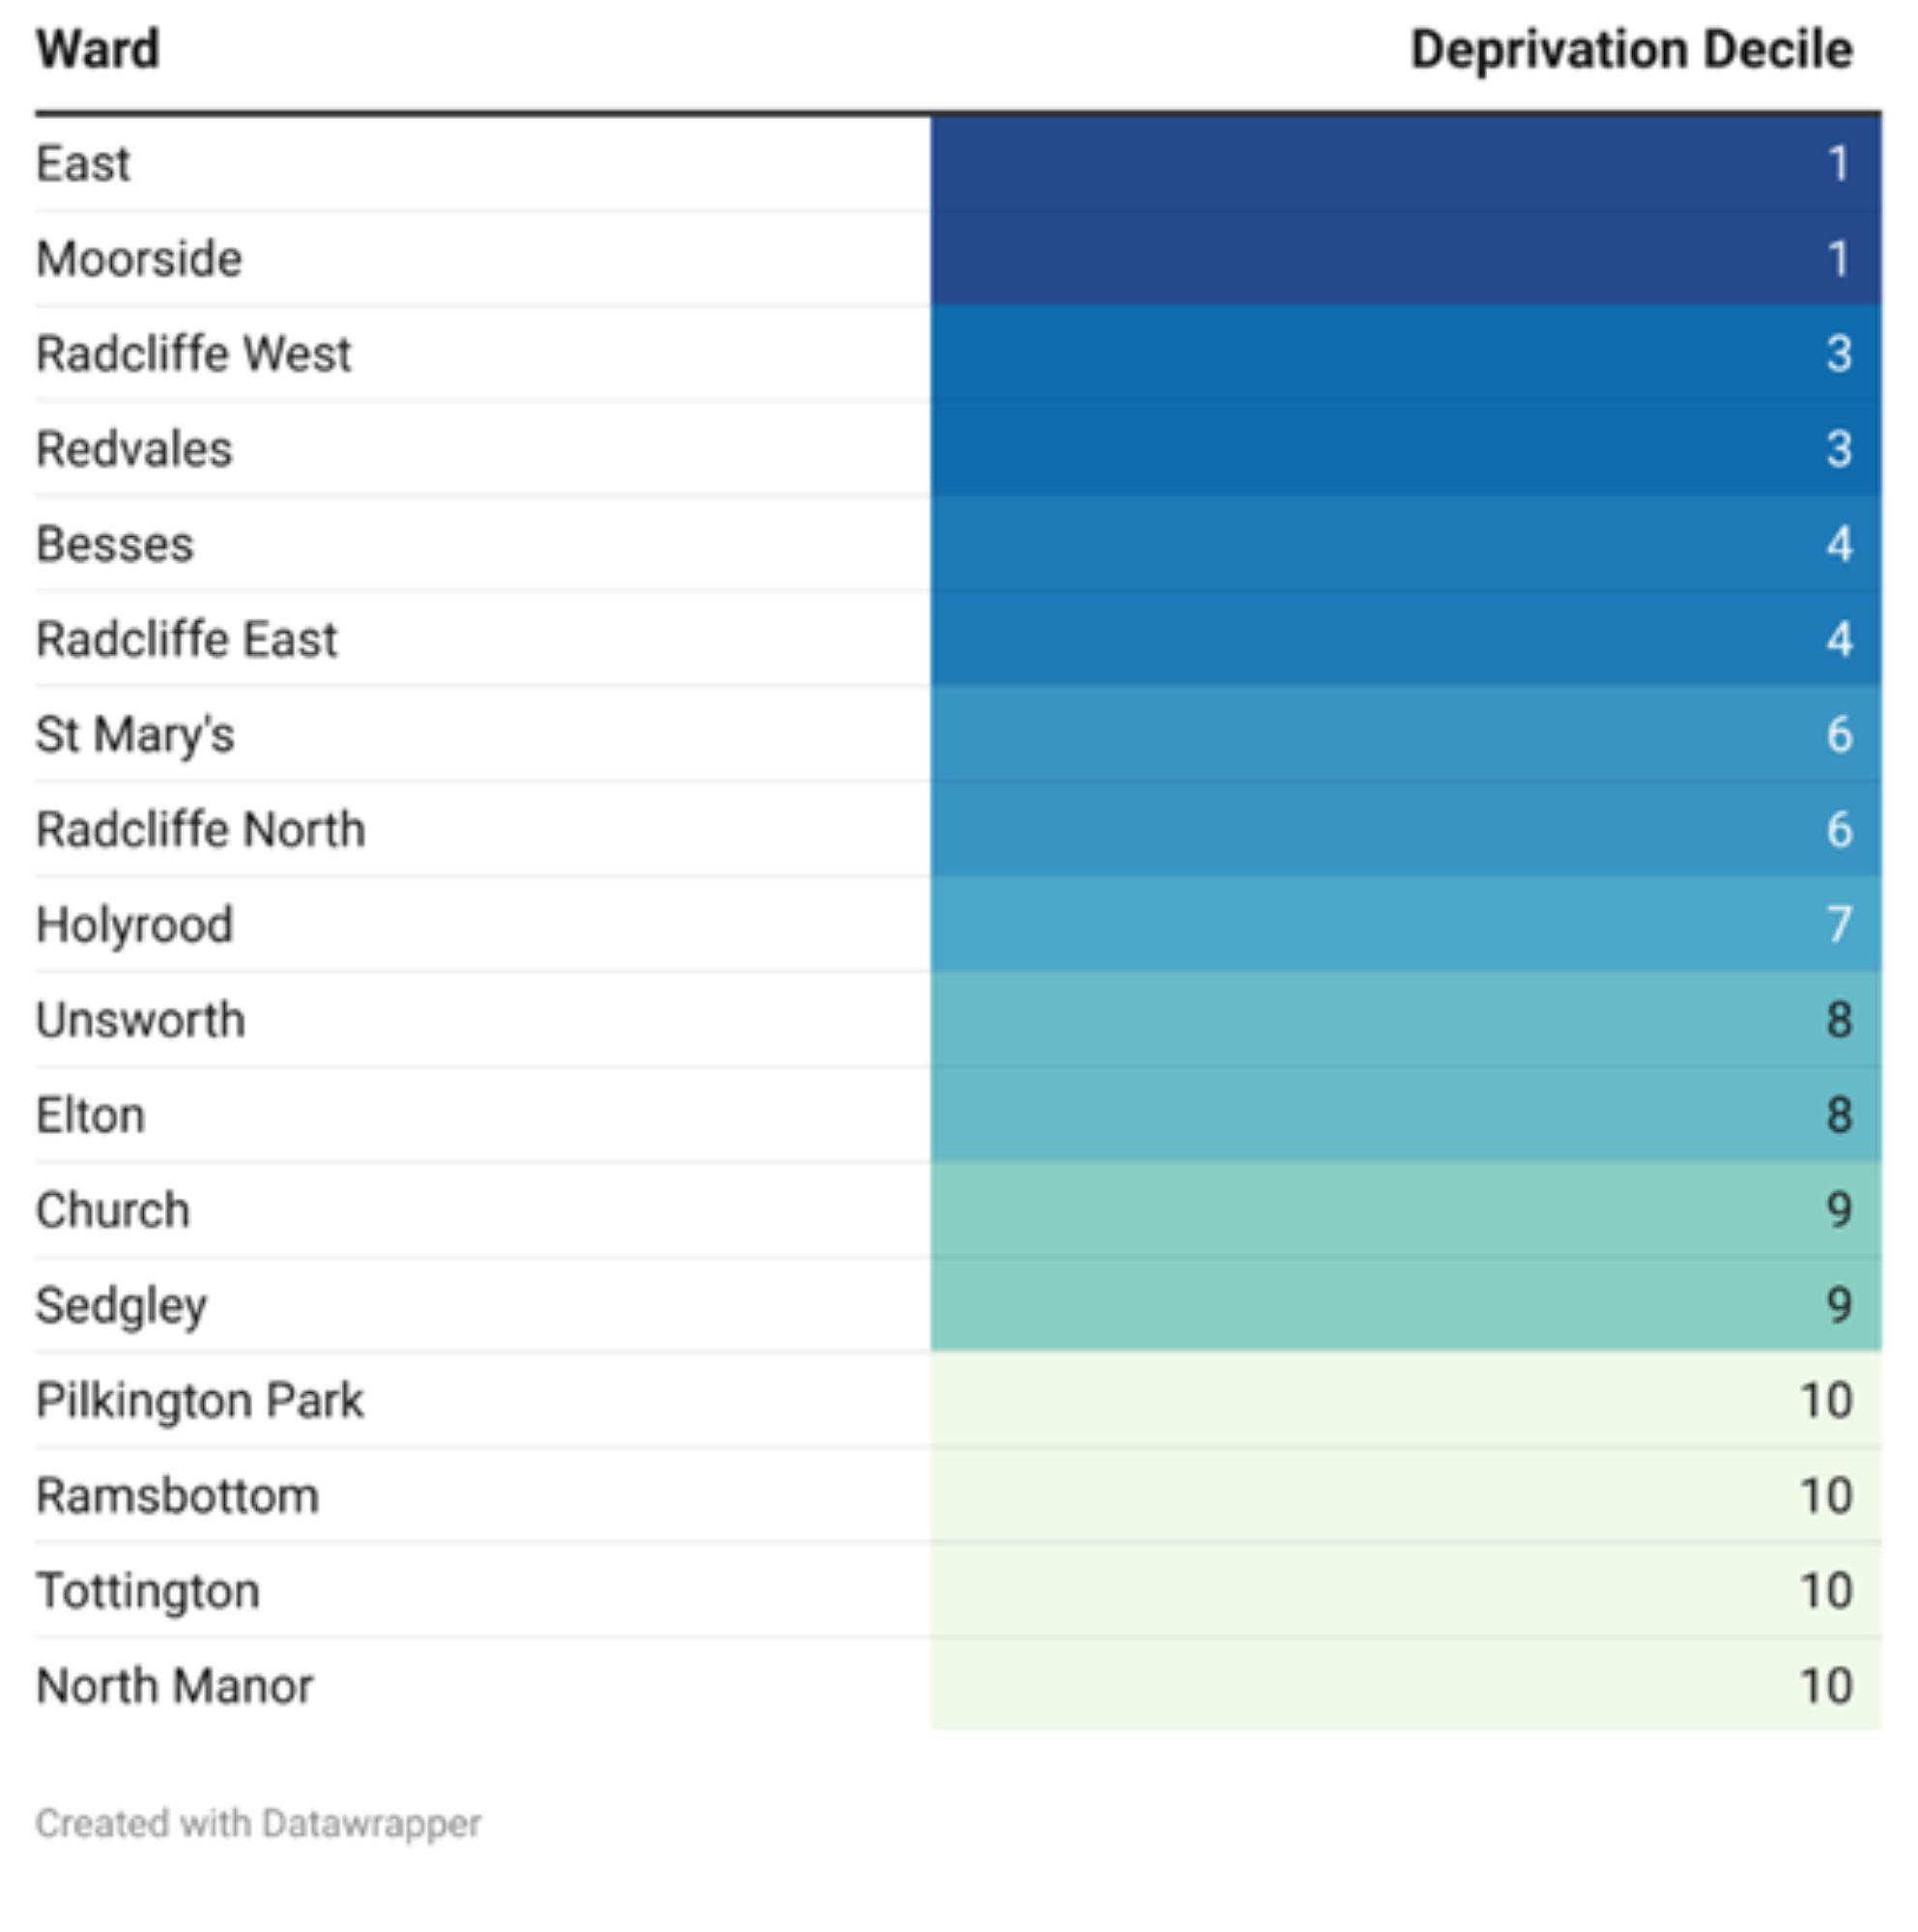
The deprivation scores are designed to be used at small-area level (LSOA) and are not currently published at Ward or Township levels. Deprivation deciles for each ward in Bury was calculated as a weighted average of the IMD scores of its constituent LSOAs, where the weights are based on population size. This ensures that the deprivation score for each ward reflects the level of deprivation experienced by its population. Figure 2 below presents the IMD scores for each ward in Bury.
Figure 2: IMD scores for Bury wards
-
.jpg) To download a copy of this chart, please left click the button below or use the 'Related Files' section located at the bottom of the page.
To download a copy of this chart, please left click the button below or use the 'Related Files' section located at the bottom of the page.
East and Moorside are the most deprived wards in Bury and North Manor and Tottington are the least deprived wards in Bury.
Once IMD scores for the wards were calculated, they were ranked by their IMD score and divided into 10 equal groups. The most deprived 10% of wards were assigned to the 1st decile, the next 10% to the 2nd decile, and so on, with the least deprived 10% of wards being assigned to the 10th decile (Figure 3).
Figure 3: Bury wards by Deprivation deciles
-
 To download a copy of this chart, please left click the button below or use the 'Related Files' section located at the bottom of the page.
LSOA Level
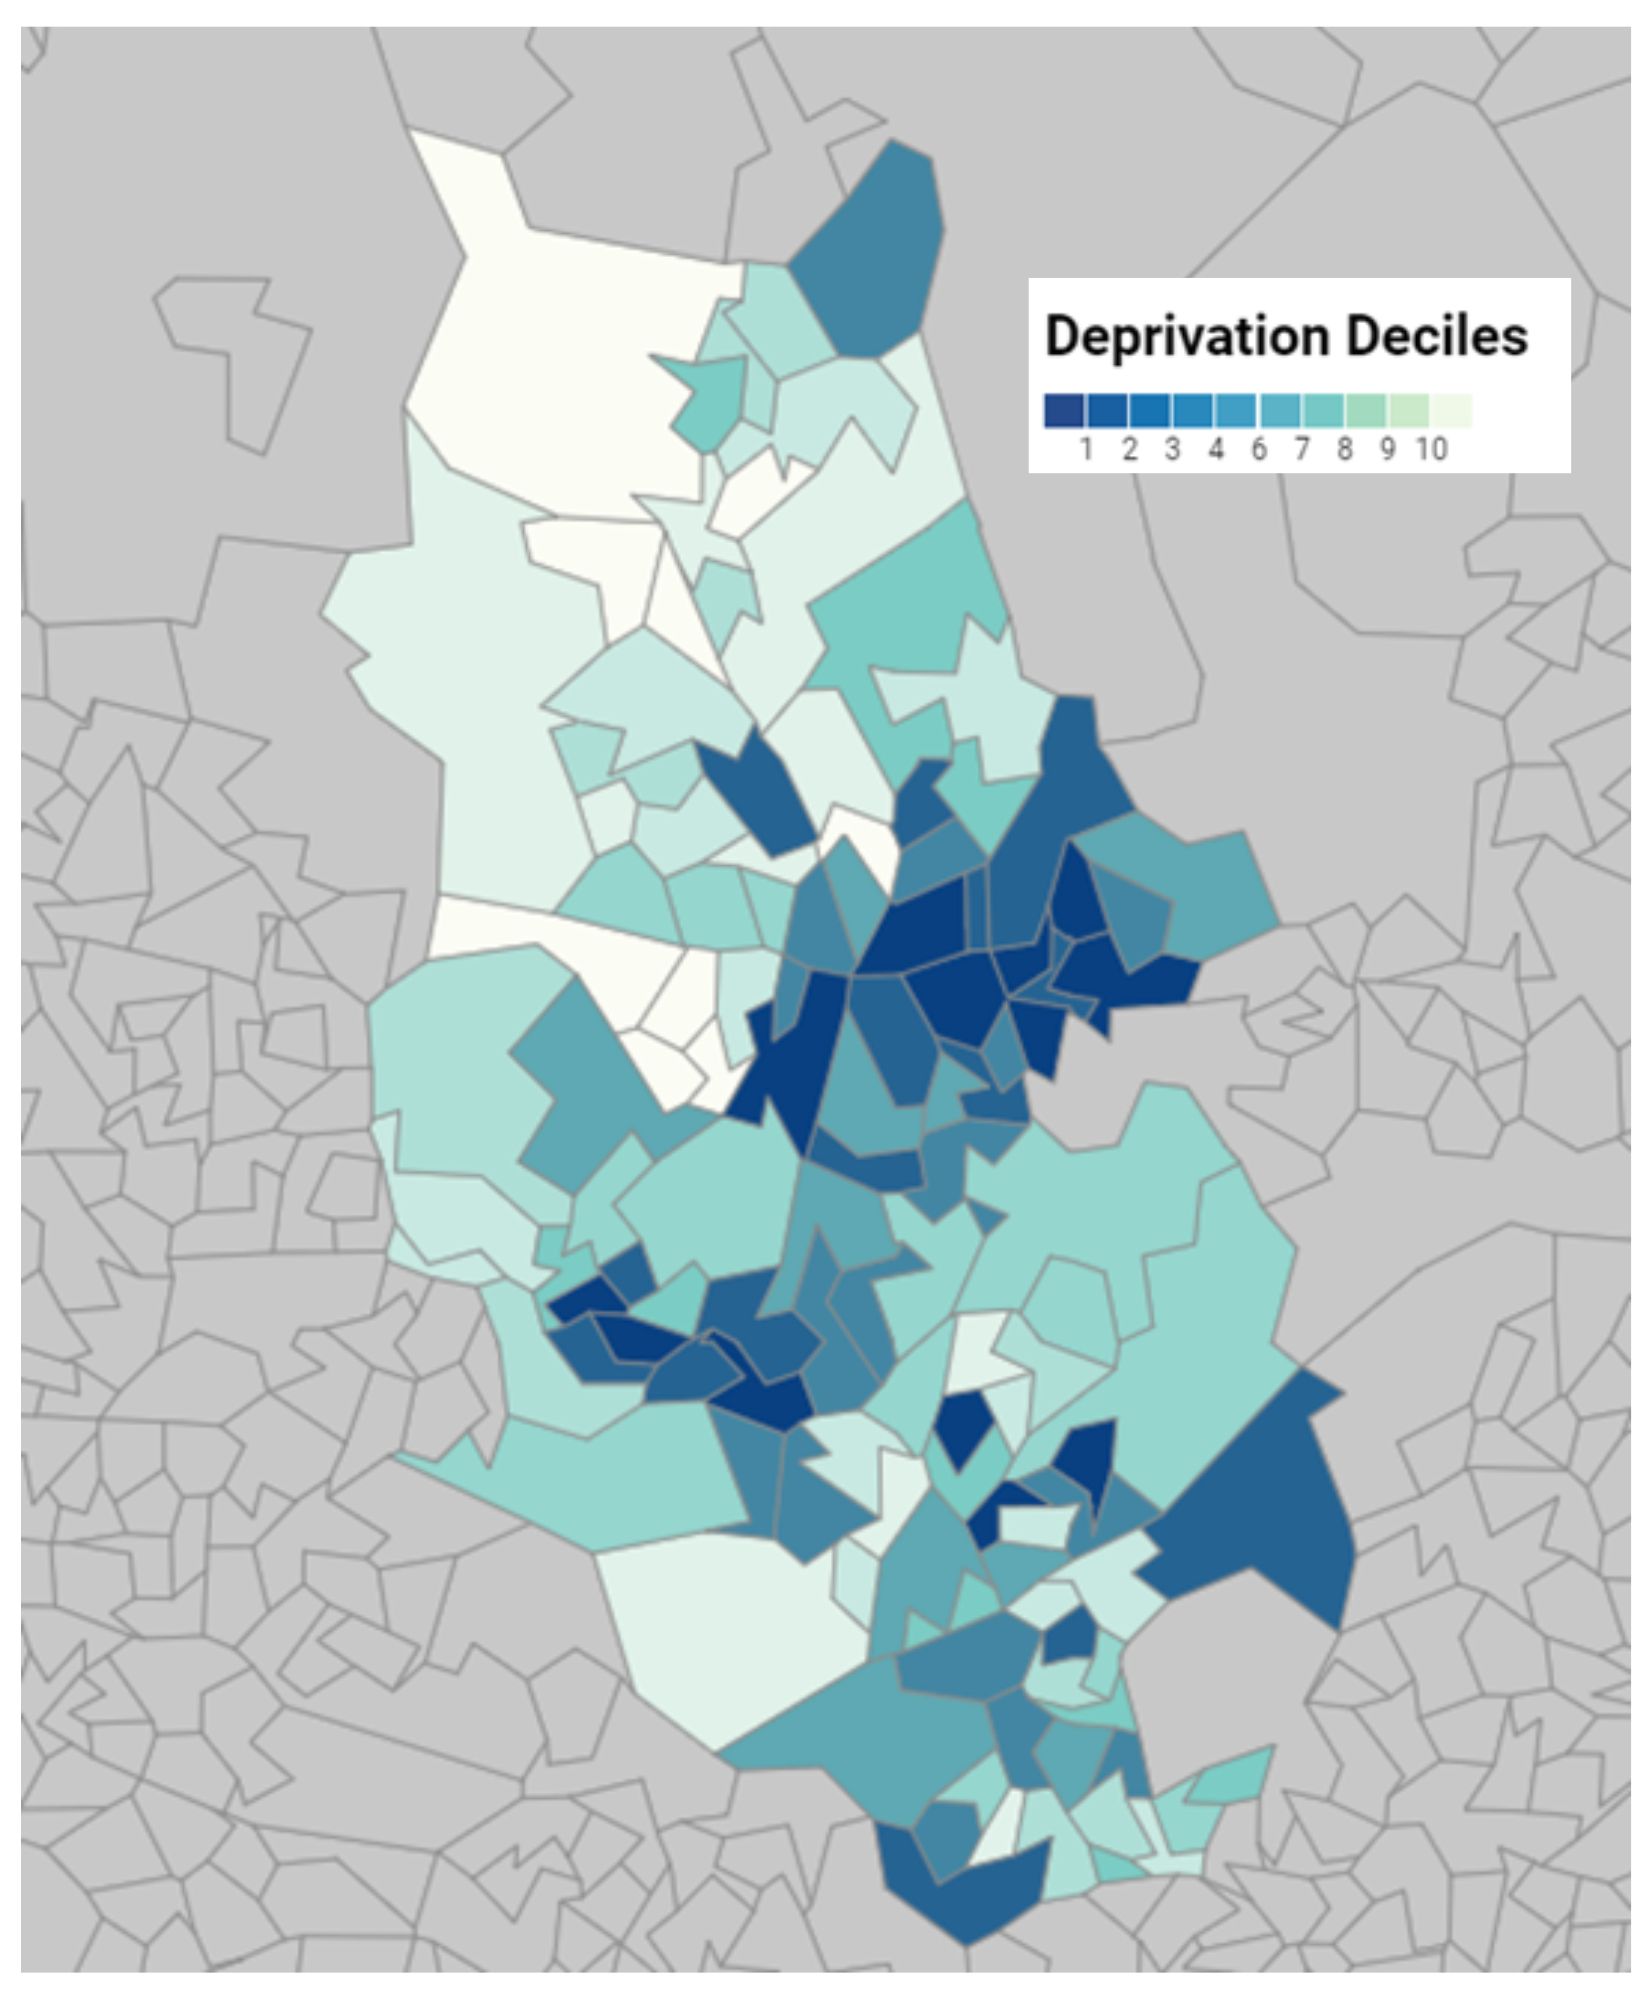
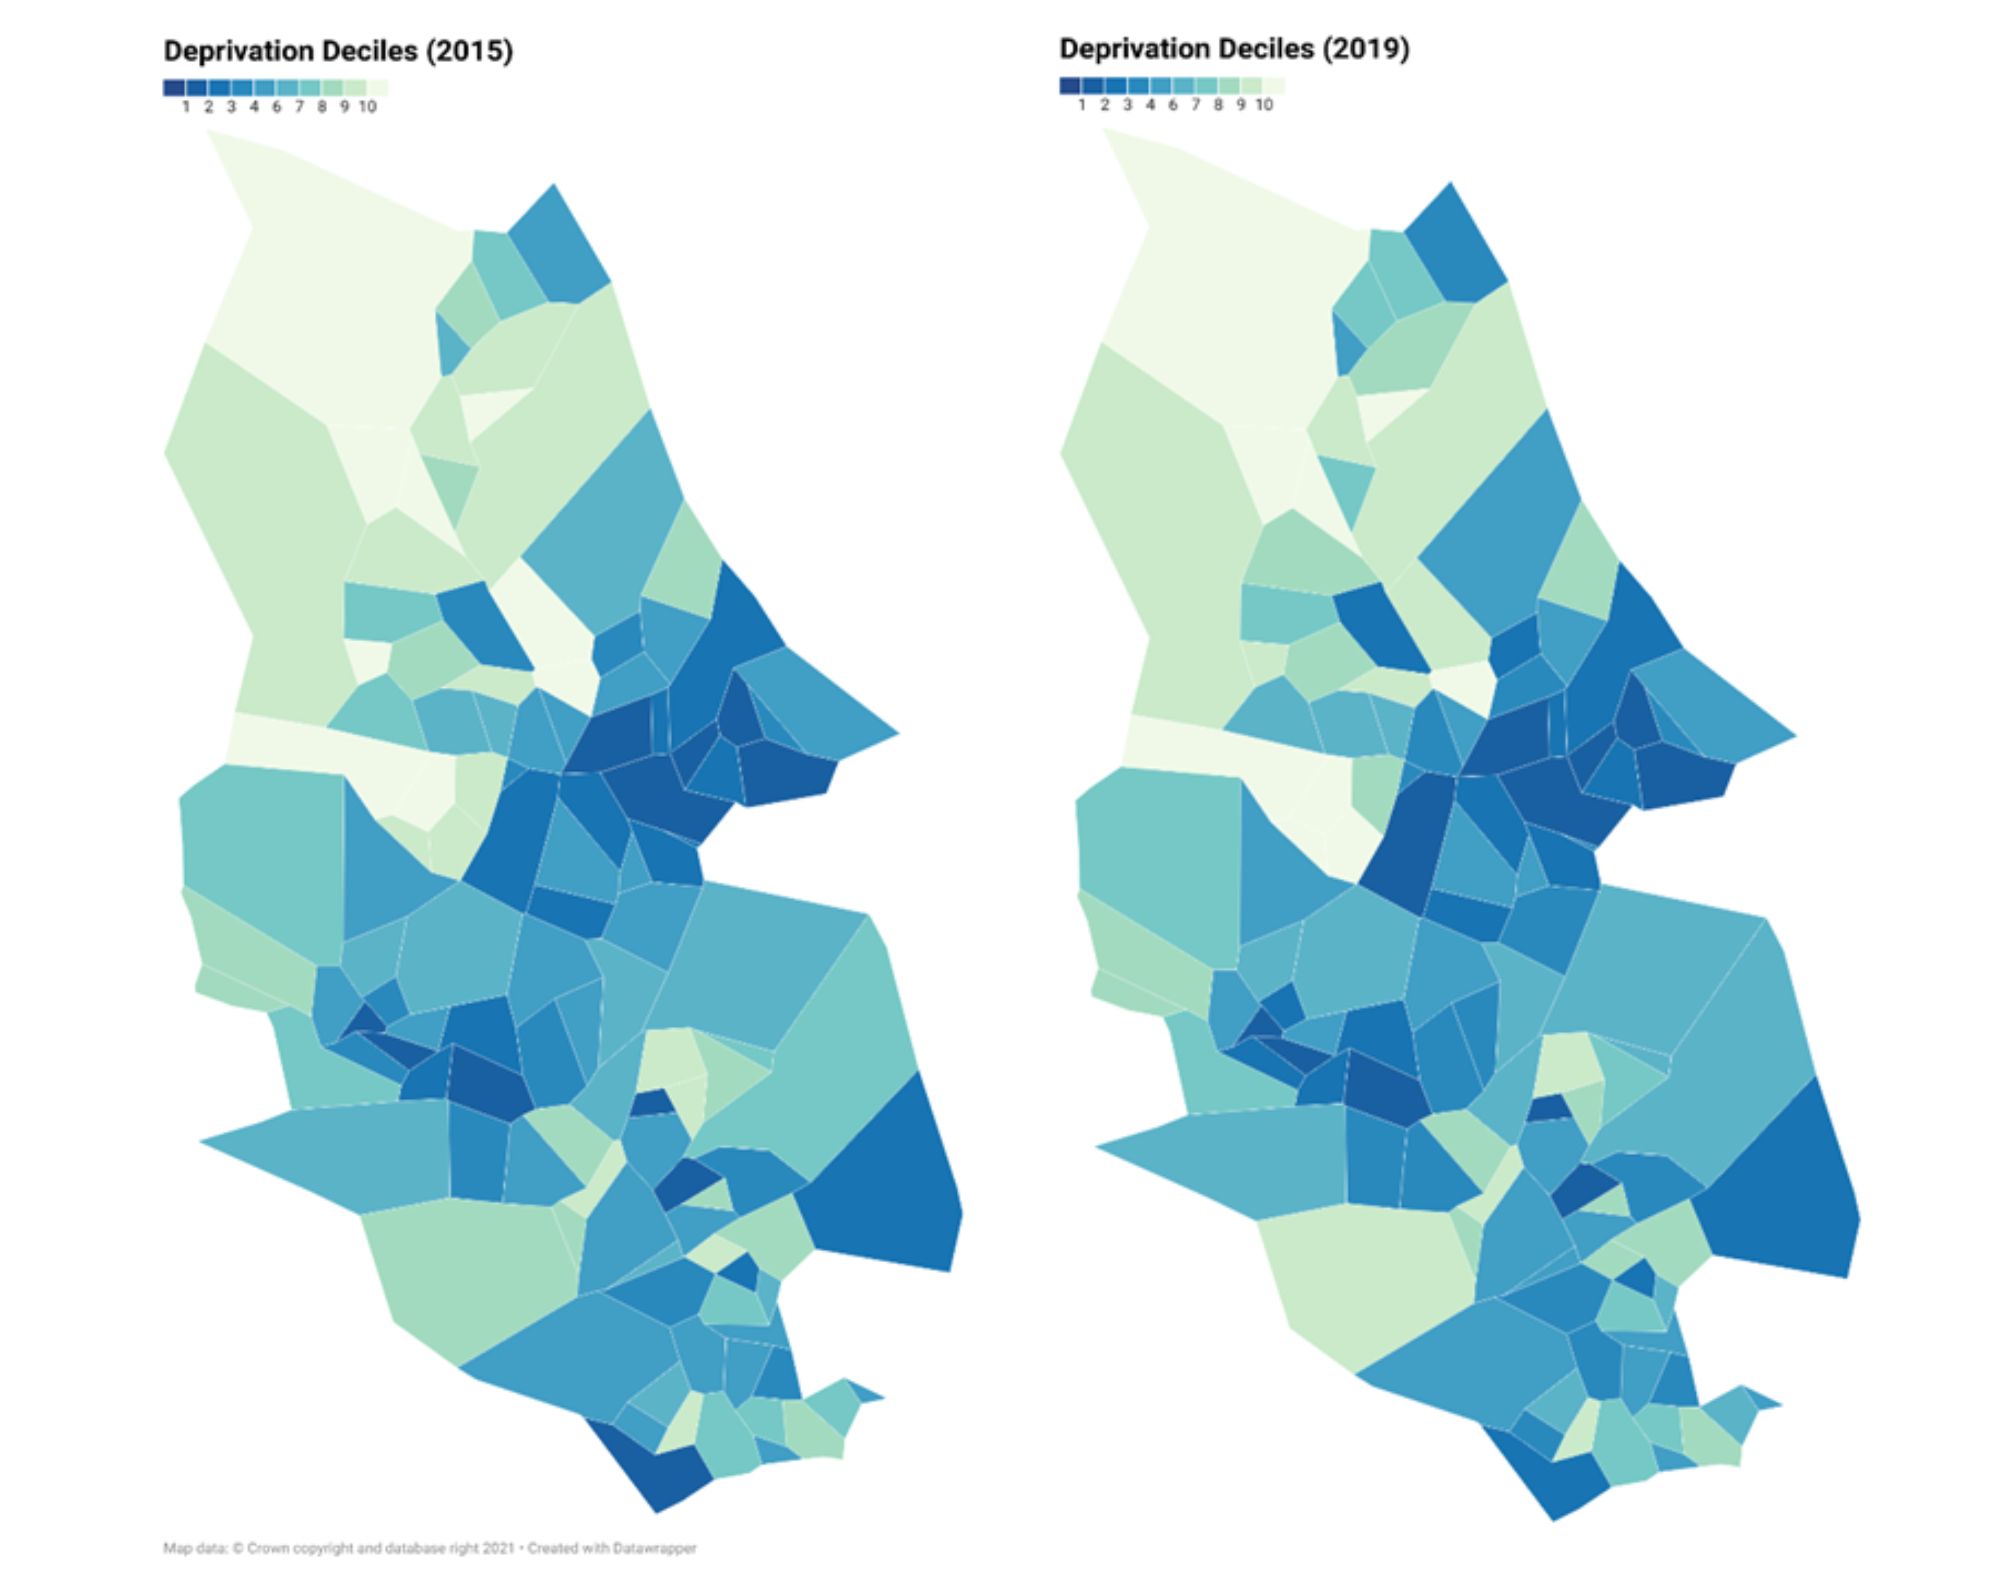
There are 120 LSOAs in Bury, and each has been ranked according to its deprivation score and grouped into national deciles. Map 1 below presents LSOAs in Bury showing their national deprivation decile based on ten groups ranging from ‘10% most deprived’ to ‘10% least deprived’ in England.
Map 1: LSOAs in Bury showing their national deprivation decile based on ten groups ranging from ‘10% most deprived’ (decile 1) to ‘10% least deprived’ (decile 10) in England.
-
 To download a copy of this map, please left click the button below or use the 'Related Files' section located at the bottom of the page.
The LSOA map highlights the limitations of examining deprivation data at the ward level as pockets of deprivation at small geographical areas are masked at ward level. identifying pockets of deprivation. There are 12 LSOAs in Bury that are in the 10% most deprived in the country (shown in dark blue on the map above). These are mostly found near Bury town centre, and in the Radcliffe and Besses areas (IMD 2019).
IMD Domains:
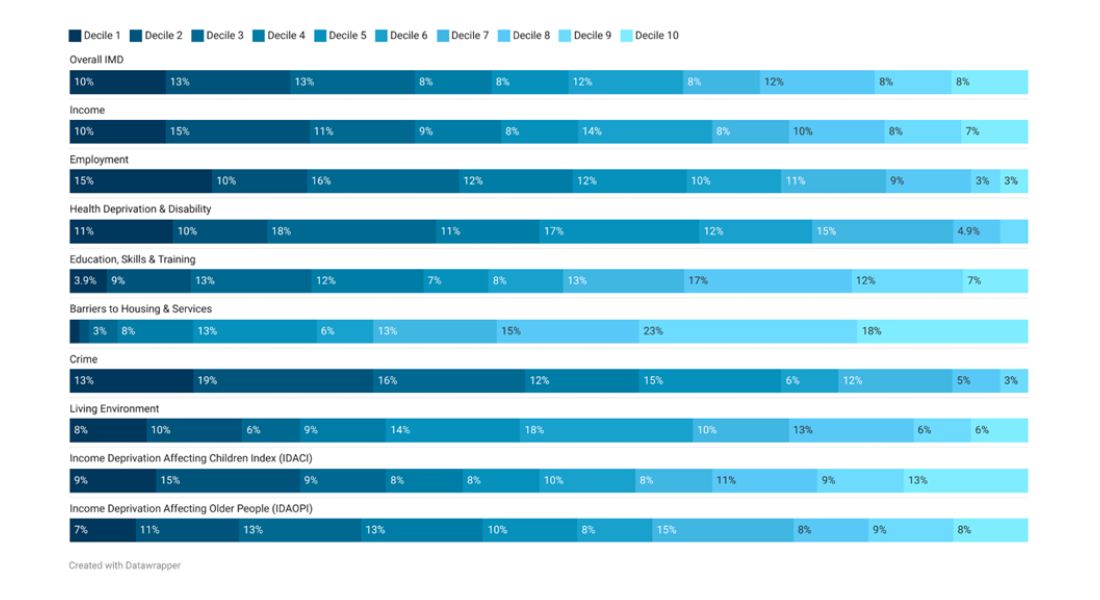
Data for IMD 2019 were analysed to present the proportion (%) of Bury LSOAs by deprivation decile for IMD domains and the supplementary indicators (Figure 4). Each individual bar totals to 100% and represents an IMD domain or supplementary indicator. For example, in the figure below, if we look at the first bar i.e overall IMD, we can see that from all LSOAs in Bury, 10% of LSOAs are in decile 1 (representing 10% of the most deprived LSOAs nationally), 13% of LSOAs are in decile 2 and so on. Since nationally 10% of LSOAs fall in each decile, Bury has slightly more of its LSOAs in decile 2 than the average for England.
Based on IMD 2019 data, LSOAs in Bury that are in the more deprived deciles in England, face relatively more deprivation for the crime, employment and health deprivation and disability domains compared with LSOAs in the lesser deprived deciles (Figure 4).
Figure 4: Proportion (%) of Bury LSOAs by deprivation decile for individual IMD domains and supplementary indices (decile 1 representing ‘10% most deprived’ to decile 10 representing ‘10% least deprived’ decile LSOAs nationally)
-
 To download a copy of this chart, please left click the button below or use the 'Related Files' section located at the bottom of the page.
Key insights from the data are as below:
Income deprivation broadly reflects the overall IMD pattern for Bury. The income domain has the highest proportion of Bury LSOAs in the most deprived decile (10% in decile 1) and the second most deprived decile (15% in decile 2).
There is a relatively high deprivation in the employment domain in Bury. Around 65% of the LSOAs in Bury are in the five most deprived deciles. This is worse than Bury’s overall deprivation profile.
Similar pattern is observed in the health deprivation and disability domain, where nearly two thirds of the LSOAs (67%) are in the five most deprived deciles. There are no LSOAs in the least deprived decile (decile 10) for this domain.
Education skills and Training domain has the lowest proportion of Bury LSOAs in the most deprived decile (3.9% in decile 1) and the highest in the 3rd least deprived decile (17%).
Barriers to Housing & Services are most prevalent in the least 50% deprived deciles (decile 6-10) compared to the most deprived deciles (decile 1-5), with 74% of LSOAs in decile 6-10 experiencing these barriers compared with 26% of LSOAs in decile 1-5. Additionally, only 5% of LSOAs in Bury fall in decile 1-3 for Barriers to Housing & Services compared with 56% of LSOAs falling in decile 8-10.
In the crime domain, three quarters (75%) of LSOAs fall within the 5 most deprived deciles, whereas there are no LSOAs in the least deprived decile.
The proportion of LSOAs that are amongst the most and least deprived 10% is relatively low in the Living Environment Domain, 8% and 6% respectively, with the majority featuring in the middle deciles.
Changes in IMD scores between 2015 and 2019
It is not possible to use the Indices to measure changes in the level of deprivation in places over time, however it is possible to explore changes in relative deprivation, or changes in the pattern of deprivation, between 2019 and previous updates of the Indices.
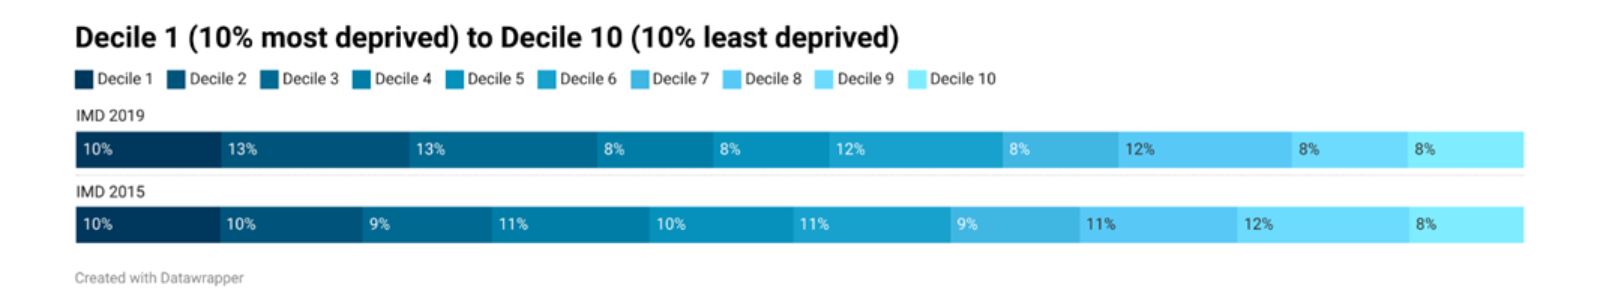
Overall, there has been relatively little change in the pattern of deprivation in Bury between IMD 2015 and IMD 2019. The proportion of Bury LSOAs in decile 1 and decile 10 have remained unchanged (Figure 5). However, there have been large changes in other deciles. The second and third most deprived decile have 3 and 5 more LSOAs respectively. There are 4 less LSOAs in decile 9.
Figure 5: Proportion of Bury LSOAs by national deprivation deciles 0 IMD 2019 and IMD 2015
-
 To download a copy of this chart, please left click the button below or use the 'Related Files' section located at the bottom of the page.
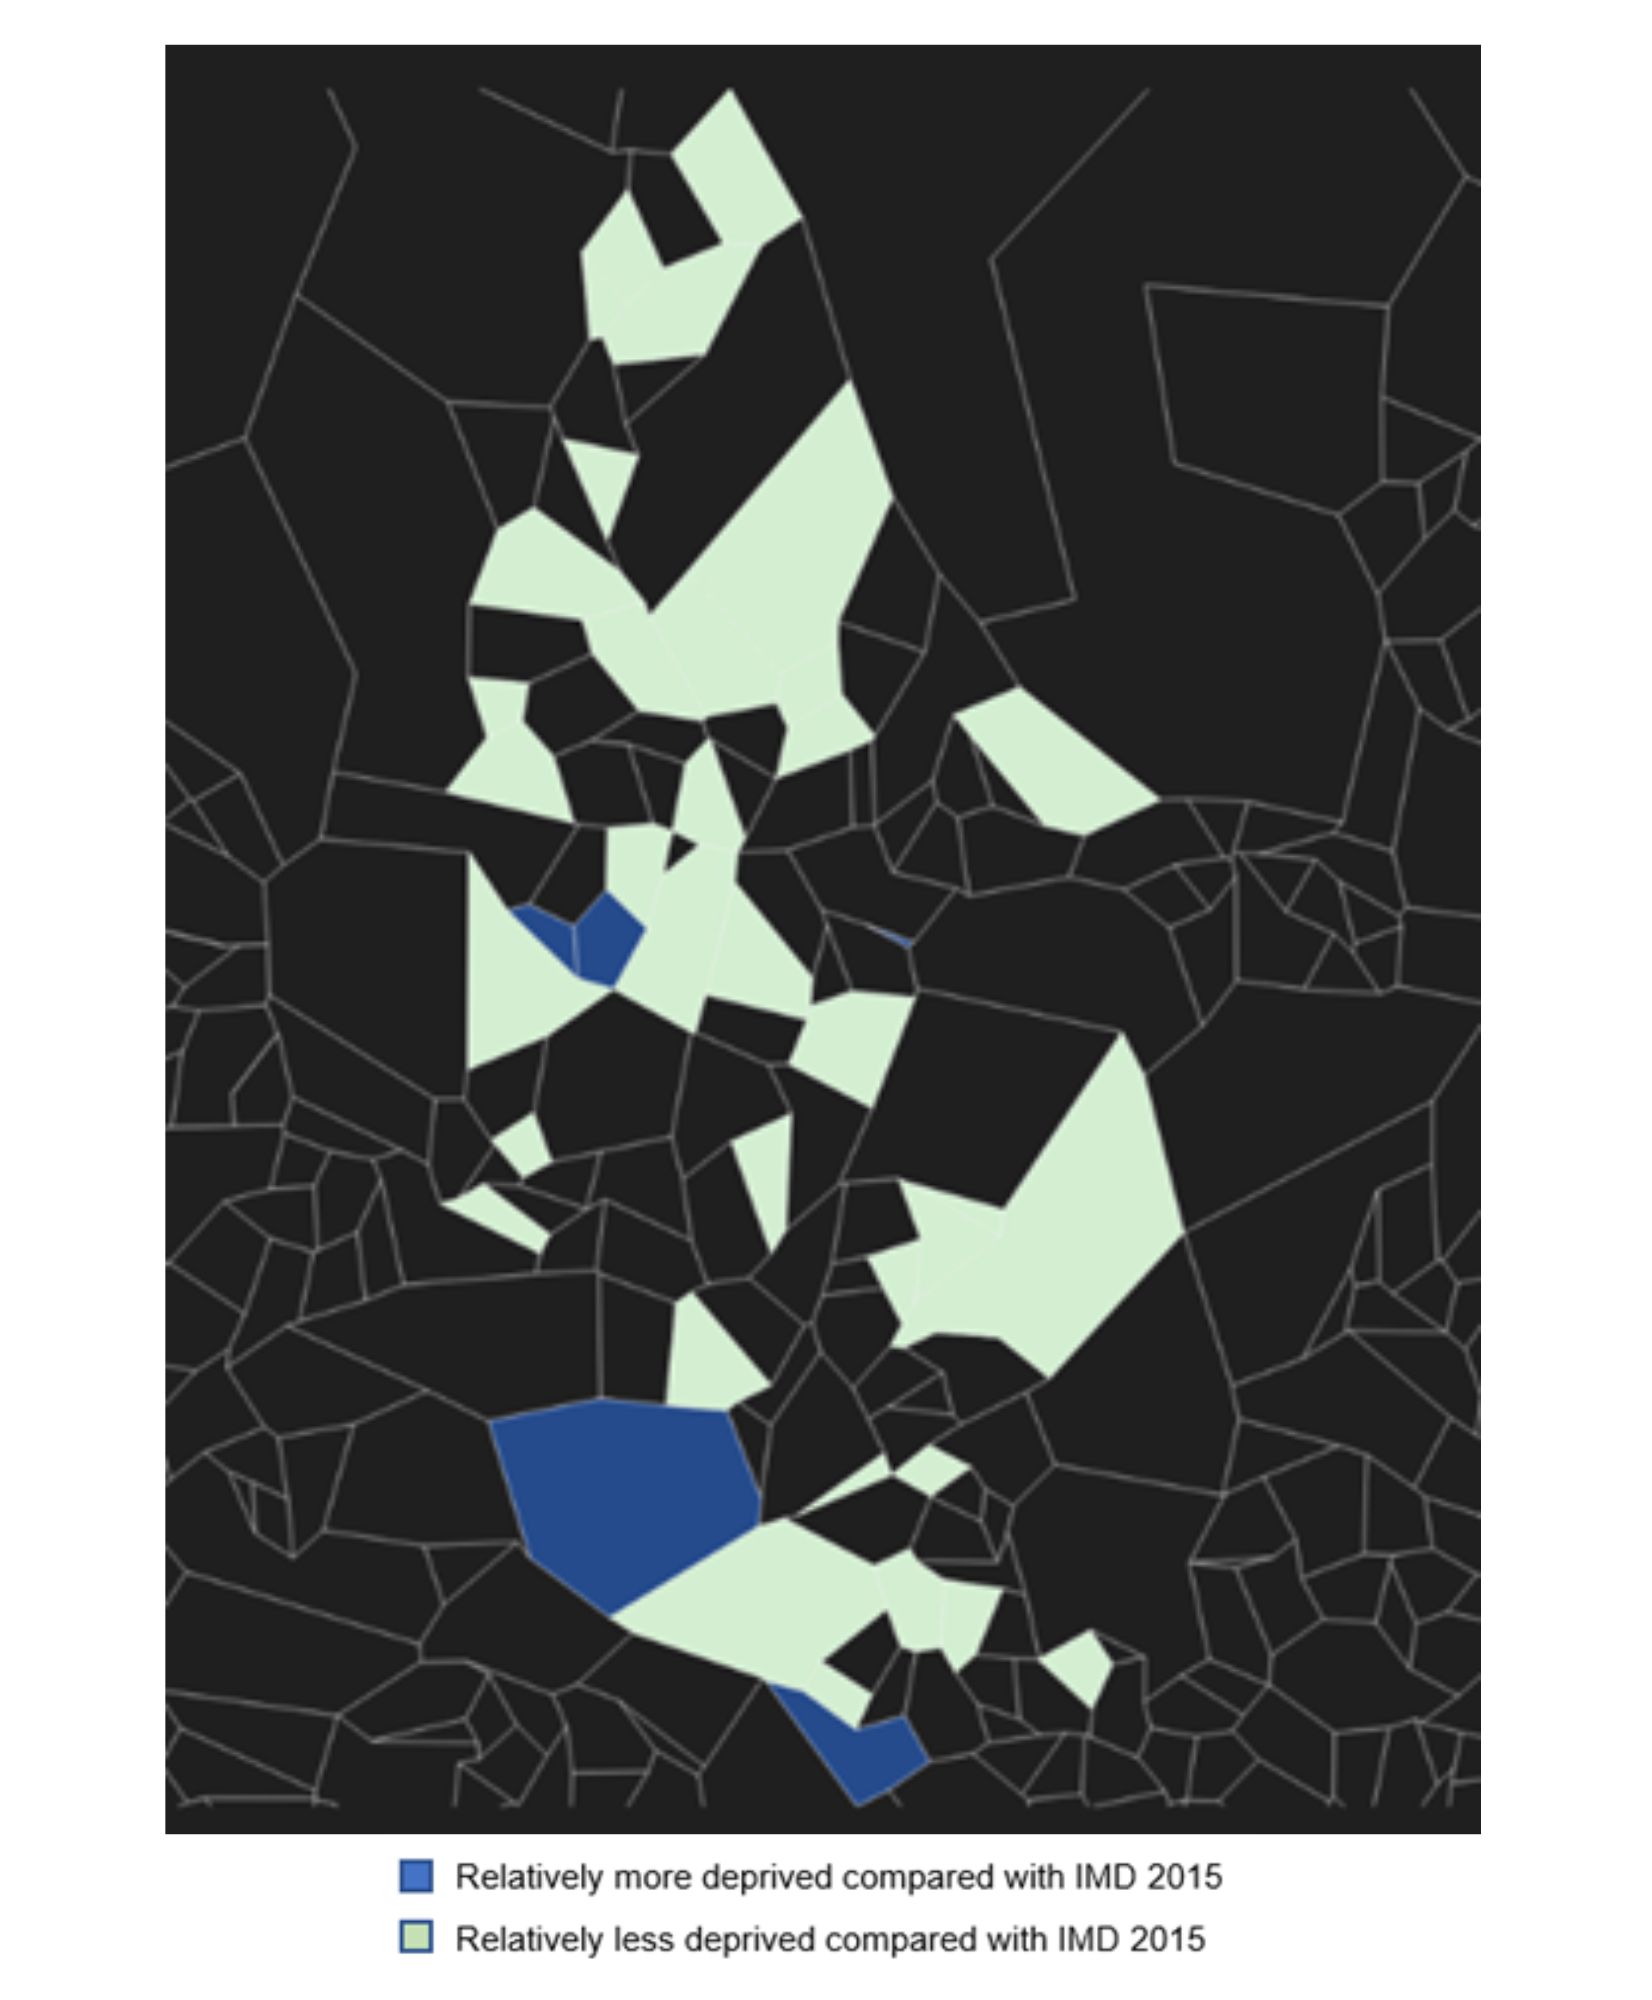
Examining changes across Bury, 4 LSOAs have become relatively more deprived (1 LSOA in St. Marys ward, 1 in Pilkington Park ward and 2 LSOAs in Church ward) and 35 LSOAs have become relatively less deprived (Map 2)
Map 2: Changes in relative deprivation by LSOAs comparing IMD 2015 and IMD 2019 (decile 1 representing ‘10% most deprived’ to decile 10 representing ‘10% least deprived’ decile LSOAs nationally)
-
 To download a copy of this map, please left click the button below or use the 'Related Files' section located at the bottom of the page.
For better visualisation of the changes Map 3 is presented below with dark blue colour denoting the LSAOs that have become relatively more deprived and light green denoting the LSOAs that have become relatively less deprived.
Map 3: LSOAs with changes in relative deprivation comparing IMD 2015 and IMD 2019
-
 To download a copy of this map, please left click the button below or use the 'Related Files' section located at the bottom of the page.
Please click here to access IMD 2019 LSOA Profiler Tool to examine IMD sub-domain data across Bury.