Education
Education
Education
Education
Children’s education and development of skills are important for their own wellbeing and for that of the nation as a whole.
Learning ensures that children develop the knowledge and understanding, skills, capabilities and attributes that they need for mental, emotional, social and physical wellbeing now and in the future.
Children with poorer mental health are more likely to have lower educational attainment and there is some evidence to suggest that the highest level of educational qualifications is a significant predictor of wellbeing in adult life; educational qualifications are a determinant of an individual's labour market position, which in turn influences income, housing and other material resources.
Wider Determinants of Health - Data - OHID (phe.org.uk)
Educational attainment is influenced by both the quality of education children receive and their family socio-economic circumstances. (Wider Determinants of Health - Data - OHID (phe.org.uk))
School readiness
This is the first publication since the 2021 to 2022 EYFS reforms were introduced in September 2021. As part of those reforms, the EYFS profile was significantly revised. It is therefore not possible to directly compare 2021 to 2022 assessment outcomes with earlier years. It is also the first release since the publication of the 2018 to 2019 statistics, as the 2019 to 2020 and 2020 to 2021 data collections were cancelled due to coronavirus (COVID19).
Figure 1: School readiness: percentage of children achieving a good level of development at the end of Reception
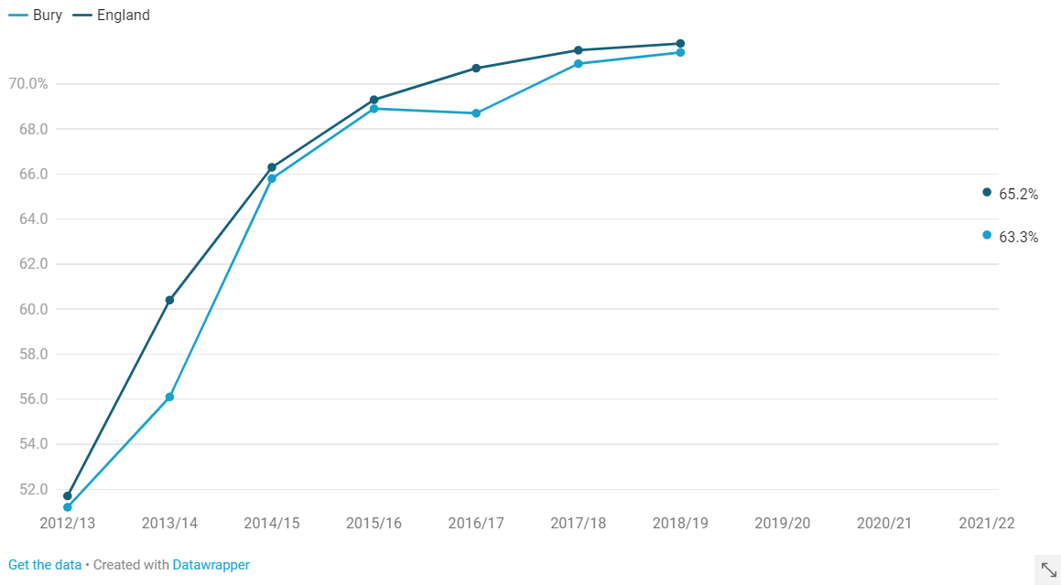
The figures for Bury are slightly lower than those for England for 2021/22 but the trend line above shows they have followed a similar pattern to that of England. In 2012/13 Bury recorded 51.2%, increasing in 2021/22 to 63.3%, an overall increase of 12.1%, which is similar to the England increase of 13.5%.
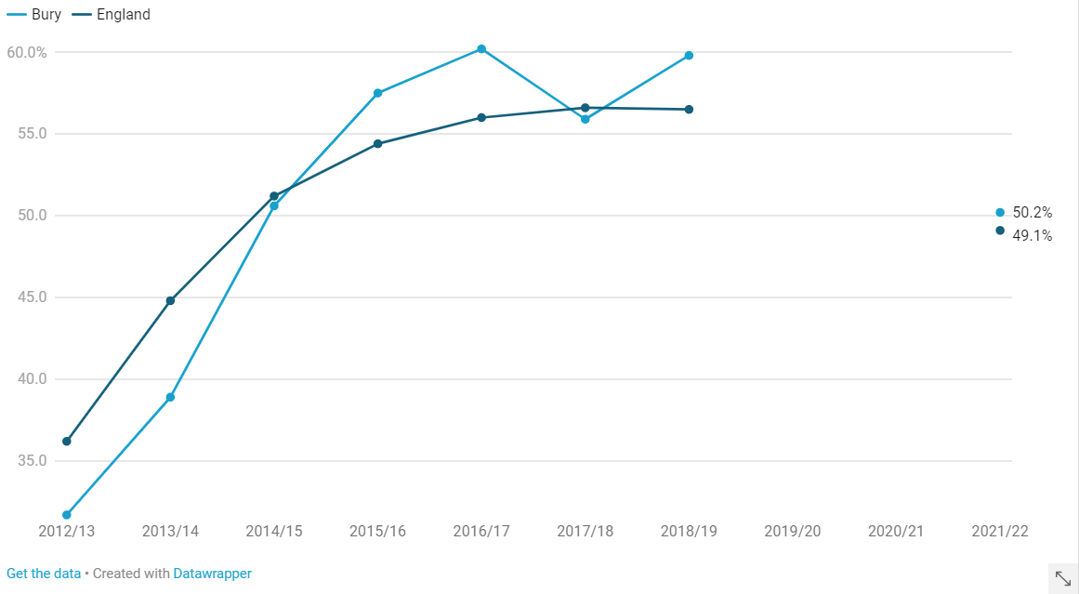
Figure 2: School Readiness: percentage of children with free school meal status achieving a good level of development at the end of Reception
This is a key measure of early years development across a wide range of developmental areas. Children from poorer backgrounds are more at risk of poorer development and the evidence shows that differences by social background emerge early in life.
Bury was initially performing worse than England (2012/13 and 2013/14) but has performed similar or better than England since 2014/15. In 2012/13 Bury recorded 31.7%, increasing in 2021/22 to 50.2%, an overall increase of 18.5% which is better than the England increase of 12.9%. Bury is comparable to England for 2021/22.
The Government recognises the benefits of providing a healthy school meal to the most disadvantaged pupils. The Education Act 1996 requires maintained schools and academies (including free schools) to provide free school meals to disadvantaged pupils who are aged between 5 and 16 years old.
Transitional protections were initially enacted with an end date of March 2022, the date the rollout of Universal Credit was due to end. When the end date moved to March 2023 the Government extended the protections in line with this date. As the rollout is continuing, the end date for transitional protections is being further extended to March 2025.
This means that pupils who were eligible on 1 April 2018, or who became eligible since then, continue to receive free meals, even if their household is no longer eligible under the benefits/low-earnings criteria, up until March 2025 and then until the end of their phase of education.
New applicants for free school meals on or after 1 April 2018, who are in receipt of Universal Credit and have earnings above the earned income threshold, will not therefore be eligible for free school meals.
Free school meals (publishing.service.gov.uk)
Phonics
These are the first phonics screening check and key stage 1 attainment statistics since 2019, after assessments were cancelled in 2020 and 2021 due to the pandemic.
Figure 3: School readiness: percentage of children achieving the expected level in the phonics screening check in Year 1
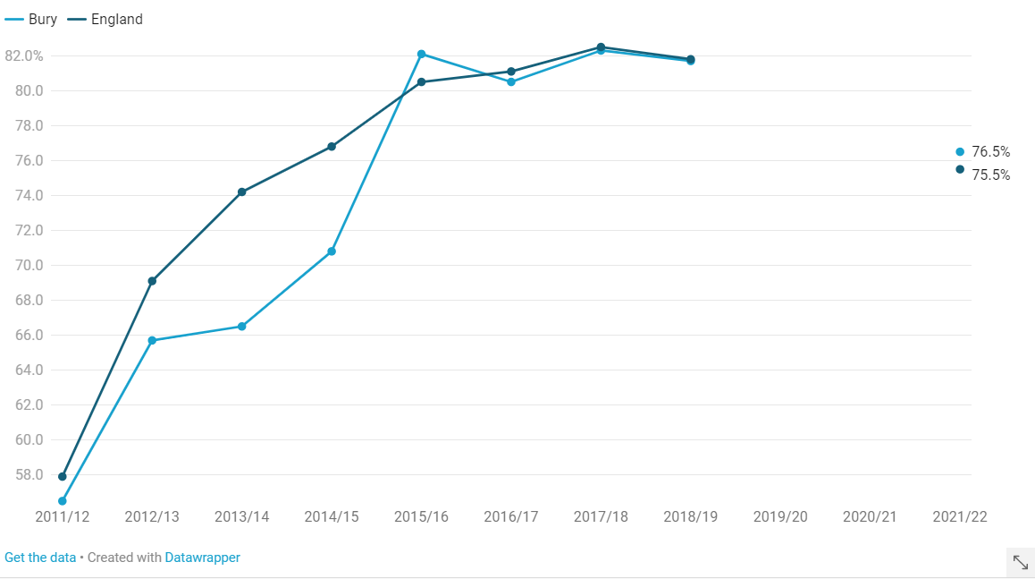
Bury had an overall increase of 20% from 2011/12 to 2021/22, higher than the 17.6% reported for England. The trend for Bury from 2015/16 to 2021/22 has been similar to that for England.
Figure 4: School readiness: percentage of children with free school meal status achieving the expected level in the phonics screening check in Year 1
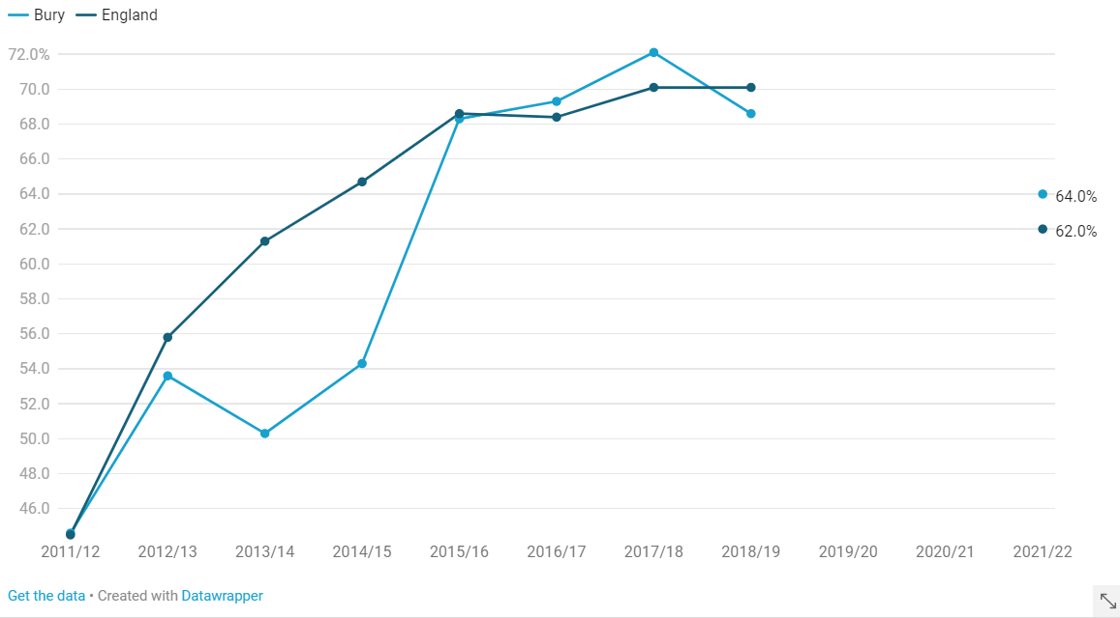
Bury had an overall increase of 20% from 2011/12 to 2021/22, higher than the 17.6% reported for England. The trend for Bury from 2015/16 to 2021/22 has been similar to that for England.
This is a key measure of early years development across a wide range of developmental areas. Children from poorer backgrounds are more at risk of poorer development and the evidence shows that differences by social background emerge early in life.
Average Attainment - GCSE
Due to the COVID-19 pandemic, the summer exam series was cancelled in 2020 and 2021. Pupils scheduled to sit GCSE and A/AS level exams in 2020 were awarded either a centre assessment grade (based on what the school or college believed the student would most likely have achieved had exams gone ahead) or their calculated grade using a model developed by Ofqual - whichever was the higher of the two.
Pupils scheduled to sit GCSE and A/AS level exams in 2021 were awarded a centre assessment grade.
The GCSE grades awarded to pupils in 2020 and 2021 will remain with them as they stay on in further and higher education or enter employment after leaving school. However, the cancellation of summer 2020 and 2021 GCSE exams and the new method of awarding grades has led to a set of pupil attainment statistics that are unlike previous years.
Trend charts are not displayed as the way GCSE grades were awarded changed during the Covid-19 pandemic. 2020 and 2021 data should not be directly compared to attainment data from previous years for the purposes of measuring changes in student performance.
The data measures the results of pupils at state-funded mainstream schools in England in 8 GCSE-level qualifications, known as ‘Attainment 8’.
Attainment 8 is a way of measuring how well pupils do in Key Stage 4, which they usually finish when they are 16 years old. It was a new secondary school accountability system introduced in 2016.
The 8 subjects which make up Attainment 8 include English and maths. Out of the remaining 6 subjects:
3 must come from qualifications that count towards the English Baccalaureate (EBacc), like sciences, language and history
3 qualifications can be either GCSE qualifications (including EBacc subjects) or technical awards from a list approved by the Department for Education
Each grade a pupil gets is assigned a point score from 9 (the highest) to 1 (the lowest). Each pupil’s Attainment 8 score is calculated by adding up the points for their 8 subjects, with English and maths counted twice. A school's Attainment 8 score is the average of all the scores of its eligible pupils.
Attainment 8 scores are rounded to 1 decimal place. The maximum score is 90.
Understanding school and college performance measures - GOV.UK (www.gov.uk)
Trend charts are not displayed as the way GCSE grades were awarded changed during the Covid-19 pandemic. 2020 and 2021 data should not be directly compared to attainment data from previous years for the purposes of measuring changes in student performance.
Table 1: Average Attainment 8 score (for all pupils at the end of Key Stage 4 in state-funded schools)
-
 Source: Department for Education and Office for Health Improvement and Disparities (OHID)
Bury is very similar to England for the year 2020/21 with scores of 50.0 and 50.9 respectively.
Table 2: Average Attainment 8 score, of children in care
-
 Source: Department for Education
Bury was worse than England in both 2020 and 2021 but has reduced the difference from 2.4 to 1.
Pupil Absence
Parents of children of compulsory school age (aged 5 to 15 at the start of the school year) are required to ensure that they receive a suitable education by regular attendance at school or otherwise. Education attainment is influenced by both the quality of education they receive and their family socio economic circumstances. Educational qualifications are a determinant of an individual's labour market position, which in turn influences income, housing and other material resources. These are related to health and health inequalities.
Improving attendance (that is, tackling absenteeism) in schools is crucial to the Government's commitment to increasing social mobility and to ensuring every child can meet their potential. Improving school attendance will require all services that work with young people to agree local priorities. This indicator should help achieve this and Bury has the same level of pupil absence as England for 2021/22.
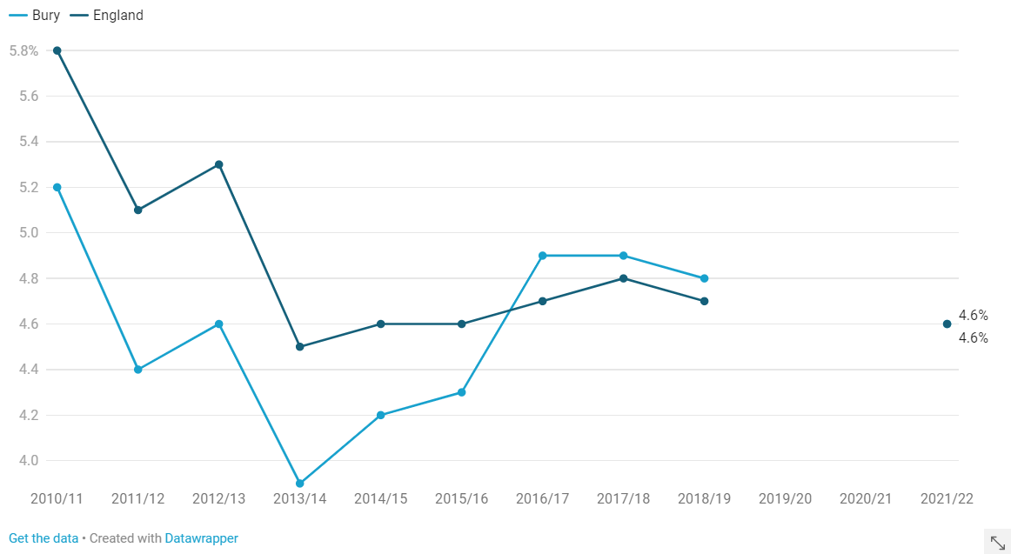
Figure 5: Pupil Absence
Statistics: pupil attendance and absence - GOV.UK (www.gov.uk)
Bury had lower pupil absence than England from 2010/11 to 2015/16, had higher pupil absence than England for 3 years from 2016/17 to 2018/19 but has now matched England in 2021/22.
Proportion of 16 to 17 year olds not in education, employment or training (NEET) or whose activity is not known.
Young people who are not in education, employment or training (NEET) are at greater risk of a range of negative outcomes, including poor health, depression or early parenthood. The indicator is included to encourage services to work together to support young people, particularly the most vulnerable, to engage in education, training and work.
The Government recognises that increasing the participation of young people in learning and employment not only makes a lasting difference to individual lives, but is also central to the Government's ambitions to improve social mobility and stimulate economic growth.
To support more young people to study and gain the skills and qualifications that lead to sustainable jobs and reduce the risk of young people becoming NEET, legislation was included in 2013 to raise the participation age as contained within the Education and Skills Act 2008. This required that from 2013 all young people remain in some form of education or training until the end of the academic year in which they turn 17.
From September 2016 Department for Education (DfE) relaxed the requirement on authorities to track academic age 18 year olds. Local authorities (LAs) are now only required to track and submit information about young people up to the end of the academic year in which they have their 18th birthday i.e. academic age 16 and 17 year olds.
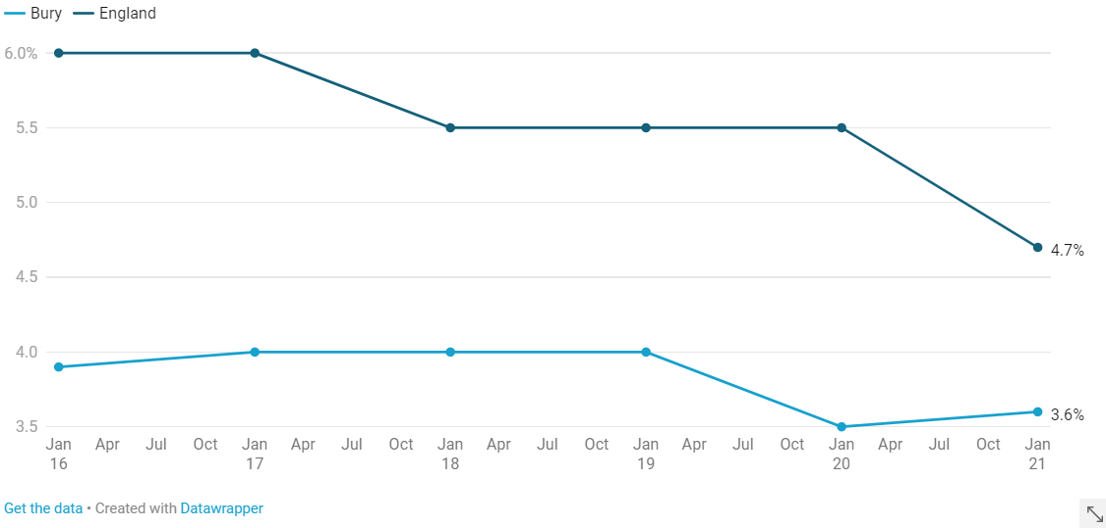
Figure 6: Proportion of 16 to 17 year olds not in education, employment or training (NEET) or whose activity is not known.
Statutory guidance: :https://www.gov.uk/government/publications/participation-of-young-people-education-employment-and-training
The DfE have changed the definition of NEET at the end of 2016 figures to include those young people whose activity is not known and shifted the period for which the average is made from November to January to December to February. As such these figures cannot be compared with NEET publications for previous years.
Bury has been consistently better than England in this measure for all reported years.
Links
The links below are to help with further action to reduce the impact of the wider determinants on health outcomes. The resources in the list include ideas, interventions and examples of good practice from a wide variety of sources.
Adult learning services, PHE, IHE
Building children and young people’s resilience in schools, PHE, IHE
Good quality parenting programmes and the home to school transition, PHE, IHE
Reducing the number of young people not in employment, education or training (NEET), PHE, IHE
Social and emotional wellbeing in early years, primary education and secondary education, NICE