Housing
Housing
Housing
Housing
Houses are more than physical structures providing shelter. They are homes – where we bring up our families, socialise with friends, our own space where we can unwind, keep our possessions safe and take refuge from the rest of the world. They’re where we spend most of our time. Housing conditions can influence our physical health (Health.org). For example, a warm and dry house can improve general health outcomes and specifically reduce respiratory conditions. However, housing also has a huge influence on our mental health and wellbeing – children living in crowded homes are more likely to be stressed, anxious and depressed, have poorer physical health, and attain less well at school.
Homelessness
Homelessness is associated with severe poverty and is a social determinant of health. It often results from a combination of events such as relationship breakdown, debt, adverse experiences in childhood and through ill health (Public Health Profiles). Homelessness is associated with poor health, education and social outcomes, particularly for children (The Impact of Homelessness on Health, LGA 2017).
The Homelessness Reduction Act (HRA) introduced new homelessness duties which meant significantly more households are being provided with a statutory service by local housing authorities than before the Act came into force in April 2018. The HRA introduced new prevention and relief duties, that are owed to all eligible households who are homeless or threatened with becoming homeless, including those single adult households who do not have ‘priority need’ under the legislation. As a result of the HRA, local authorities must provide temporary accommodation for households in a number of circumstances, which might include pending the completion of inquiries into an application, or they might spend time waiting in temporary accommodation after an application is accepted until suitable secure accommodation becomes available.
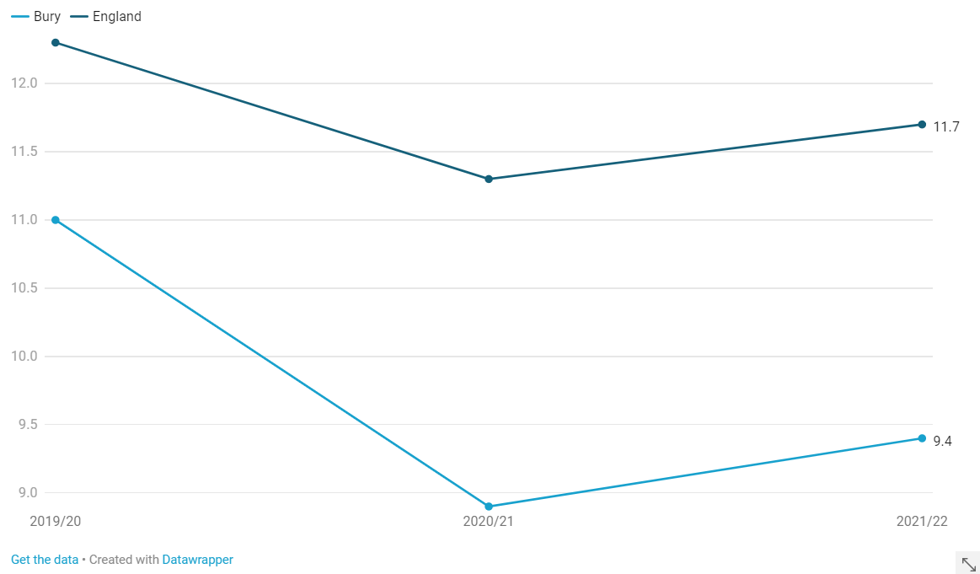
Bury continues to be significantly better than England for the rate of households owed a duty under the Homelessness Reduction Act, as illustrated in Figure 1 below. This refers to the crude rate per 1,000 of households owed a prevention or relief duty under the Homelessness Reduction Act (Public Health Profiles).
Figure 1: Homelessness: households owed a duty under the Homelessness Reduction Act, Crude rate - per 1,000, Bury and England, 2019/20 – 2021/22
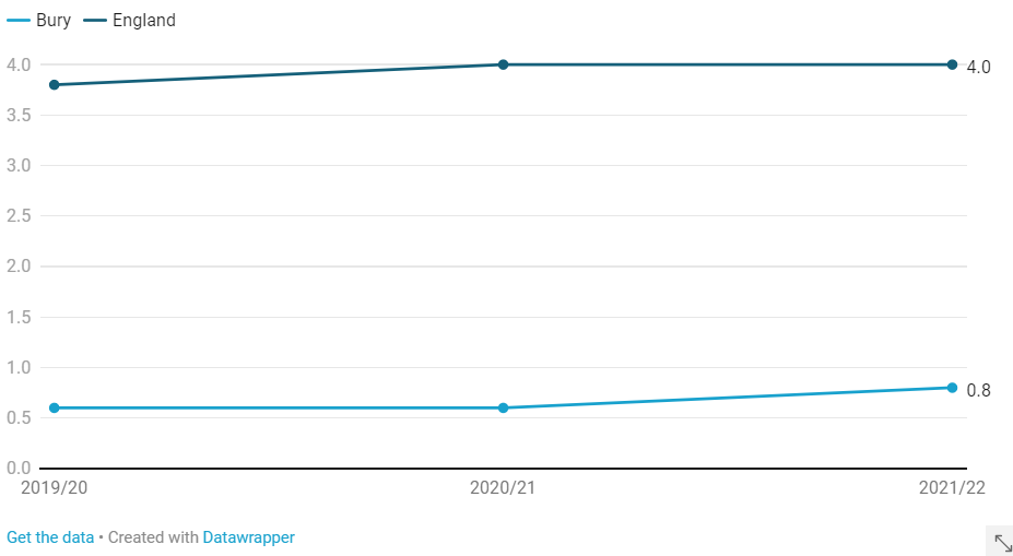
Bury also has maintained a significantly better rate of households in temporary accommodation when compared to the rate for England, as illustrated in Figure 2 below (Public Health Profiles).
Figure 2: Homelessness: households in temporary accommodation, Crude rate - per 1,000, Bury and England, 2019/20 – 2021/22
Barriers to Housing
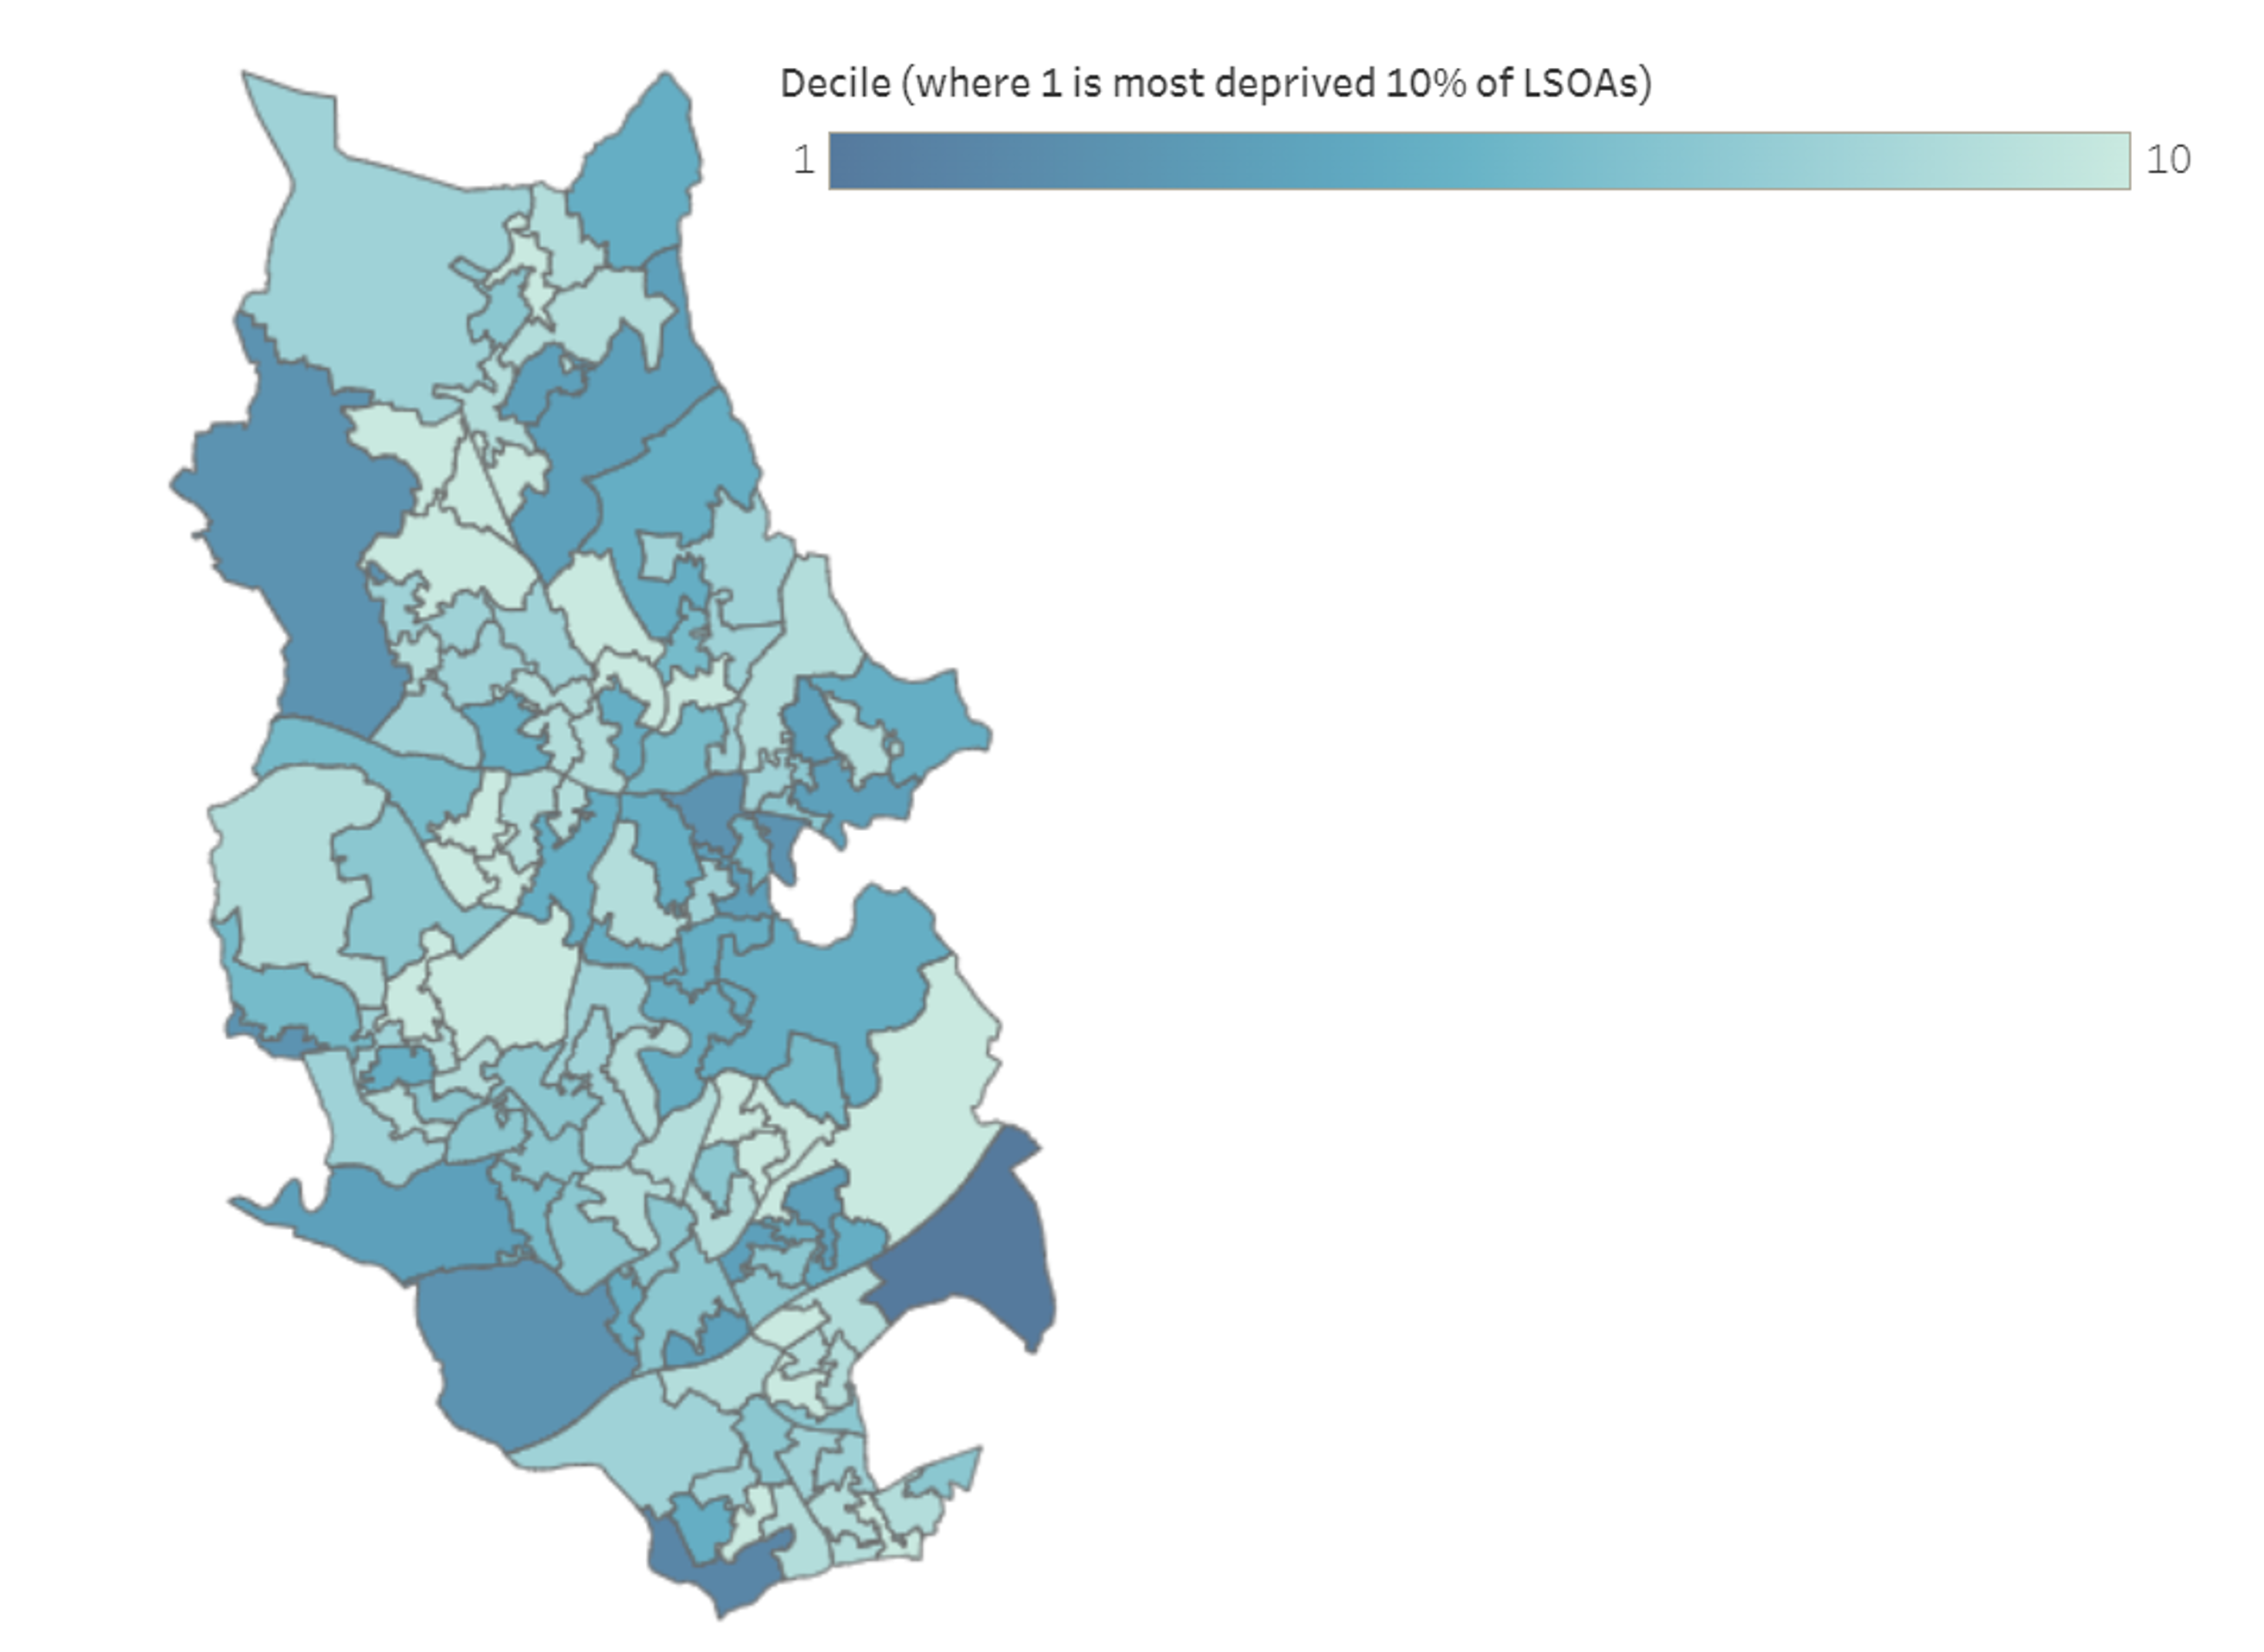
In the Index of Multiple Deprivation (IMD), one of the domains is Barriers to Housing and Services. This domain measures the physical and financial accessibility of housing and local services. The indicators fall into two sub-domains: ‘geographical barriers’, which relate to the physical proximity of local services, and ‘wider barriers’ which includes issues relating to access to housing such as affordability and homelessness. In Bury, Barriers to Housing and Services are most prevalent in the least 50% deprived deciles (decile 6-10) compared to the most deprived deciles (decile 1-5), with 74% of Lower Super Output Areas (LSOAs) in decile 6-10 experiencing these barriers compared with 26% of LSOAs in decile 1-5. Additionally, only 5% of LSOAs in Bury fall in decile 1-3 for Barriers to Housing & Services compared with 56% of LSOAs falling in decile 8-10 (IMD 2019). Map 1 below illustrates the Barriers to Housing and Services domain by deciles of the 2019 IMD for LSOAs in Bury, where decile 1 is the most deprived and 10 the least deprived. The interactive IMD map which covers all of the domains can be accessed online here.
Map 1: IMD 2019 – Barriers to Housing and Services domain by LSOA in Bury
Housing Quality
Bury has the same level of fuel poverty (13.2%) as England for 2020 (Public Health Profiles). This is based on the low income, low energy efficiency methodology where a household is considered to be fuel poor if they are living in a property with a fuel poverty energy efficiency rating of band D or below, and when they spend the required amount to heat their home, they are left with a residual income below the official poverty line. Bury has the fourth lowest rate of fuel poverty when compared to its statistical neighbours (Public Health Profiles).
Availability of suitable housing is an important social issue as living in overcrowded conditions can have impacts on both physical and mental health. Bury has a significantly better percentage of households that are overcrowded when compared to the proportion in England for 2011, as illustrated in Table 1 below.
Table 1: Households with overcrowding based on overall room occupancy levels, Proportion - %, Bury and England, 2011

This refers to the percentage of households with 1 or more rooms too few for the level of occupancy. Occupancy rating provides a measure of whether a household's accommodation is overcrowded or under occupied. There are two measures of occupancy rating, one based on the number of rooms in a household's accommodation, and one based on the number of bedrooms. This indicator looks at the overall number of rooms rather than just bedrooms. The ages of the household members and their relationships to each other are used to derive the number of rooms they require, based on a standard formula (Public Health Profiles).
According to the 2021 census, 66.9% of residents in Bury own their house. Table 2 below illustrates the proportion of houses by tenure (Nomis - Census 2021).
Table 2: Housing tenure, Bury and England, Census 2021

The Local Authority Housing Statistics for 2021-22 show that in Bury there are 7,533 Local Authority owned dwellings, with 7,454 of these being social rent and 79 being affordable rent.
Links