Infancy and Early Years (Birth to age 5 years)
Infancy and Early Years (Birth to age 5 years)
Infancy and Early Years (Birth to age 5 years)
Early years (particularly birth to three years) are one of the most important periods in the life course, with experiences during this critical period laying the foundation for all future learning, health and behaviour. Due to greater neuroplasticity, early life is a sensitive window of opportunity in which the quality of the environment and experience can shape the quality of the brain development.
Adverse childhood experience during the early years can lead to neurodevelopment disruptions and impact adult outcomes including poor mental health, lower immunity, diseases including CVD and diabetes. However, not all adverse childhood experiences impact in the long term. Positive stress such as having a vaccine or going for first day of preschool is a normal adverse experience and a child can recover from it very quickly. Tolerable stress is cause by temporary adverse events buffered by supportive relationships such as grief. However, it is toxic prolonged stress such as abuse, chronic hunger, neglect and lack of services that not only impacts the learning and development but adult mental and physical health.
In this section we will present publicly available data on key infancy and early years indicators.
Child Poverty
Growing up in poverty is detrimental to children's health and well-being, affecting their future health and life chances. It is essential to provide a healthy environment for children, especially during their early years. There is a substantial body of evidence connecting adverse childhood circumstances to poor child health outcomes and future adult illness. Child poverty in England is measured by the Income deprivation affecting children index (IDACI) that measures the percentage of all children aged 0 to 15 living in income deprived families. It is a subset of the Income Deprivation Domain which measures the proportion of the population in an area experiencing deprivation relating to low income. The definition of low income used includes both those people that are out-of-work, and those that are in work but who have low earnings (and who satisfy the respective means tests).
Homelessness is another measure associated with severe poverty and is a social determinant of health. It often results from a combination of events such as relationship breakdown, debt, adverse experiences in childhood and through ill health. Homelessness is associated with poor health, education and social outcomes, particularly for children.
Income deprivation affecting children index
Based on the most recent data from 2019, 16.9% of children live in poverty, similar (statistically significant) to England average of 17.1%. No trend data are available for Bury and England. Bury has the 4th lowest percentage of children living in poverty with the lowest percentage in Stockport of 14.6% and highest in St. Helens at 23.7%. Data on inequalities are only available by geography and at the Ward and MSOA levels.
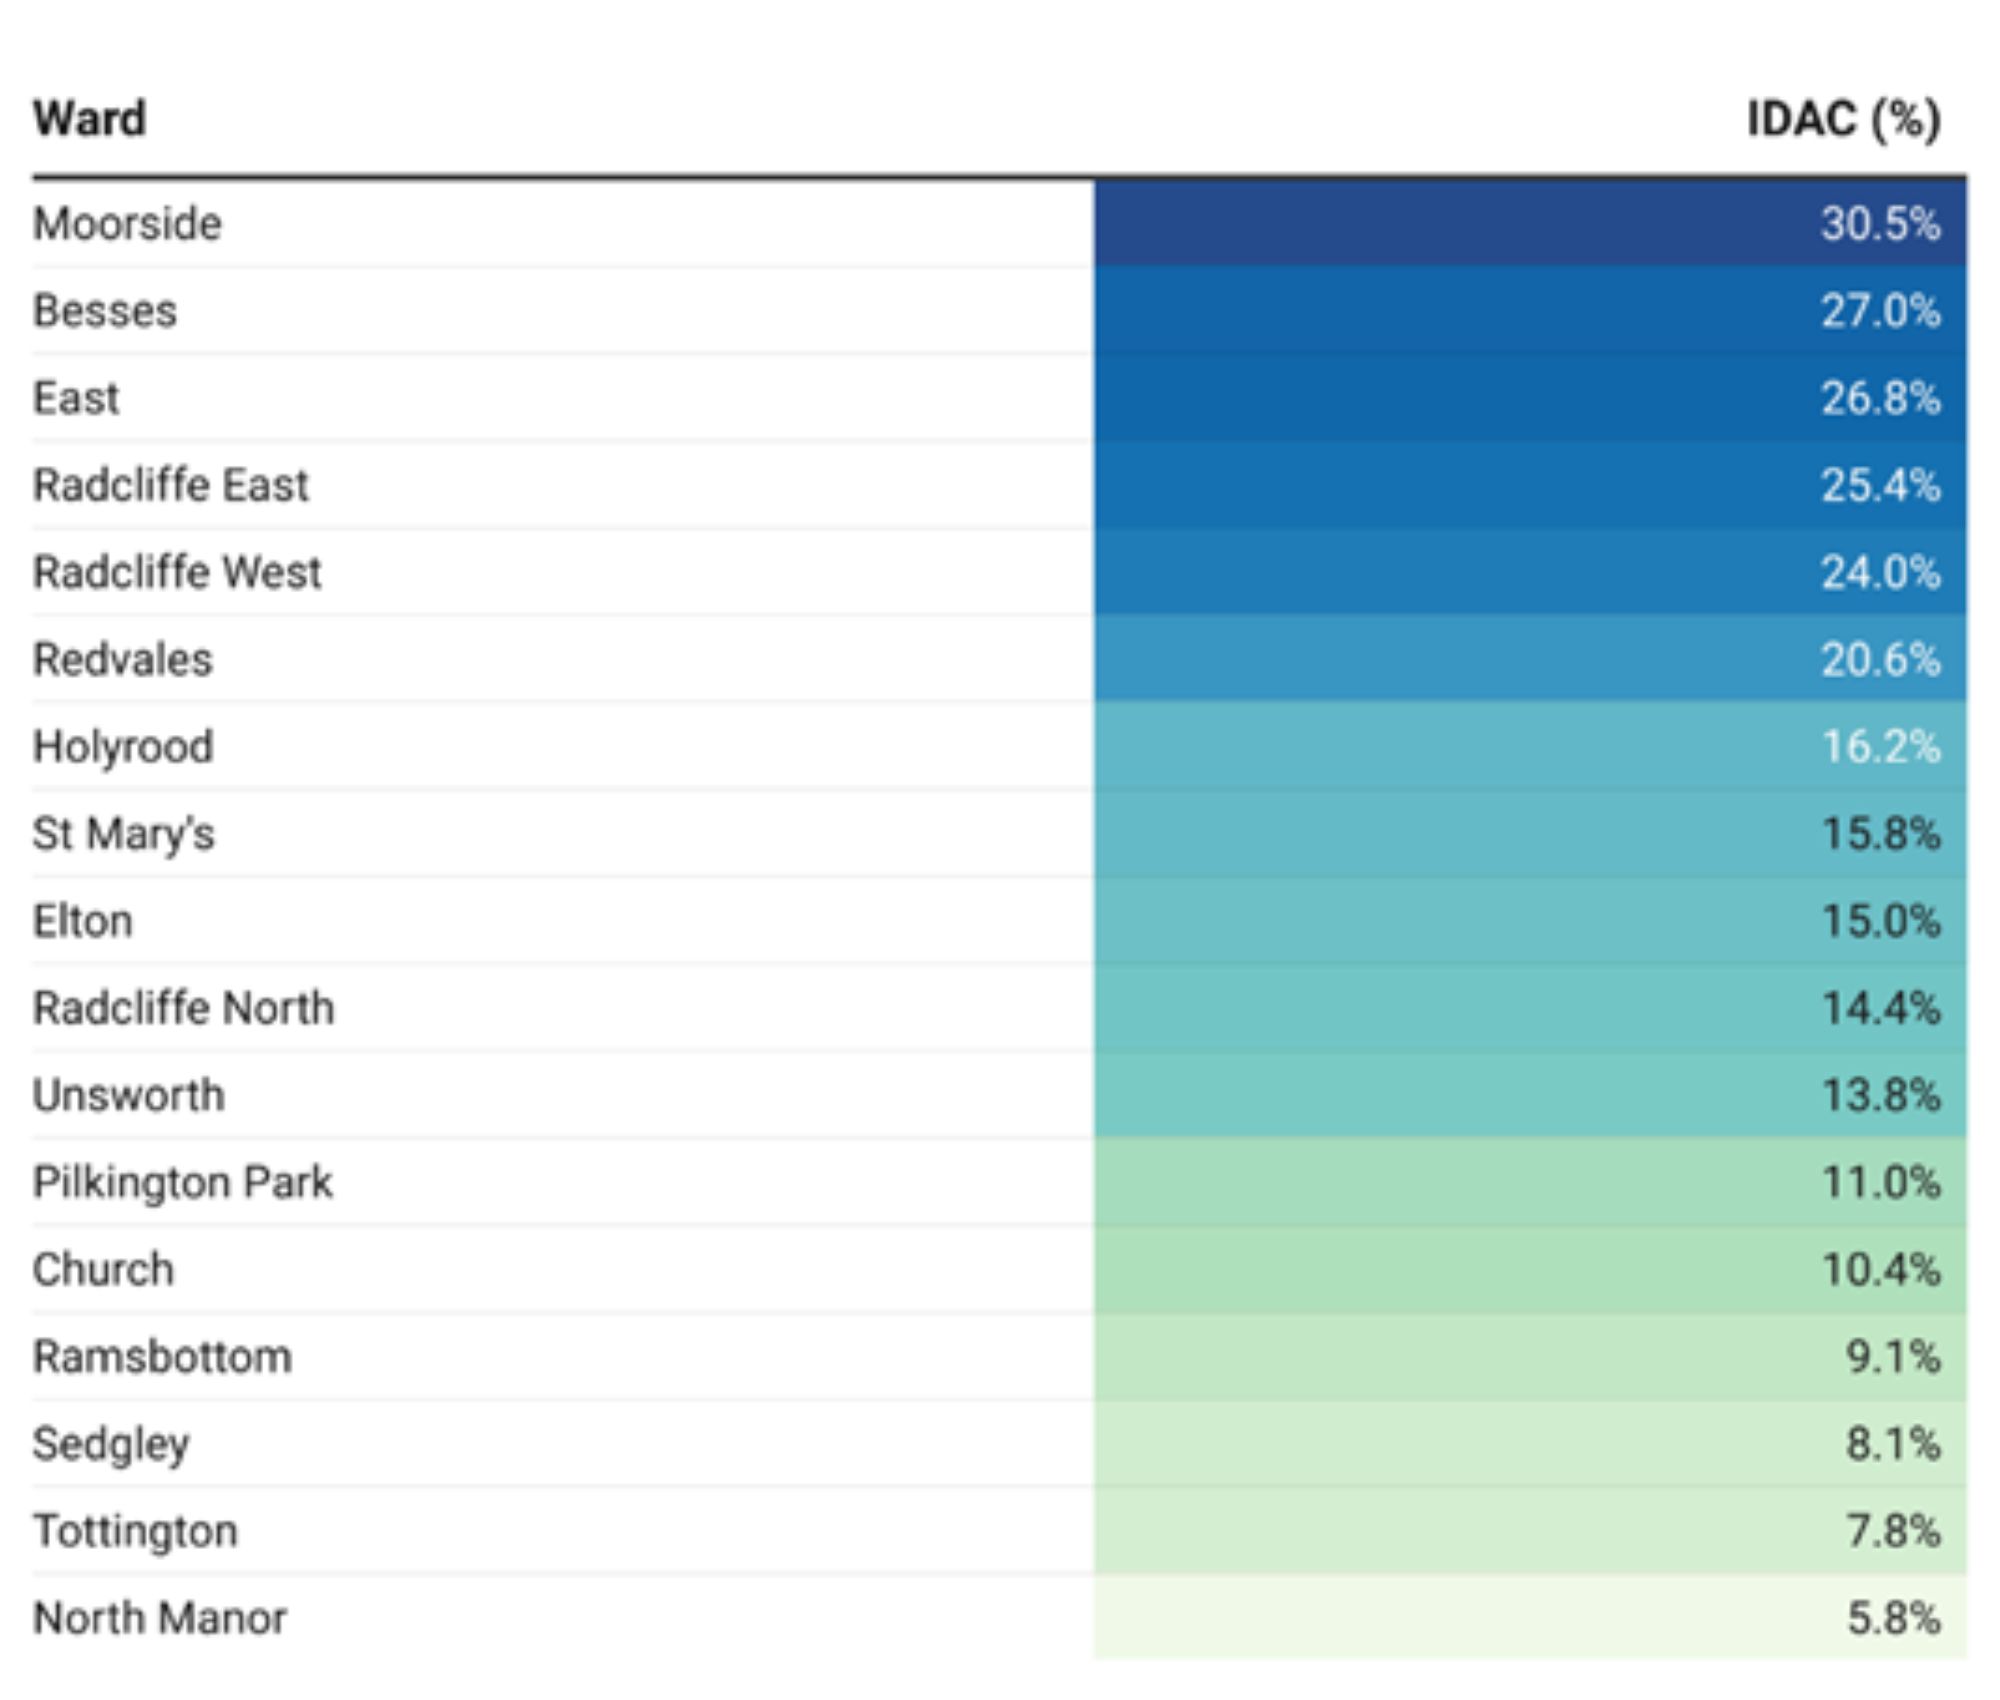
Examining inequalities in IDACI by Bury wards, the highest proportion of children living in poverty are in Moorside (30.5%) and Besses (27%) and lowest in North Manor (5.8%) (Table 1)
Table 1: Child poverty (Income deprivation affecting children %) in Bury wards for the year 2019
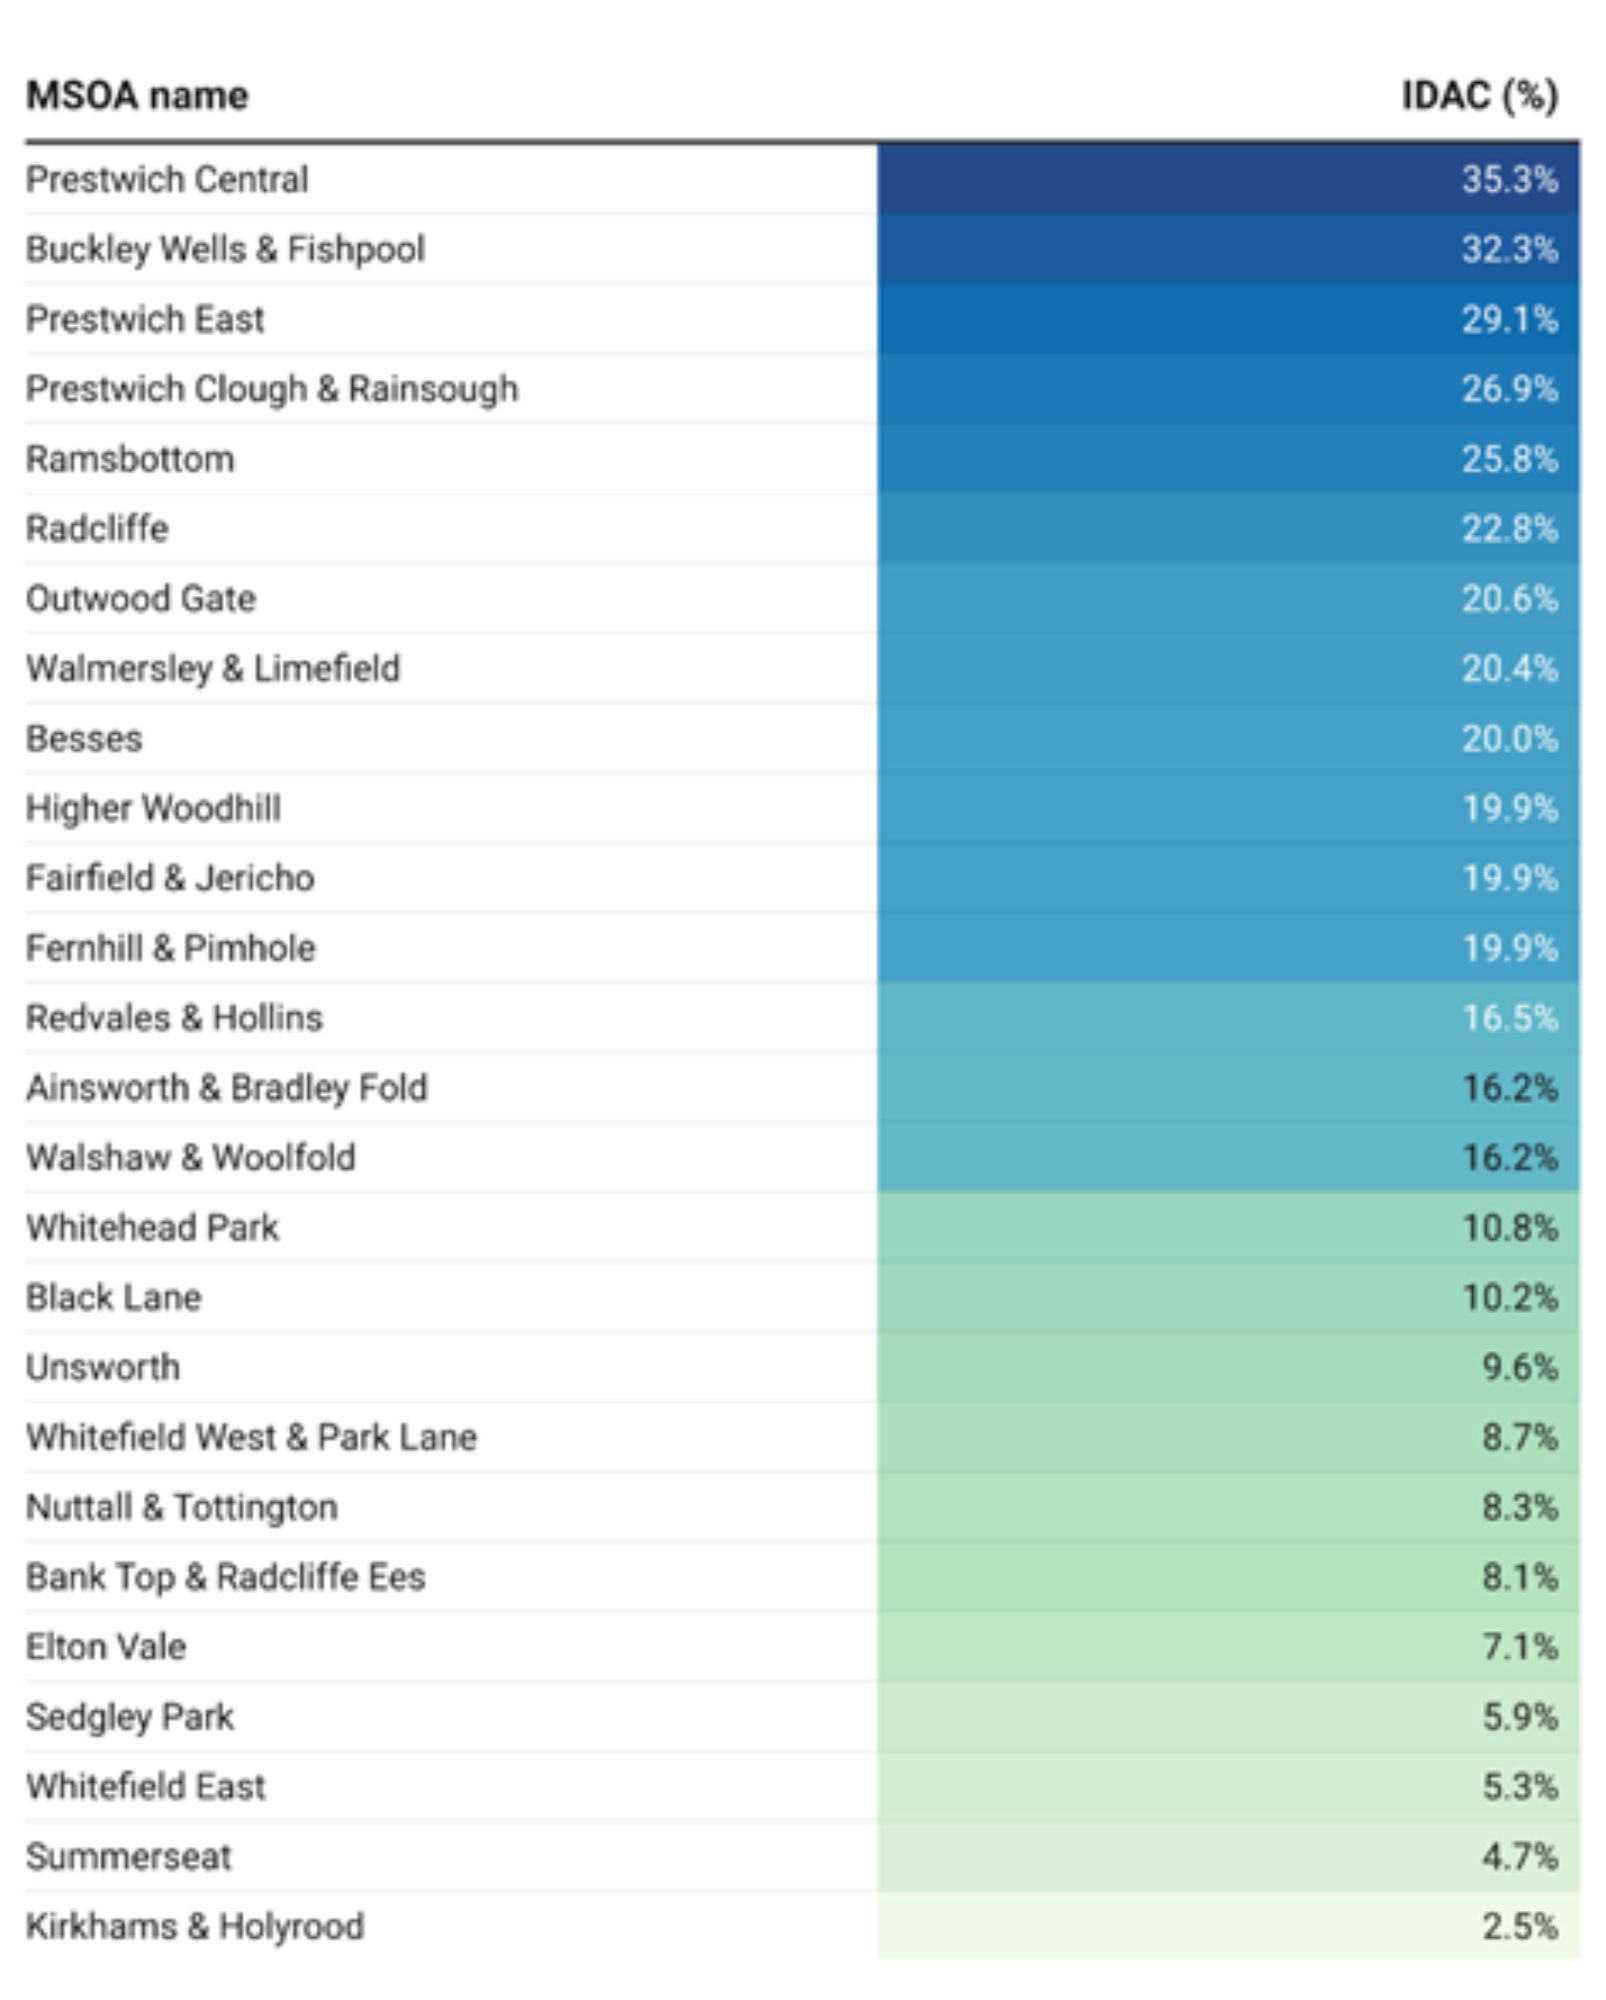
By Bury MSOAs, the highest proportion of children in poverty are in Prestwich central at 35.3% and Buckley Wells and Fishpool at 32.3% and lowest in Summerseat at 4.7% and Kirkhams and Holyrood at 2.5% (Table 2)
Table 2: Child poverty (Income deprivation affecting children %) in Bury MSOAs for the year 2019
Homelessness - households with dependent children owed a duty under the Homelessness Reduction Act
This indicator is defined as ‘Households including one or more dependent children owed a prevention or relief duty under the Homelessness Reduction Act, crude rate per 1,000 estimated households that include at least one dependent child. Children should count as dependent if they're under 18 and living at home.’ It is included in this section as it covers the age range 0-5 years.
Homelessness in Bury for the period 2021-22 is 12.7 per 1,000 household, statistically lower than England average of 14.4 and lower than NW average of 15.4 (Child and Maternal Health Profile, 2022).
Amongst Bury’s group of 6 statistical children service neighbours, Bury has the 2nd highest rate, with the highest rate in Stockton-on-Tees at 20.6 and lowest in Sefton at 4.5 (Child and Maternal Health Profile, 2022).
There are no data on inequalities for Bury and England.
Infant Mortality
Infant mortality is an indicator of the general health of population reflecting both the availability and quality of healthcare services as well as broader social and economic and environmental factors. It is measured as number of deaths of infants under one year of age per 1,000 live births. Infant mortality rate can be split by neonatal deaths (under 28 days) and post-neonatal deaths (between 28 days and 1 year). Over the past 40 years, infant mortality rates have significantly declined across the UK countries. However, compared to other European countries, development has slowed over the past twenty years.
Some infant deaths can be prevented by targeting interventions to reduce the modifiable risk factors that occur in around a third of infant deaths. These factors have a multiplier effect where greater number of these factors can make the infant more vulnerable. The most common modifiable risk factors are smoking in pregnancy, obesity in pregnancy and household smoking. In addition to these, there are protective factors that can reduce infant mortality and include vaccinations (including flu vaccination for pregnant women), breastfeeding, and safe-sleeping practices.
The infant mortality rate for Bury is 4.1 per 1,000 live births and is statistically similar to England average of 3.9 per 1,000 live births (Child and Maternal Health Profile, 2020). Neonatal mortality (deaths under 28 days per 1,000 live births) is 3.7 for Bury similar to England average of 2.8 per 1,000 live births (Child and Maternal Health Profile, 2021). Post neonatal mortality rate for Bury is 1.7 per 1,000 live births, statistically similar to England average of 1.1 (Child and Maternal Health Profile, 2021).
Figure 1 below presents the trend in infant mortality by neonatal and post-neonatal mortality in Bury and we can see that deaths under 28 days make the highest contribution to the infant mortality rates in Bury.
Figure 1: Trend in infant mortality by neonatal and post-neonatal mortality in Bury from the period 2010-12 to 2018-20
.jpg)
There is currently no national target for the infant mortality rate in England but the government has a national ambition in England to achieve 50% reductions in neonatal mortality by 2025. There are lack of data at local levels to examine inequalities with the exception of sex for neonatal mortality but data for England suggests inequalities by deprivation and ethnicity, where deprived areas, black ethnic groups and Asian ethnic groups see higher infant mortality rates (Nuffield Trust, 2022). Data for Bury by sex suggests higher neonatal mortality rates for males (4.5 per 1,000 live births) compared with females. Although neonatal mortality is generally 20% higher in boys than girls due to biological phenomena, research suggests that socioeconomic factors such as income and education are associated with these differences in neonatal mortality rates between males and females (Kramer et al, 2002).
Health Visitor Reviews
All children should be evaluated by a team led by a health visitor shortly before their first birthday. This allows for an assessment of the baby's physical, emotional, and social needs within the context of their family, including predictive risk factors, and allows both parents to discuss any concerns they may have about their baby's health, as well as a reminder of the importance of vaccinations at around one year. It also allows for growth monitoring and discussions about weaning, oral health, and home safety (particularly relevant as babies are now sitting independently, rolling over, and may be starting to walk). Furthermore, it provides an opportunity to discuss preconception health prior to any future pregnancy. A review every 9 to 12 months ensures that any issues are identified early and appropriate referrals are made.
There are no data on health visitor reviews that are publicly available for Bury including newborn visits (NBV) in 14 days, 6-8 weeks and reviews at 1 year and 2-2 and a half years (Maternal and Child Health, 2022).
Immunisation Coverage
After clean water, vaccination is the most effective public health intervention in the world for saving lives and promoting good health. Immunisation is a triumph of global health and development, saving millions of lives annually. Vaccines reduce the likelihood of contracting a disease by bolstering the body's natural defences. Immunisation is an essential aspect of primary health care and an indisputable human right (WHO, 2019). In addition to reducing infectious disease mortality and morbidity, vaccines have other beneficial impacts on health, the economy and our society. Vaccines induce herd immunity, reduce diseases that complicate vaccine preventable diseases and prevent antibiotic resistance. They also lead to significant cost savings and a return on investment of £34. Societal impact of the vaccines include empowering women, strengthening health and social care infrastructure and improving life expectancy and opportunities for a healthy life.
United Kingdom has one of the best immunisation programmes in the world that has always been at the forefront of rolling out new programmes when the best vaccination is available. The UK childhood immunisation programme provides protection against 14 childhood infections including polio, mumps, measles, meningococcal diseases and rubella. The programme is divided into routine (Table 3) and selective childhood immunisation programmes (Table 4).
Table 3: Routine childhood immunisations offered to children under 5 years of age in the UK

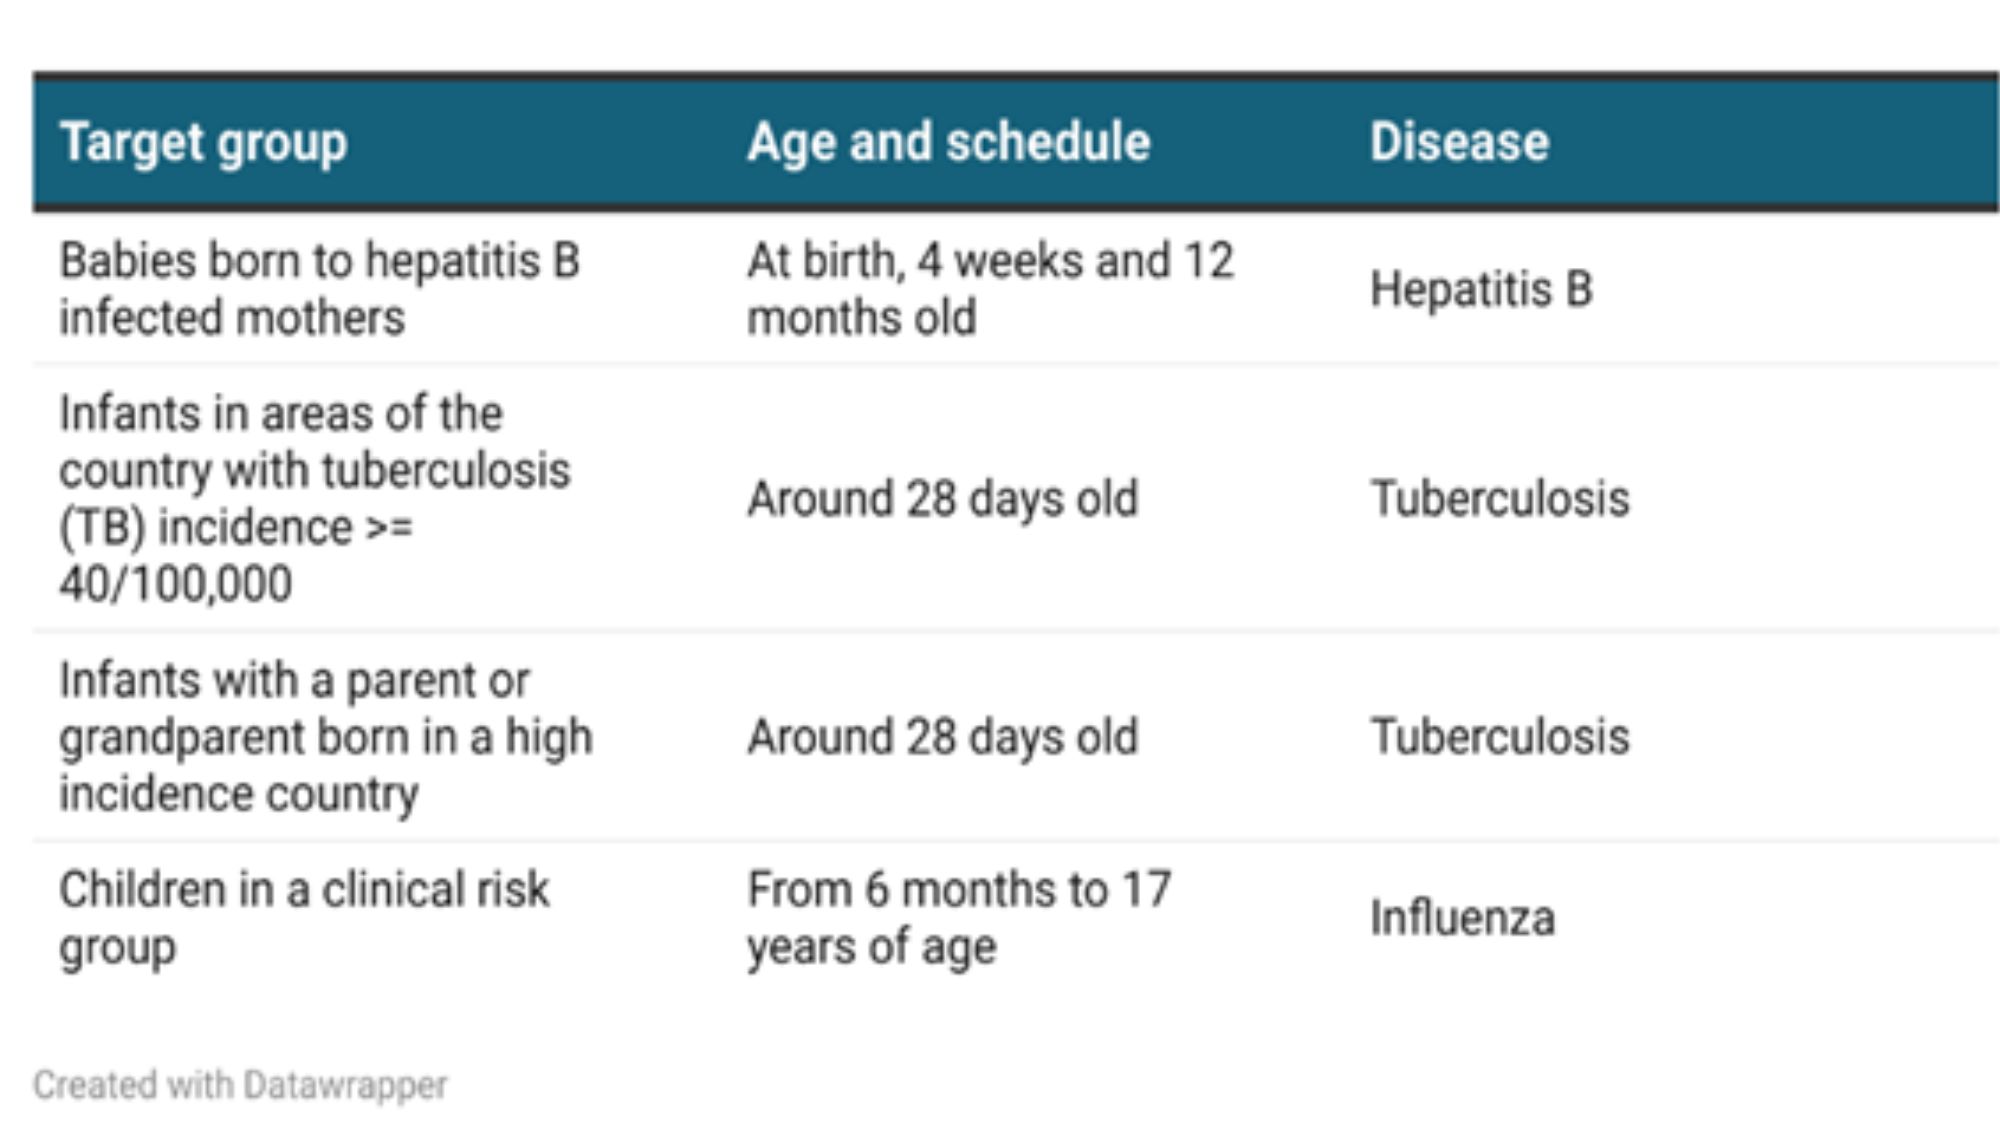
Table 4: Selective childhood immunisations offered to children under 5 years of age in the UK
Immunisation coverage is the best indicator of the level of protection a population will have against vaccine preventable communicable diseases. Coverage is closely correlated with levels of disease. Monitoring coverage identifies possible drops in immunity before levels of disease rise.
This section will present publicly available immunisation data on vaccinations given to children until 5 years of age.
BCG Immunisation
BCG immunisation programme is part of selective childhood immunisation and is a risk-based programme. BCG vaccine is offered to all infants (0 to 12 months old) living in areas where the incidence of tuberculosis is greater than 40 per 100,000 or where a parent or grandparent is born in a high incidence country. The vaccine is given when a baby is around 28 days old. Three-year average incidence of TB in Bury is 7.9 per 100,000 population, so there is no universal programme in the Borough and babies with parents and grandparents born in a high incidence country are being offered the vaccine. Count data for Bury are only available for children for whom the local authority is responsible receiving a dose of BCG vaccine at any time by their first birthday. For the year 2021-22, 501 babies were offered the BCG vaccine in Bury .
Population vaccination coverage: Dtap IPV Hib
The combined DTaP IPV Hib is the first in a course of vaccines offered to babies to protect them against diphtheria, pertussis (whooping cough), tetanus, Haemophilus influenzae type b (an important cause of childhood meningitis and pneumonia) and polio (IPV is inactivated polio vaccine).
Dtap IPV Hib (1 year old)
The coverage is measured as ‘children for whom the local authority is responsible who received 3 doses of DTaP IPV Hib vaccine at any time by their first birthday as a percentage of all children whose first birthday falls within the time period.’
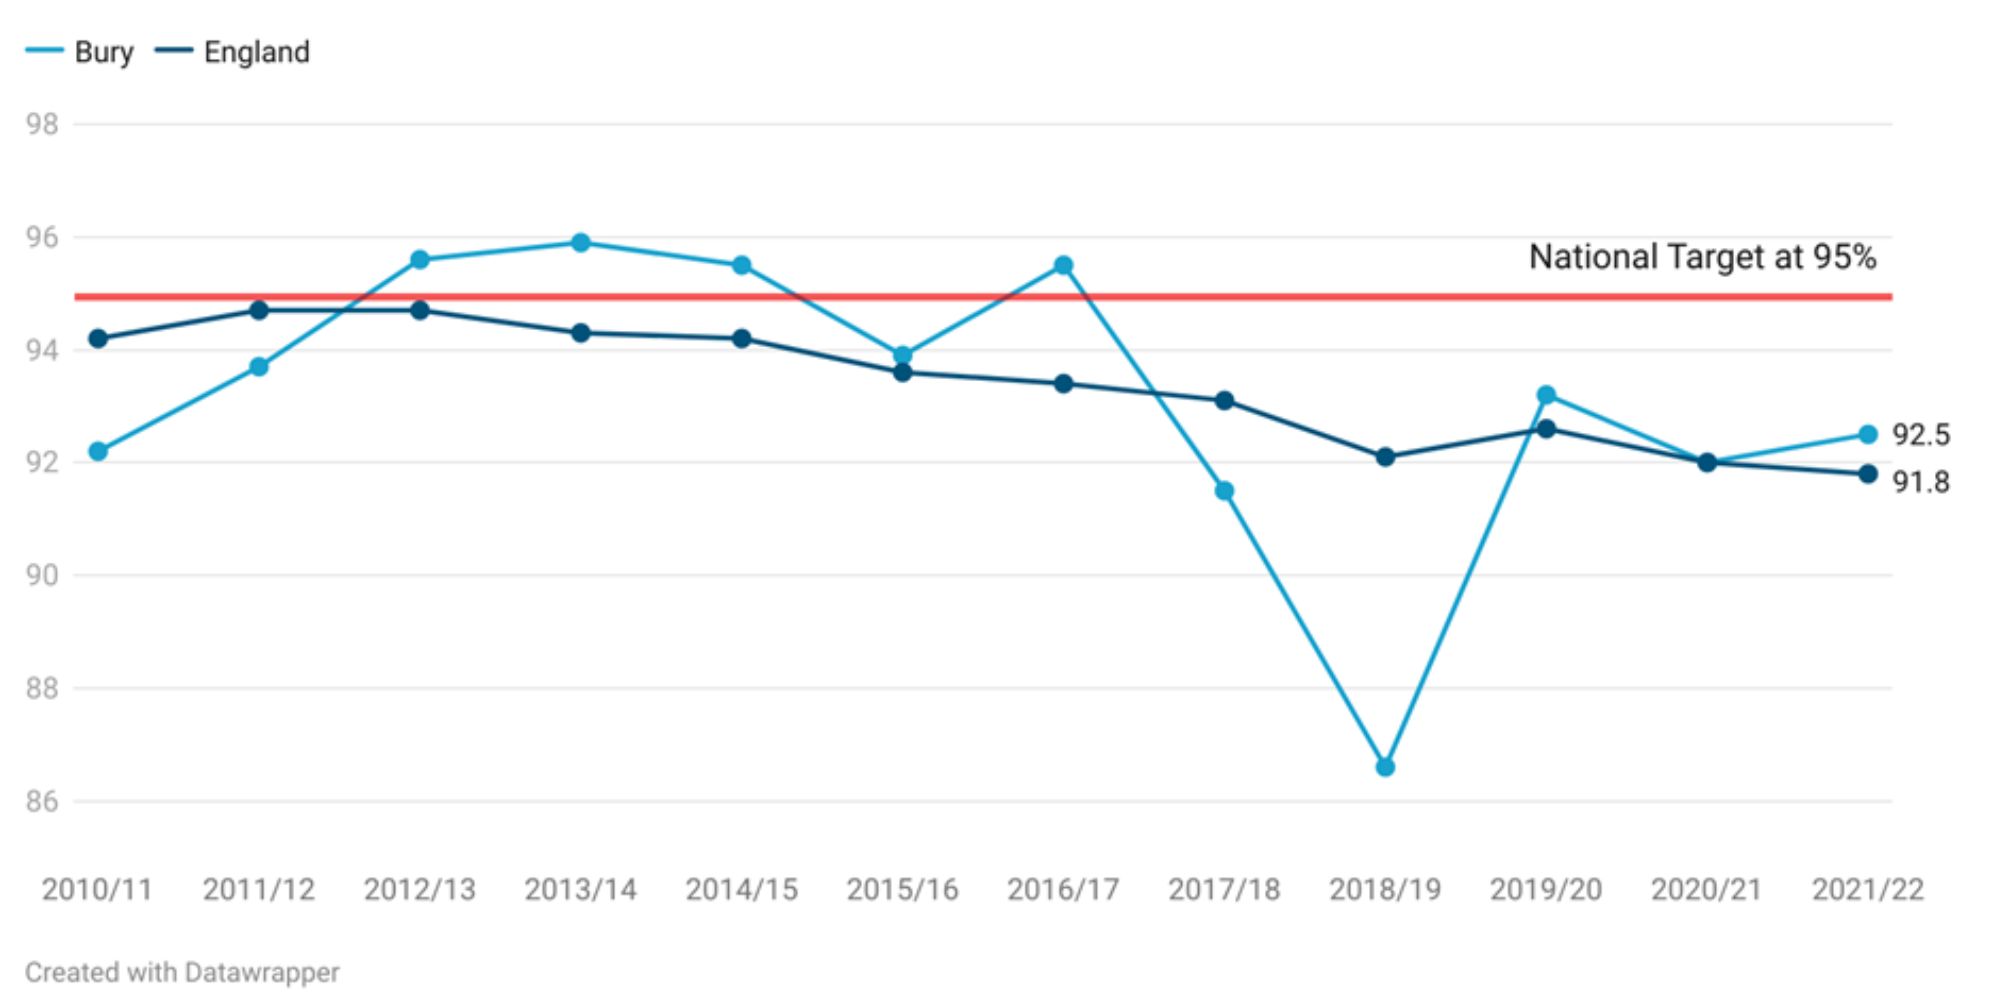
The combined DTaP IPV Hib coverage (1 year old) in Bury for the year 2021-22 is at 92.5%, higher than North-West (NW) average of 91.5% and England average of 91.8%. However, the coverage is still below the target of 95% and over. Bury needs to vaccinate 55 additional children to reach the national target.
Vaccine coverage in Bury ranged from the lowest at 86.6% in 2018/19 to the highest coverage at 95.9 in 2013/14. Examining the trend in Bury, the coverage steadily increased from 92.2% in 2010/11 to above the national target of 95% and over in 2012/13, with a coverage of 95.6%. This was followed by a decline to 93.9 in 2015-16 and then another increase to 95.5% in 2016-17. Vaccination coverage then steadily declined to the lowest at 86.6 in 2018/19, before increasing again to 93.2% the following year. The coverage then remained relatively stable with 92.5% in 2021-22. After the year 2016-17, vaccination coverage of DTaP IPV Hib vaccine in Bury has remained below the national target of 95% and over. Coverage in England has steadily declined from 94.2% in 2010-11 to 91.8% in 2021-22 (Figure 2).
Figure 2: Trend in population vaccination coverage: Dtap IPV Hib (1 year old) for Bury and England from the year 2010-11 to 2021-22
Bury has the 3rd highest Dtap IPV Hib (1 year old) in its group of 6 statistical children service neighbours with the lowest percentage in Sefton at 90.6% and highest in Stockton-on Tees at 96% (Children and Maternal Health, 2022). There are no data on inequalities at Bury level but England data suggests decreasing coverage of Dtap IPV Hib vaccination with increasing levels of deprivation. The most deprived decile in England has a coverage of 88.4% compared with 93.3 in the least deprived decile for the year 2021-22 (Child and Maternal Health, 2022).
Dtap IPV Hib (2 years old)
This indicator is defined as ‘Children for whom the local authority is responsible who received 3 doses of DTaP IPV Hib vaccine at any time by their second birthday as a percentage of all children whose second birthday falls within the time period.’
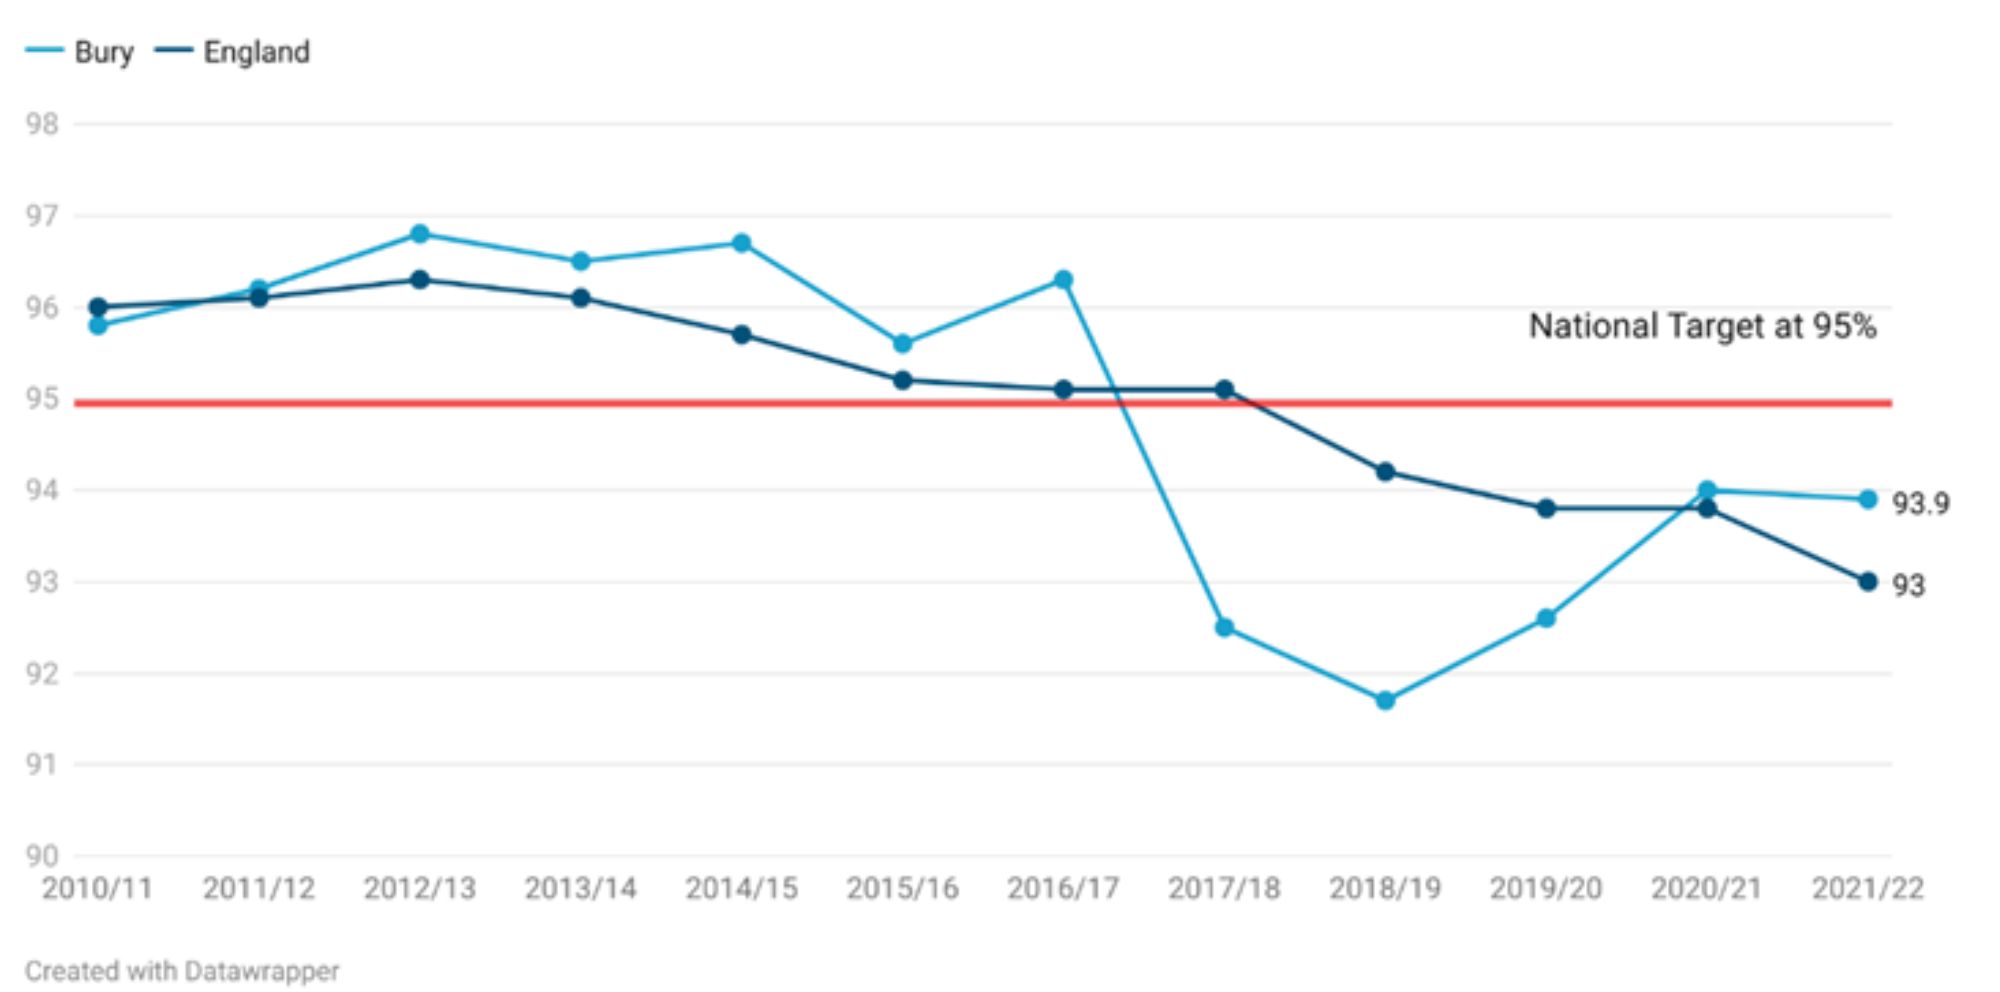
The combined DTaP IPV Hib coverage (2 year old) in Bury for the year 2021-22 is at 93.9%, slightly higher than North-West (NW) average of 93.7% and England average of 93%. However, the coverage is still below the target of 95% and over. Bury needs to vaccinate 24 additional children to reach the national target.
Vaccine coverage in Bury ranged from the lowest at 91.7% in 2018/19 to the highest coverage at 96.8% in 2012/13. Examining the trend in Bury, the coverage steadily increased from 95.8% in 2010/11 to 96.8% in 2012/13 and then remained stable with slight fluctuation until 2016-17 where the coverage was 96.3%. Vaccine coverage then sharply declined to 92.5% in 2017-18 and 91.7% in 2018-19. This was followed by a rise from 92.6% in 2019-20 to 93.9% in 2021-22. After the year 2016-17, vaccination coverage of DTaP IPV Hib vaccine in Bury for 2 year olds has remained below the national target of 95% and over. Based on the five most recent data points, there is no statistically significant trend in Bury. Coverage in England has steadily declined from 96% in 2010-11 to 93% in 2021-22 (Figure 3).
Figure 3: Trend in population vaccination coverage: Dtap IPV Hib (2 year old) for Bury and England from the year 2010-11 to 2021-22
Bury has the 2nd lowest Dtap IPV Hib (2 year old) in its group of 6 statistical children service neighbours with the lowest percentage in Calderdale at 93.3% and highest in Stockport at 96.5% (Children and Maternal Health, 2022). There are no data on inequalities at Bury level but England data suggests decreasing coverage of Dtap IPV Hib vaccination with increasing levels of deprivation. The most deprived decile in England has a coverage of 91.1% compared with 94.2 in the least deprived decile for the year 2021-22 (Child and Maternal Health, 2022).
Geographical variations in Dtap IPV Hib vaccination in Bury
Data on geographical inequalities are not available for coverage at 1 years but available at the Primary Care Network (PCN) and GP practice levels only for babies who received at least 3 doses of a DTaP vaccine before the age of 8 months and for those who received it at any time by their second birthday. We will be presenting data at PCN levels only. Bury has four PCNs: Bury PCN, Horizon PCN, Prestwich PCN and Whitefield district and community PCN. Data at GP levels are available here. Please note data available at PCN level are available for the year 2020-21 compared with Bury level data that are available up to the year 2021-22.
Coverage by PCN for Dtap IPV Hib (8 months old)
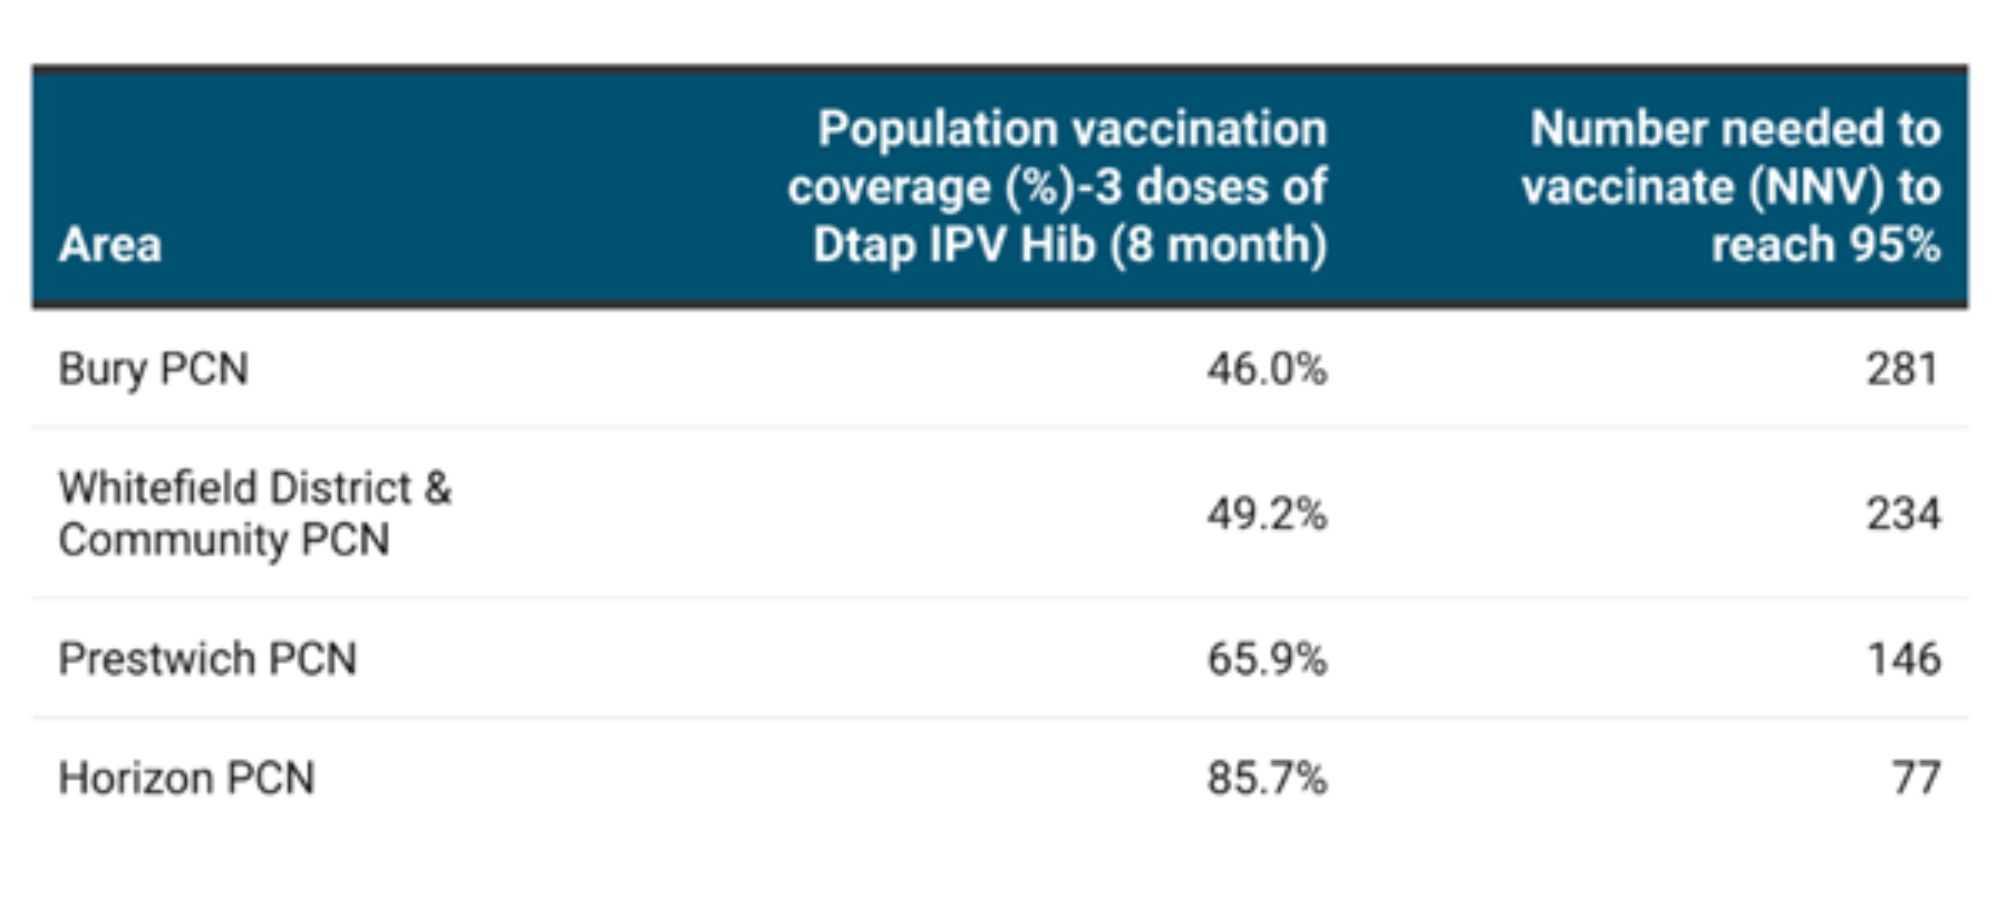
All 4 of Bury PCNS are below the national target of coverage 95% and over, with the lowest coverage in Bury PCN at 46% and highest in Horizon PCN at 85.7%. Bury PCN has the highest number of babies (281) needed to vaccinate and Horizon PCN has the lowest number of babies (77) to vaccinate to reach national target of 95% (Table 5).
Table 5: Vaccination coverage (%) for babies receiving at least 3 doses of a DTaP vaccine before the age of 8 months and number needed to vaccinate (NNV) to reach national target of 95% across primary care networks in Bury
Coverage by PCN for Dtap IPV Hib (2 years old)
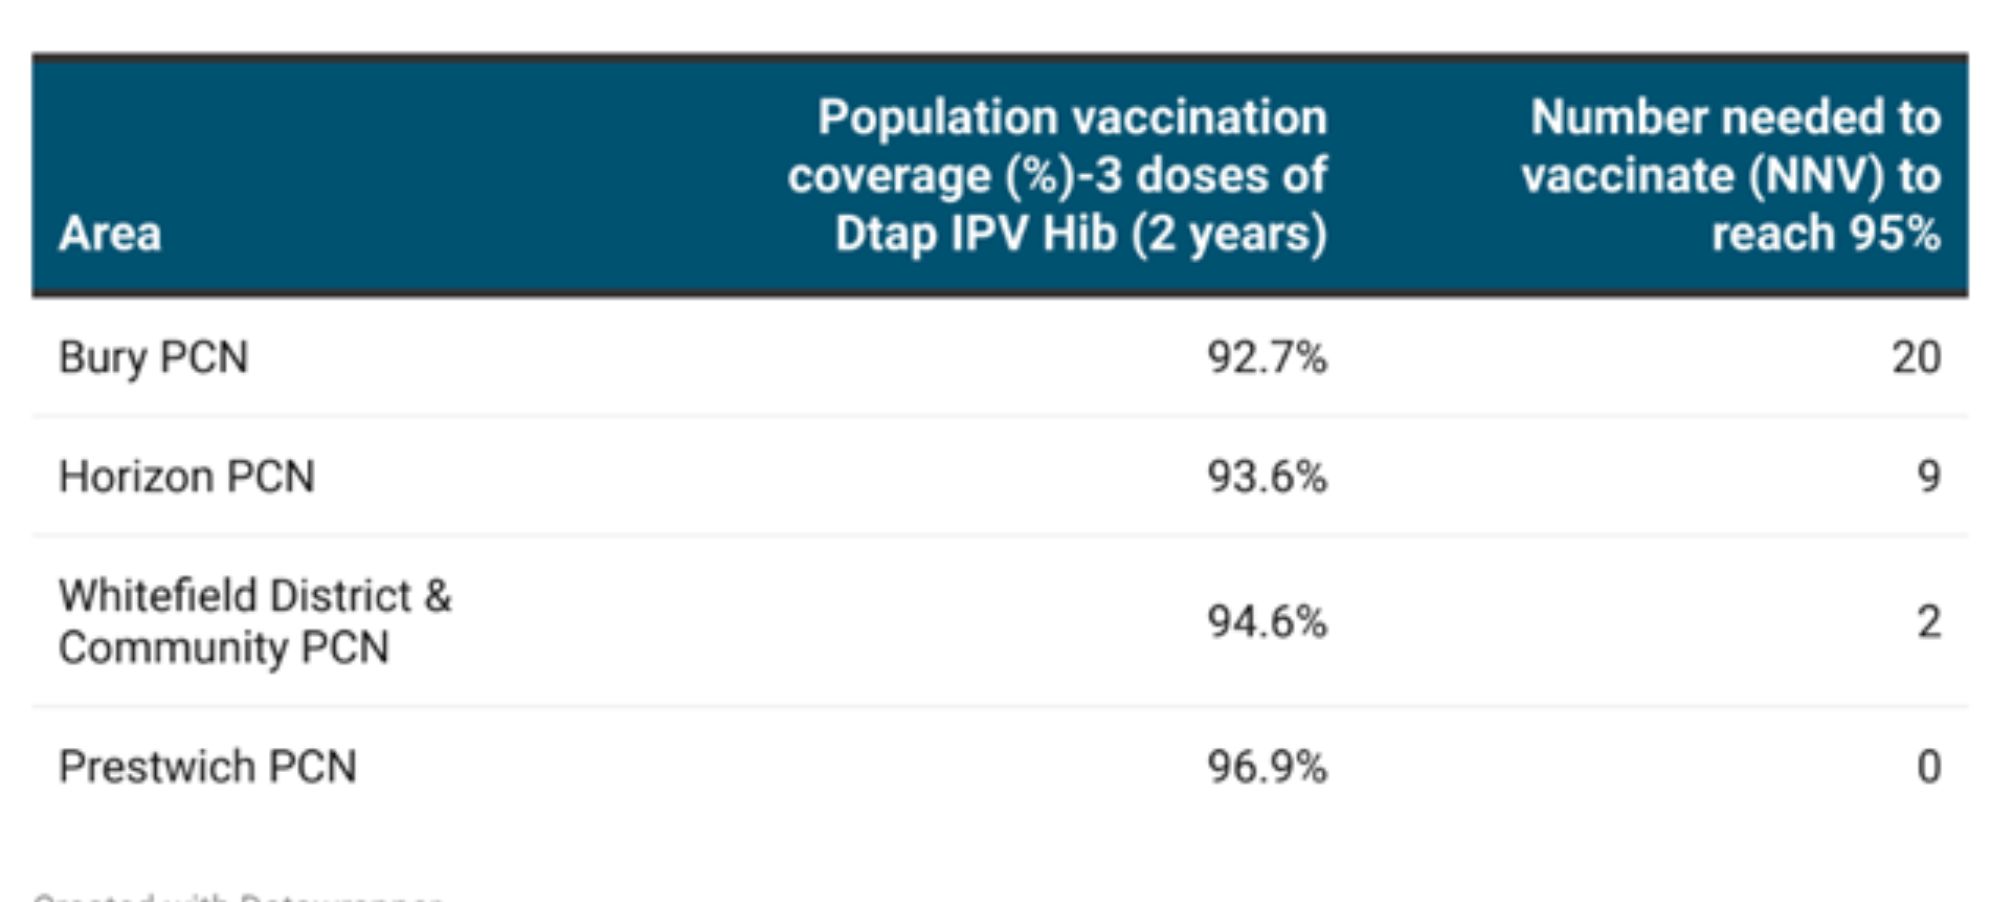
Prestwich PCN is the only PCN in Bury with coverage above 95% at 96.9%. The lowest coverage is in Bury PCN at 92.7% (NNV: 20). Whitefield district and community PCN require only 2 additional babies vaccinated to reach the national target (Table 6).
Table 6: Vaccination coverage (%) for children receiving at least 3 doses of a DTaP vaccine at any time by their second birthday and number needed to vaccinate (NNV) to reach national target of 95% across primary care networks in Bury
(National General Practices Profile, 2021)
Population vaccination coverage: Mumps, Measles and Rubella (MMR)
The MMR vaccine provides protection against measles, mumps, and rubella. Measles, rubella, and mumps are highly contagious diseases that can cause serious complications, such as meningitis, encephalitis, and deafness. They can also cause pregnancy complications that affect the unborn child and can result in a miscarriage. To achieve herd immunity from measles, a population vaccination coverage of 95% is required.
Children receive their first MMR vaccination as part of the routine immunisation schedule, typically within a month of their first birthday. They will then receive a booster dose before starting school, which typically occurs between the ages of three and five (Table 3 above).
Mumps, Measles and Rubella (MMR) one dose at 2 years old
This indicator is defined as ‘all children for whom the local authority is responsible who received one dose of MMR on or after their first birthday and at any time up to their second birthday as a percentage of all children whose second birthday falls within the time period.’
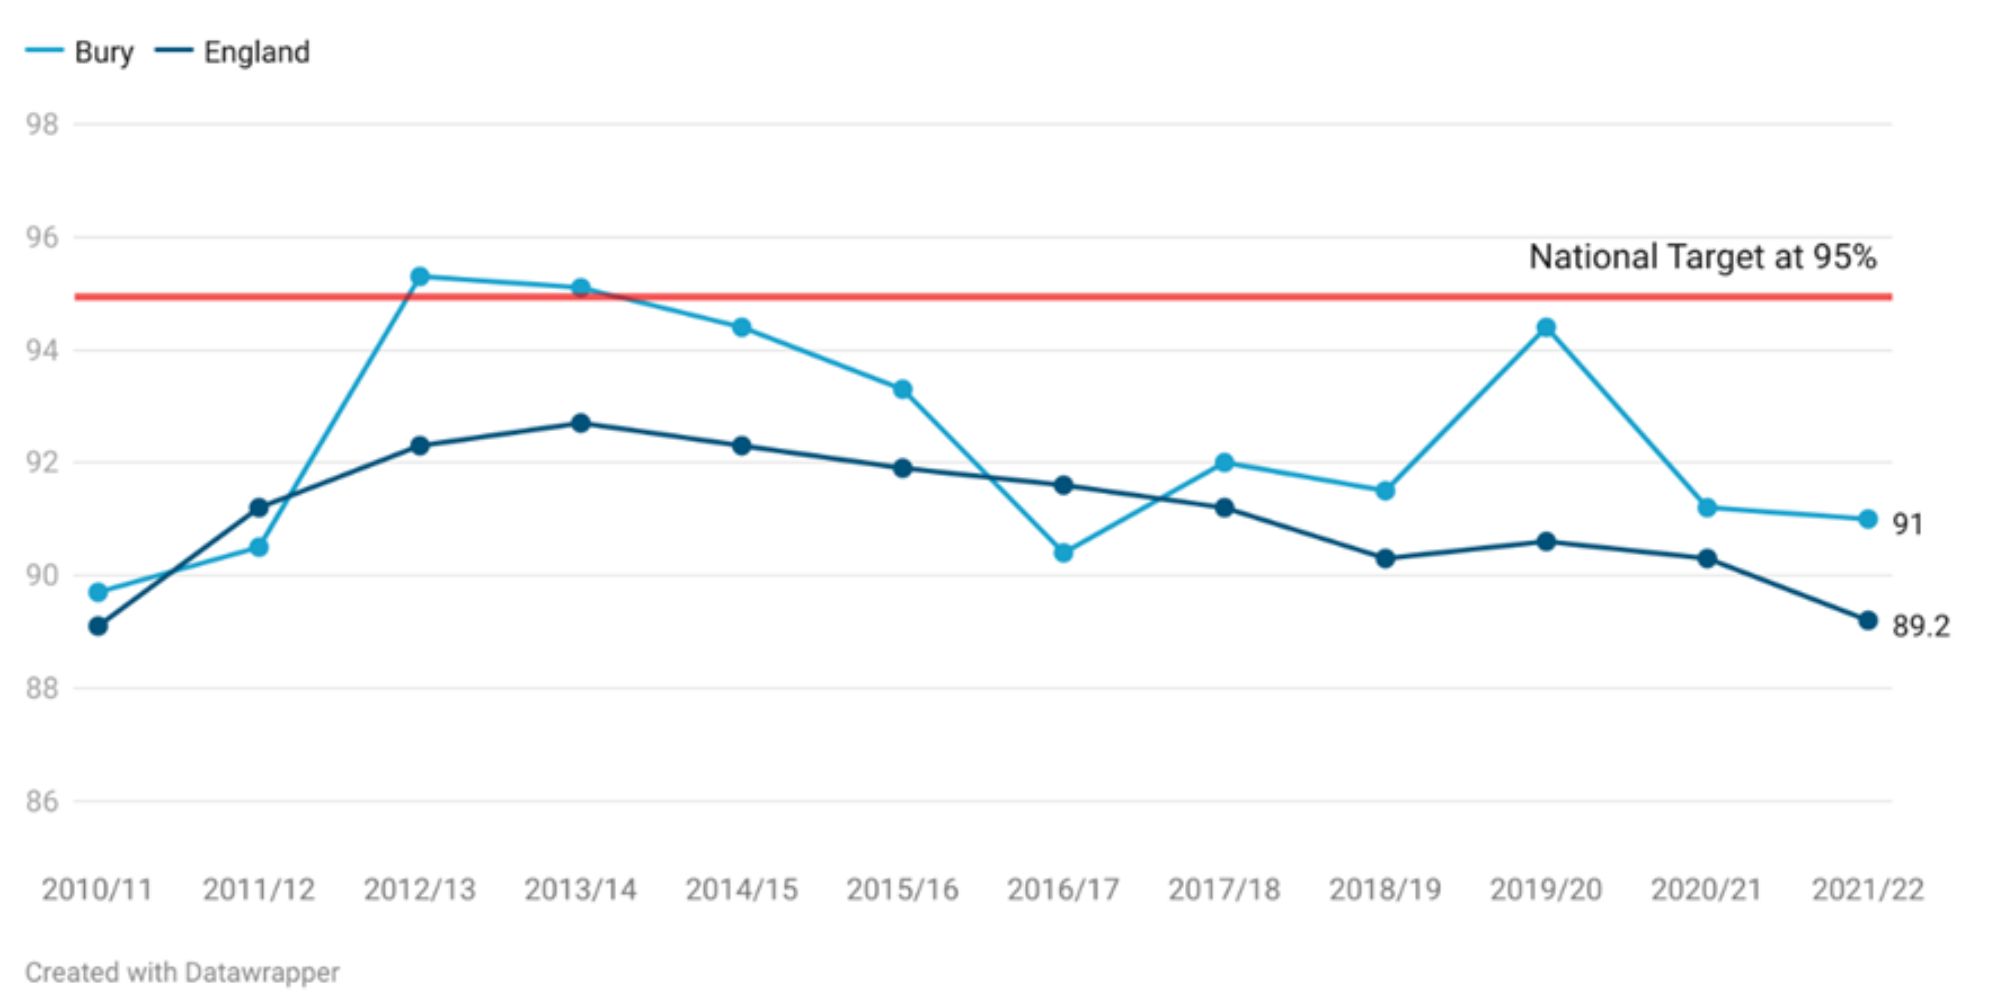
Mumps, Measles and Rubella (MMR) one dose coverage (2 years old) in Bury for the year 2021-22 is at 91%, slightly higher than North-West (NW) average of 90.3% and England average of 89.2%. However, the coverage is still below the target of 95% and over. Bury needs to vaccinate 183 additional children to reach the national target.
Vaccine coverage in Bury ranged from the lowest at 89.7% in 2010/11 to the highest coverage at 95.3% in 2012/13. Examining the trend in Bury, the coverage steadily increased from 89.7% in 2010/11 to 95.3% in 2012/13 and then steadily declined to 90.4% in 2016-17. This was followed by slight fluctuations but an overall increase to 94.4% in 2019-20. Over the last two years, coverage in Bury has declined to 91.2% in 2020-21 and 91% in 2021-22. After the year 2013-14, vaccination coverage of Mumps, Measles and Rubella (MMR) one dose coverage (1 year old) has remained below the national target of 95% and over. Based on the five most recent data points, there is no statistically significant trend in Bury. Coverage in England has fluctuated, increasing from 89.1% in 2010-11 to 92.7% in 2013-14. This was followed by a steady decline from 92.3% in 2014-15 to 89.2% in 2021-22 (Figure 4).
Figure 4: Trend in population vaccination coverage: MMR one dose (2 year old) for Bury and England from the year 2010-11 to 2021-22
Bury has the 3rd highest MMR one dose coverage (2 years old) in its group of 6 statistical children service neighbours with the lowest percentage in Calderdale at 89.6% and highest in Stockton-on-Tees at 95.6% (Children and Maternal Health, 2022). There are no data on inequalities at Bury level but England data suggests decreasing coverage of MMR one dose coverage (2 years old) with increasing levels of deprivation. The most deprived decile in England has a coverage of 85.9% compared with 91.6% in the least deprived decile for the year 2021-22 (Child and Maternal Health, 2022).
Mumps, Measles and Rubella (MMR) one dose at 5 years old
This indicator is defined as ‘All children for whom the local authority is responsible who received one dose of MMR on or after their first birthday and at any time up to their fifth birthday as a percentage of all children whose fifth birthday falls within the time period’.
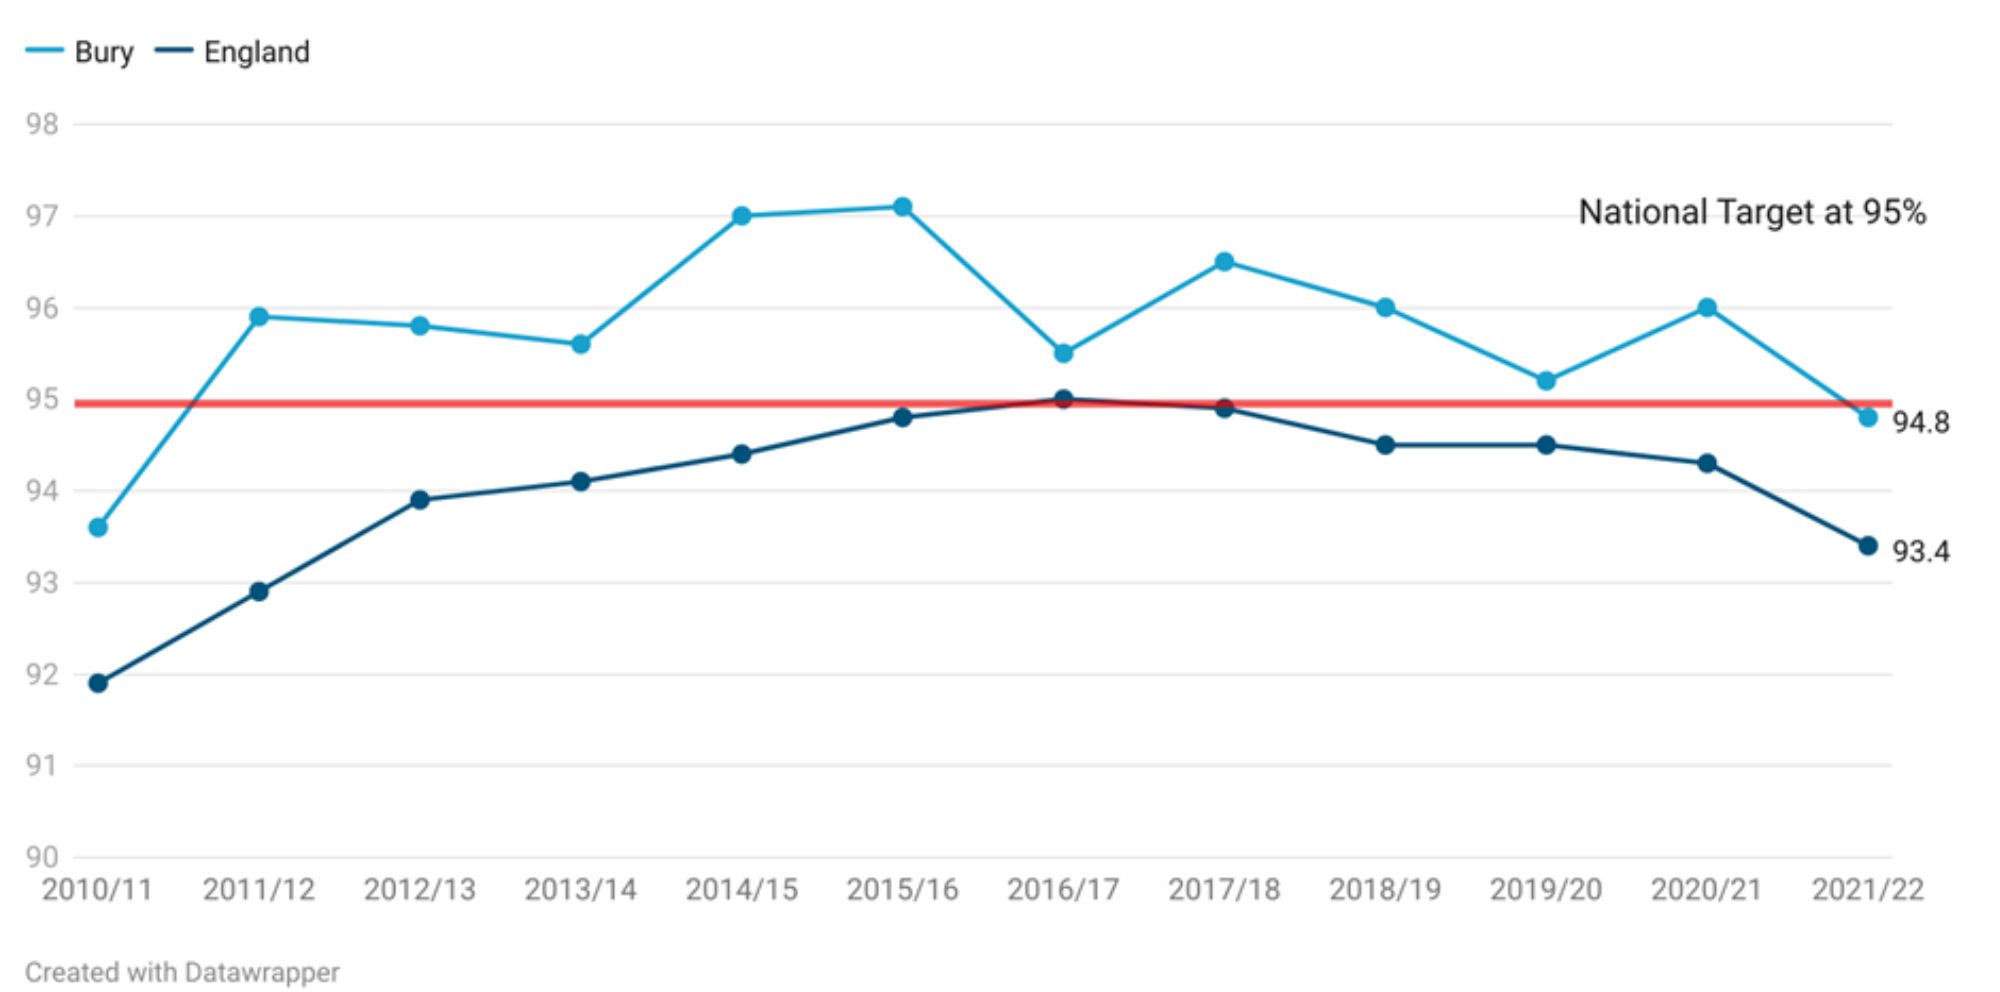
Mumps, Measles and Rubella (MMR) one dose coverage (5 years old) in Bury for the year 2021-22 is at 94.8%, slightly higher than North-West (NW) average of 94.5% and England average of 93.4%. However, the coverage is still below the target of 95% and over. Bury needs to vaccinate 5 additional children to reach the national target.
Vaccine coverage in Bury ranged from the lowest at 93.6% in 2010/11 to the highest coverage at 97.1% in 2012/13. Examining the trend in Bury, the coverage steadily increased from 93.6% in 2010/11 to 97.1% in 2015/16 and then declined to 90.4% in 2016-17. This was followed by slight fluctuations but an overall increase to 95.5% in 2016-27. Coverage then remained steady with slight fluctuations until 2020-21 (96%) before sharply declining to below national target (94.8%). After the year 2010-11, 2021-22 is the first year that Bury’s MMR vaccination coverage for one dose at 2 years has declined below the national target. Based on the five most recent data points, there is no statistically significant trend in Bury. Coverage in England has fluctuated, increasing from 91.9% in 2010-11 to 95% in 2016-17. This was followed by a steady decline from 94.9% in 2017-18 to 93.4% in 2021-22 (Figure 5).
Figure 5: Trend in population vaccination coverage: MMR one dose (5 years old) for Bury and England from the year 2010-11 to 2021-22
Bury has the 2nd lowest MMR one dose coverage (5 years old) in its group of 6 statistical children service neighbours with the lowest percentage in Sefton at 93.3% and highest in Stockton-on-Tees at 97.2% (Children and Maternal Health, 2022). There are no data on inequalities at Bury level but England data suggests decreasing coverage of MMR one dose coverage (5 years old) with increasing levels of deprivation. The most deprived decile in England has a coverage of 91.8% compared with 94.9% in the least deprived decile for the year 2021-22 (Child and Maternal Health, 2022).
Mumps, Measles and Rubella (MMR) two doses at 5 years old
This indicator is defined as ‘All children for whom the local authority is responsible who received two doses of MMR on or after their first birthday and at any time up to their fifth birthday as a percentage of all children whose fifth birthday falls within the time period.’
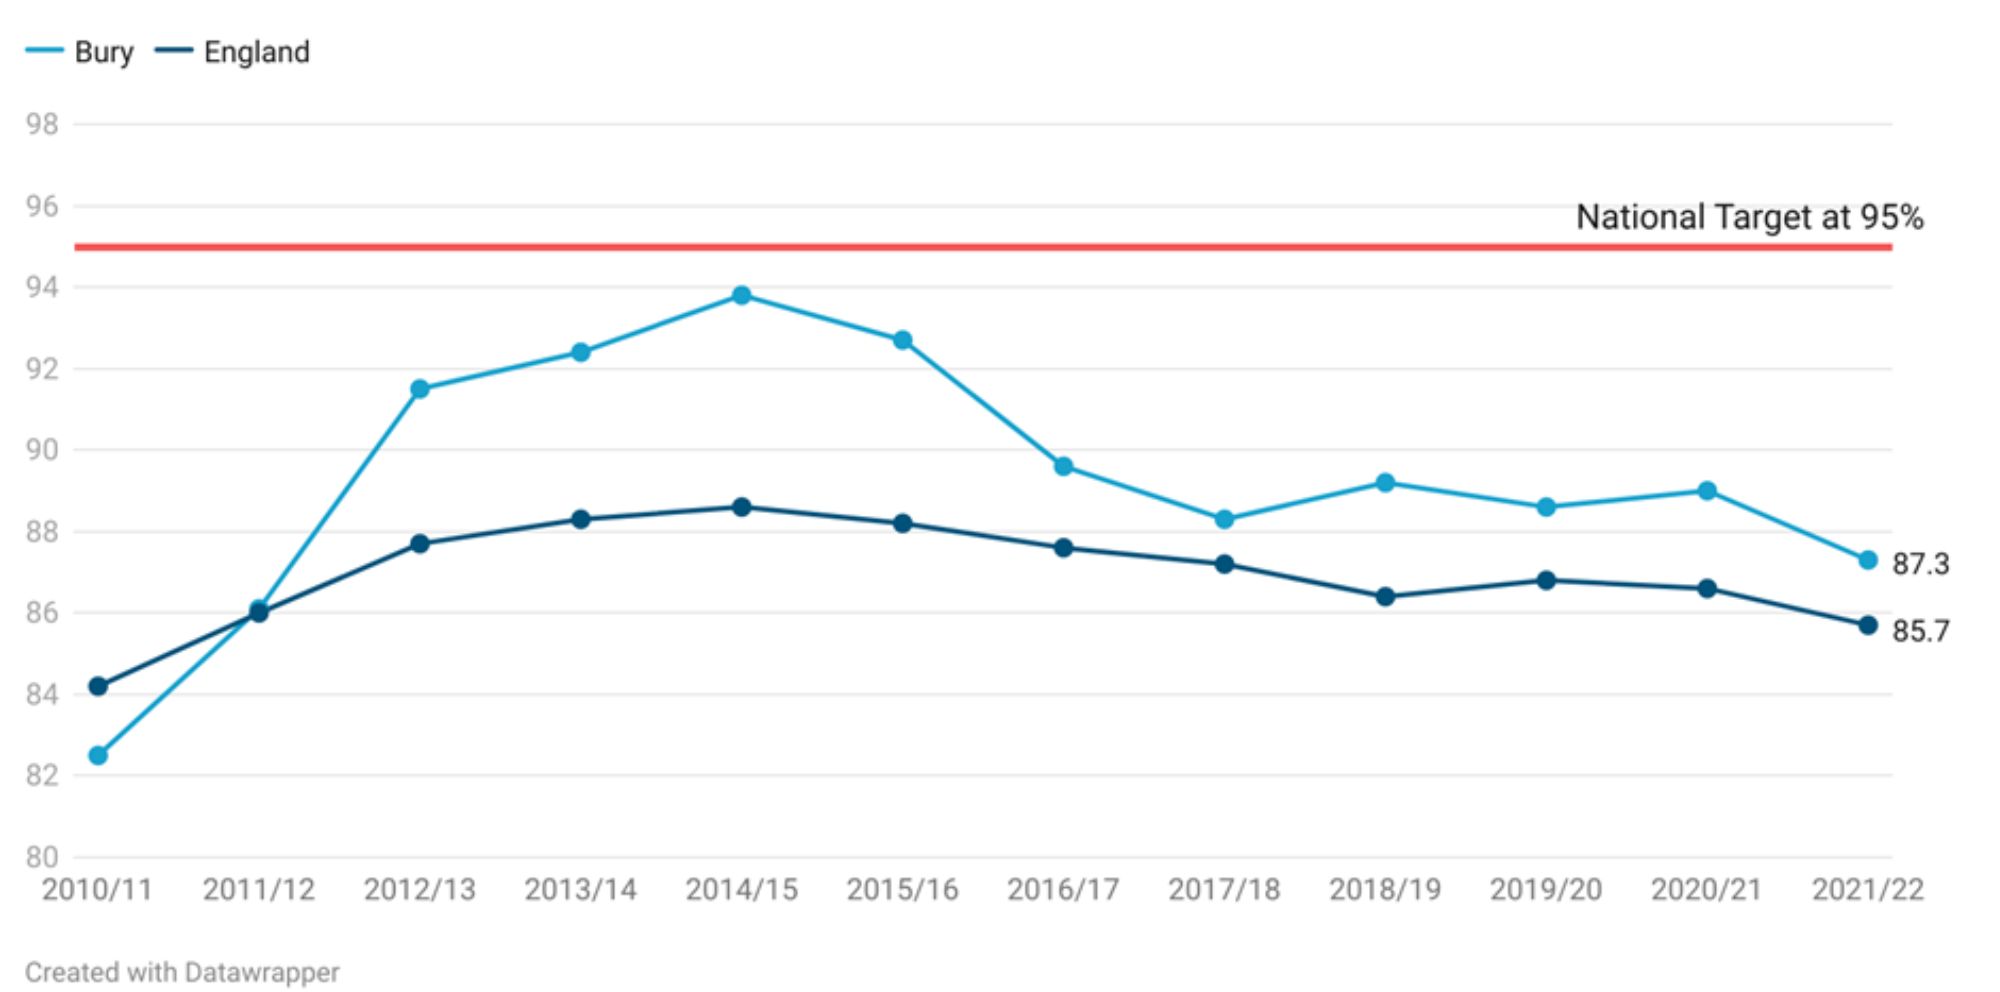
Mumps, Measles and Rubella (MMR) two doses coverage (5 years old) in Bury for the year 2021-22 is at 87.3%, lower than North-West (NW) average of 88.7% but higher than England average of 85.7%. The coverage in Bury is below the target of 95% and over. Bury needs to vaccinate 189 additional children to reach the national target.
Vaccine coverage in Bury steadily increased from the lowest coverage at 82.5% in 2010/11 to the highest coverage at 93.8% in 2014/15. The coverage steadily declined from 92.7% in 2015/16 to 88.3% in 2017/18 and then remained fairly stable until 2021-22 with a coverage of 89%. In the year 2021-22, coverage in Bury declined to the third lowest value in a decade to 87.3%. Based on the five most recent data points, there is no statistically significant trend in Bury. Coverage in England has also steadily increased from 84.2% in 2010-11 to 88.6% in 2014-15. This was followed by a steady decline from 88.2% in 2015-16 to 85.7% in 2021-22 Coverage in Bury remained higher than England average from 2012-13 to 2021-22. Throughout the 11 year period, vaccination coverage for 3 doses of MMR (5 years old) remained below the national target of 95%(Figure 6).
Figure 6: Trend in population vaccination coverage: MMR two dose (5 years old) for Bury and England from the year 2010-11 to 2021-22 (Child and Maternal Health, 2022)
Bury has the 2nd lowest MMR two dose coverage (5 years old) in its group of 6 statistical children service neighbours with the lowest percentage in Sefton at 86.3% and highest in Stockton-on-Tees at 92.5% for the year 2021-22 (Children and Maternal Health, 2022). There are no data on inequalities at Bury level but England data suggests decreasing coverage of MMR one dose coverage (5 years old) with increasing levels of deprivation. The most deprived decile in England has a coverage of 81.5% compared with 89.9% in the second least deprived decile and 87.9% in the least deprived decile for the year 2021-22 (Child and Maternal Health, 2022).
Geographical variations in MMR vaccination
Data on geographical inequalities are only available for MMR vaccination for one dose at 2 year old at Primary Care Network (PCN) and GP practice levels. We will be presenting data at PCN levels only. Data at GP levels are available here. Please note data available at PCN level are available for the year 2020-21 compared with Bury level data that are available up to the year 2021-22.
Coverage by PCN for MMR vaccination for one dose (2 years)
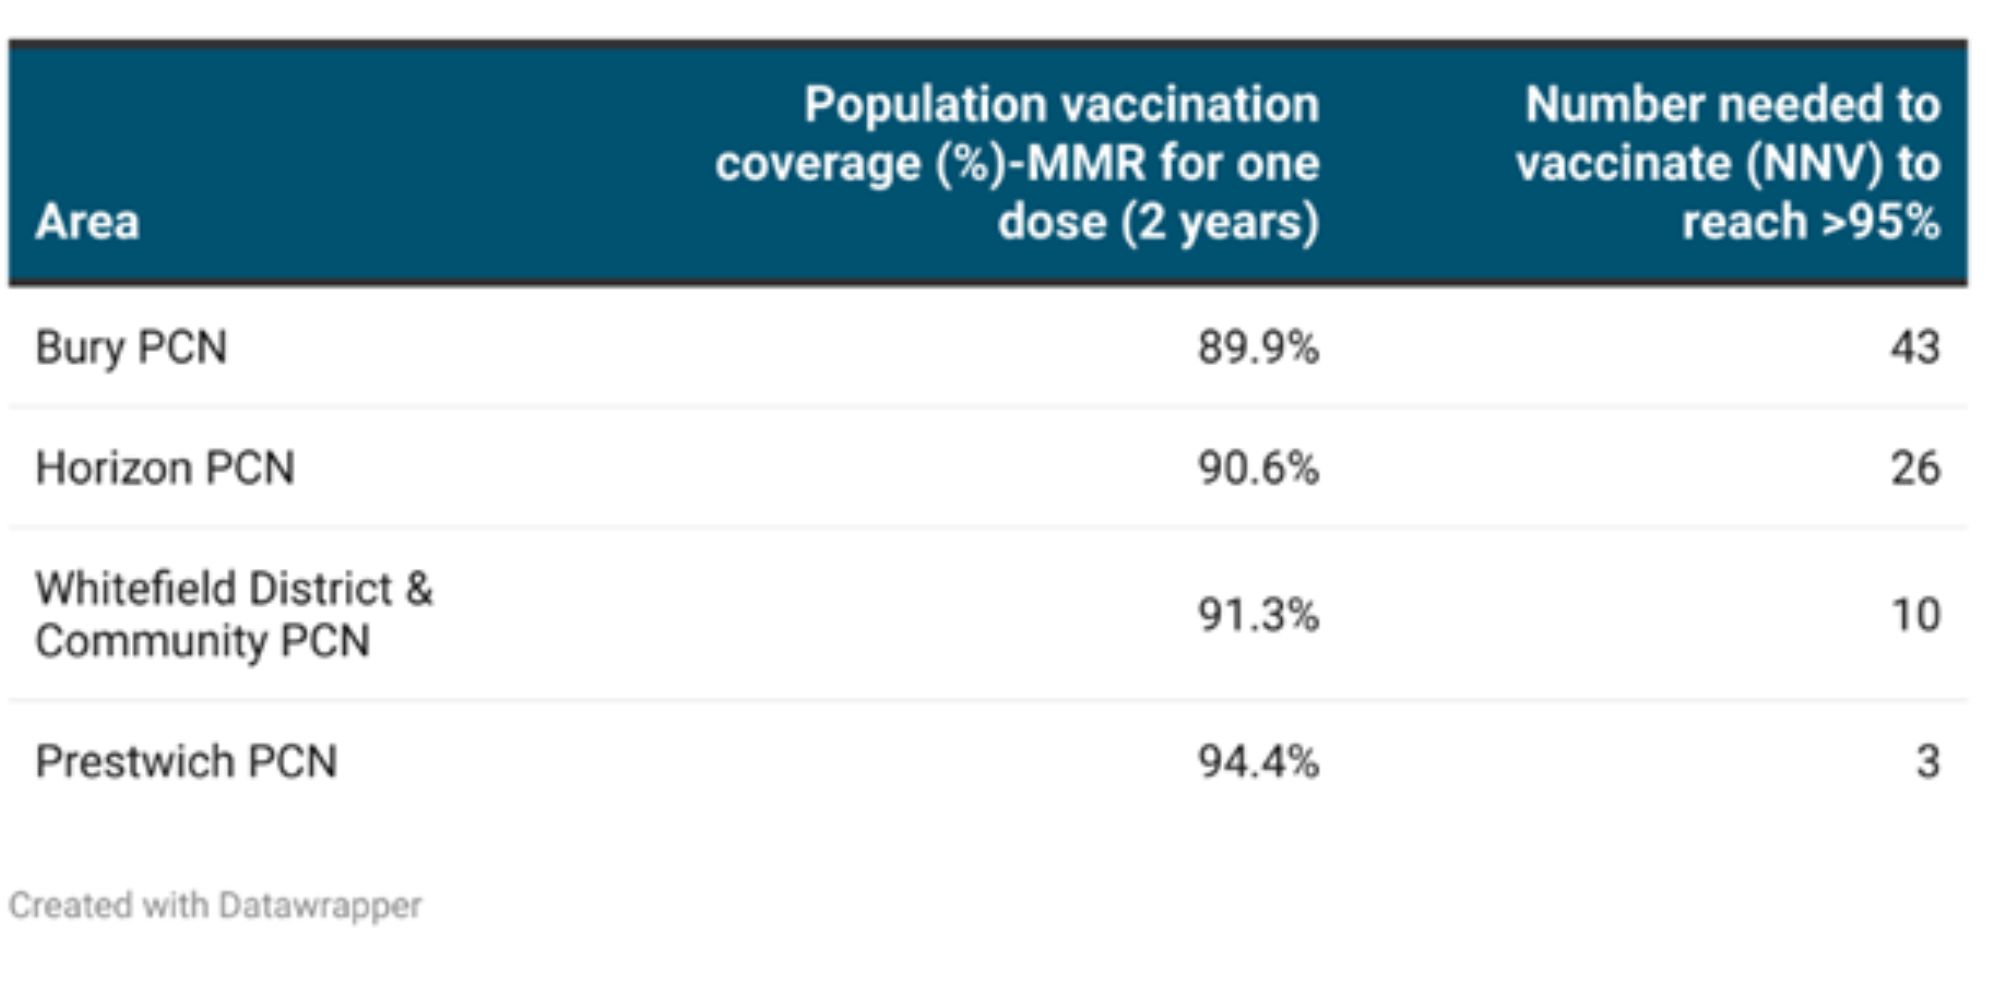
All 4 of Bury PCNS are below the national target of coverage 95% and over. The lowest coverage is in Bury PCN at 89.9% and highest in Prestwich PCN at 94.4%. Bury PCN has the highest number of children (43) needed to vaccinate and Prestwich PCN has the lowest number of children (3) to vaccinate to reach national target of 95% (Table 7)
Table 7: Vaccination coverage (%) for children receiving MMR vaccination for one dose (2 years) and number needed to vaccinate (NNV) to reach national target of 95% across primary care networks in Bury in 2020-21
Population vaccination coverage: Hib and MenC booster
The Hib and MenC booster enhances the protection provided by the initial course of Hib vaccine administered at 8, 12, and 16 weeks of age, and the MenC vaccine administered at 12 and 16 weeks of age. This enhanced immunity is maintained into adulthood.
This indicator is defined as ‘Children for whom the local authority is responsible who received a booster dose of Haemophilus influenzae type b (Hib) and Meningococcal group C (MenC) vaccine at any time by their second birthday as a percentage of all children whose second birthday falls within the time period.’
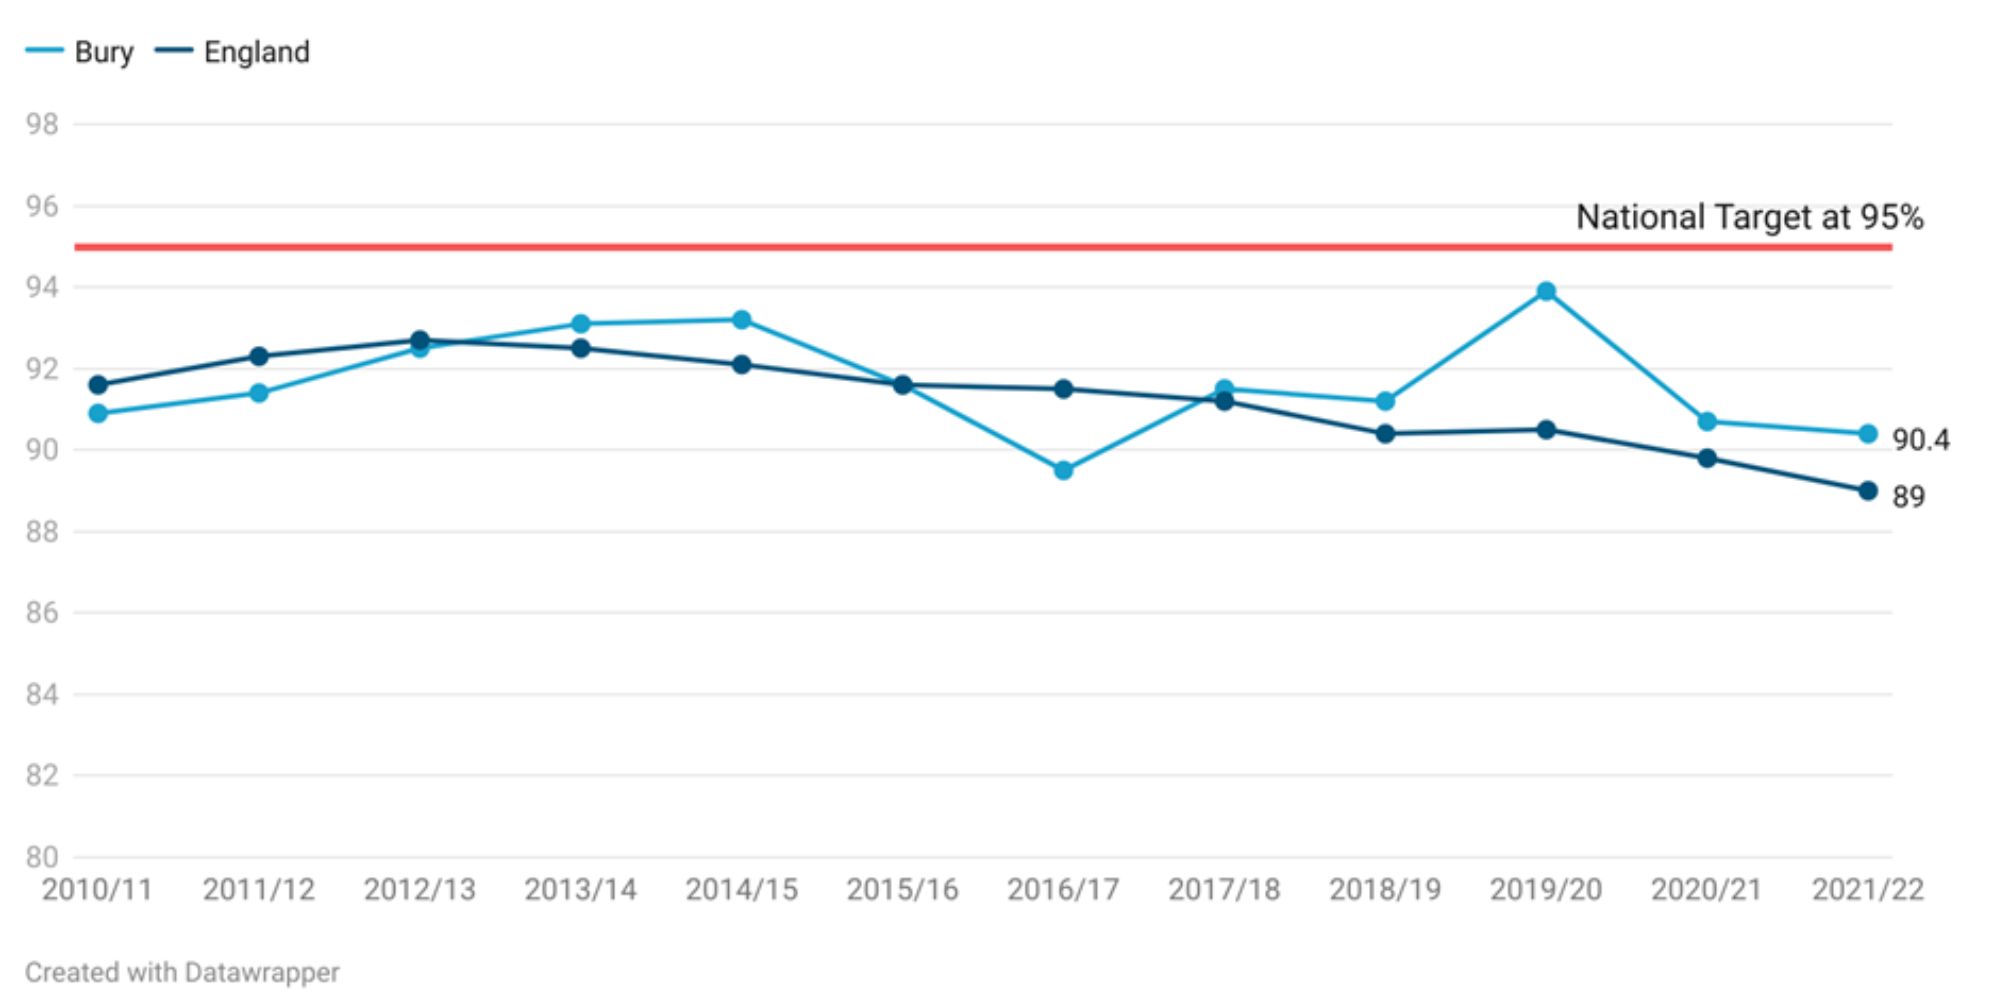
For the year 2021-22, Bury has a vaccination coverage of the Hib and MenC booster of 90.4%, slightly higher than North-West (NW) average of 90.1% and England average of 89%. The coverage in Bury is below the target of 95% and over. Bury needs to vaccinate 102 additional children to reach the national target.
Vaccine coverage in Bury steadily increased from the lowest coverage at 90.9% in 2010/11 to the highest coverage at 93.2% in 2014/15. The coverage then declined to 89.5% in 2016-17. This was followed by an increase in coverage to 91.5% in 2018-19 that continued until 2019-20, where the coverage was 93.9%. In the two most recent years, coverage has declined to 90.7% in 2020-21 and 90.4% in 2021-22. Based on the five most recent data points, there is no statistically significant trend in Bury. Throughout the 11 year period, vaccination coverage for 3 doses of MMR (5 years old) remained below the national target of 95% (Figure 7).
Figure 7: Trend in population vaccination coverage Hib and MenC booster for Bury and England from the year 2010-11 to 2021-22
Bury has the 3rd lowest population vaccination coverage Hib and MenC booster in its group of 6 statistical children service neighbours with the lowest percentage in Calderdale at 89.7% and highest in Stockton-on-Tees at 95.4% (Children and Maternal Health, 2022). There are no data on inequalities at Bury and England levels. Geographical variations data are also not available for this indicator.
Population vaccination coverage: PCV booster
The PCV vaccine protects against pneumococcal infections that can cause pneumonia, septicaemia or meningitis. The PCV vaccine is given to all children under two years old as part of the childhood vaccination programme. This indicator is defined as ‘Children for whom the local authority is responsible who received a booster dose of PCV vaccine at any time by their second birthday as a percentage of all children whose second birthday falls within the time period.’
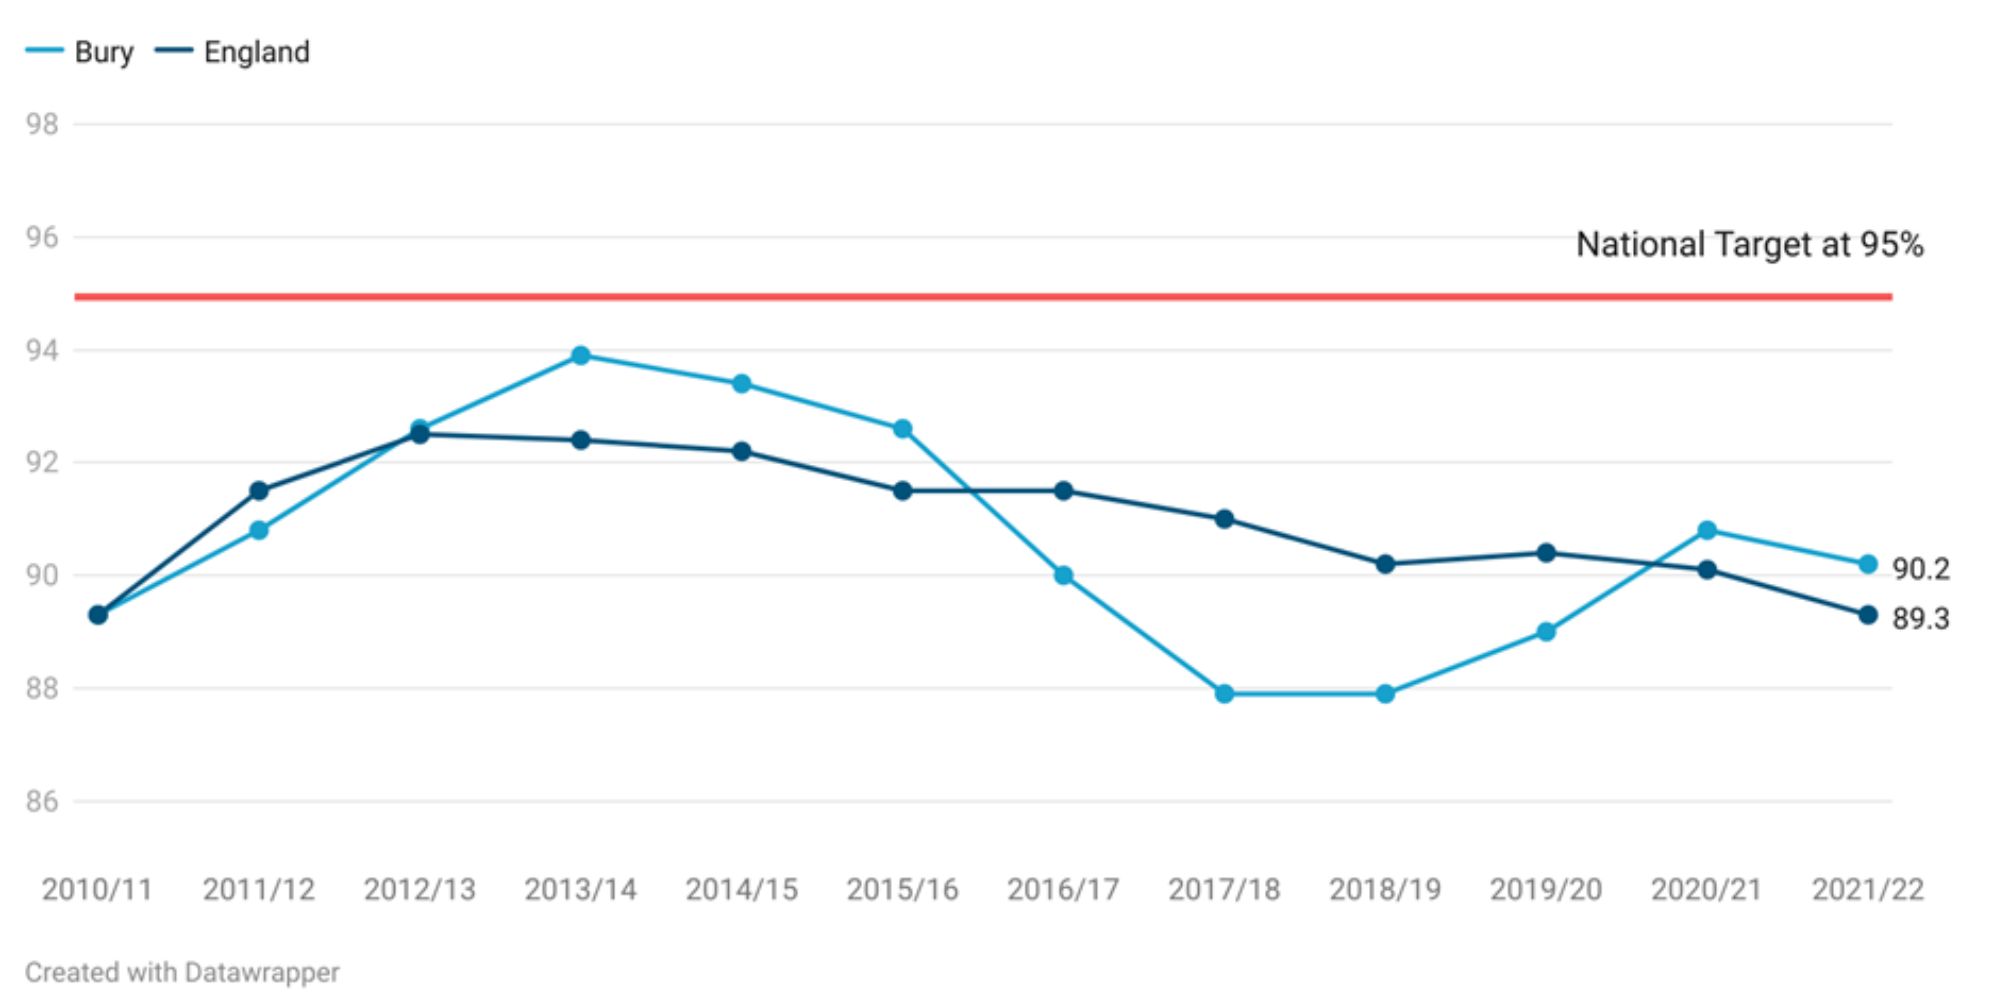
PCV booster coverage in Bury for the period 2021-22 is at 90.2%, slightly higher than NW average of 90.1% and England average of 89.3%. The coverage in all three areas is below the national target of 95% and Bury needs to vaccinate 106 additional children to reach the national target.
Examining data from 2010-22, vaccination coverage for the PCV booster in Bury steadily increased from the lowest coverage at 89.3% in 2010/11 to the highest coverage at 93.9% in 2013/14. This was followed by a decline from 93.4% in 2014-15 to 87.9% in 2018-19. Coverage has increased over the past three years from 89% in 2019-20 to 90.2 in 2021-22. Based on the five most recent data points, coverage in Bury is increasing (statistically significant) and getting better.
England saw an increase in vaccination coverage from 89.3% in 2010-11 to the highest at 92.5% in 2012-13. Coverage remained stable until 2014-15 at 92.2%, before seeing a gradual decrease to 89.3% in 2021-22 (Figure 8).
Figure 8: Trend in PCV booster coverage for Bury and England from the year 2010-11 to 2021-22
Bury has the 2nd lowest PCV booster coverage in its group of 6 statistical children service neighbours with the lowest percentage in Calderdale at 89.9% and highest in Stockton-on-Tees at 92.4% for the year 2021-22 (Children and Maternal Health, 2022). There are no data on inequalities at Bury level but England data suggests decreasing coverage of PCV booster with increasing levels of deprivation. The most deprived decile in England has a coverage of 85.6% compared with 93.2% in the second least deprived decile and 91.4% in the least deprived decile for the year 2021-22 (Child and Maternal Health, 2022).
No geographical data are present for the MMR vaccine by PCN. GP level data are available here.
Emergency care
In England, both Accident & Emergency (A&E) visits and subsequent emergency admissions for infants have increased significantly over the past 15 years. Hospital contact rates among children peak during infancy (one year old), with infants also having the highest proportion of 'inappropriate' accident and emergency (A&E) attendances (attendances to an emergency department that did not result in an admission or any treatment/intervention). Bronchiolitis, upper respiratory viral infections, intestinal infections, gastroenteritis, jaundice, and feeding difficulties are the most common reasons for infant admissions to A&E departments (Nath et al, 2022). Unintentional injuries form a major burden of disease in children and young people and are a major cause of inequality. Unintentional injuries in and around the home are a leading cause of preventable death for children under five years and are a major cause of ill health and serious disability.
A&E attendance 0-4 years old
Bury has a crude A&E attendance per 1,000 population aged 0-4 years of 790.4 in the period 2021-22, higher (statistically significant) than England average of 762.8 per 1,000 but lower than NW average of 888.4 per 1,000 (Maternal and Child Health, 2022). There are no available data on trend in A&E attendance for 0-4 years old for Bury and England.
Amongst Bury’s group of 6 statistical children service neighbours, Bury has the 4th highest A&E attendance per 1,000 population aged 0-4 years, with the highest rate in Stockton-on-Tees at 1,187.5 per 1,000 and lowest in Calderdale at 675.1 per 1,000 (Maternal and Child Health, 2022).
Data on inequalities are present by sex only for Bury that suggest higher A&E attendance rates of 869.5 per 1,000 in males (statistically higher than England average) compared with 704.8 per 1,000 in females ((statistically lower than England average).
Data on inequalities at England level are available by sex and deprivation. Similar to Bury, males have a higher rate of A&E admissions at 831.9 per 1,000 compared with females at 690.3 per 1,000. Examining data by levels of deprivation, the highest A&E attendance rate are in the two most deprived deciles (888.3 in decile 1 and 947.3 in decile 2), decreasing with lower levels of deprivation to 641.6 in the least deprived decile (Maternal and Child Health, 2022).
Emergency admissions (aged 0-4)
Emergency admissions account for approximately 35% of all NHS admissions in England, costing roughly £11 billion per year. Admitting a patient to the hospital as an emergency is expensive and frequently avoidable, yet the number of emergency admissions to hospitals has been increasing for some time. In terms of public health, emergency admissions data provide an indication of broader determinants of poor health, such as housing and transportation. In 2014/15, respiratory infections accounted for more than one-quarter of all emergency hospital admissions in children under the age of five. Smoking in the home and damp housing have been linked to an increase in the risk and severity of respiratory infections in young children (Maternal and Child Health, 2022).
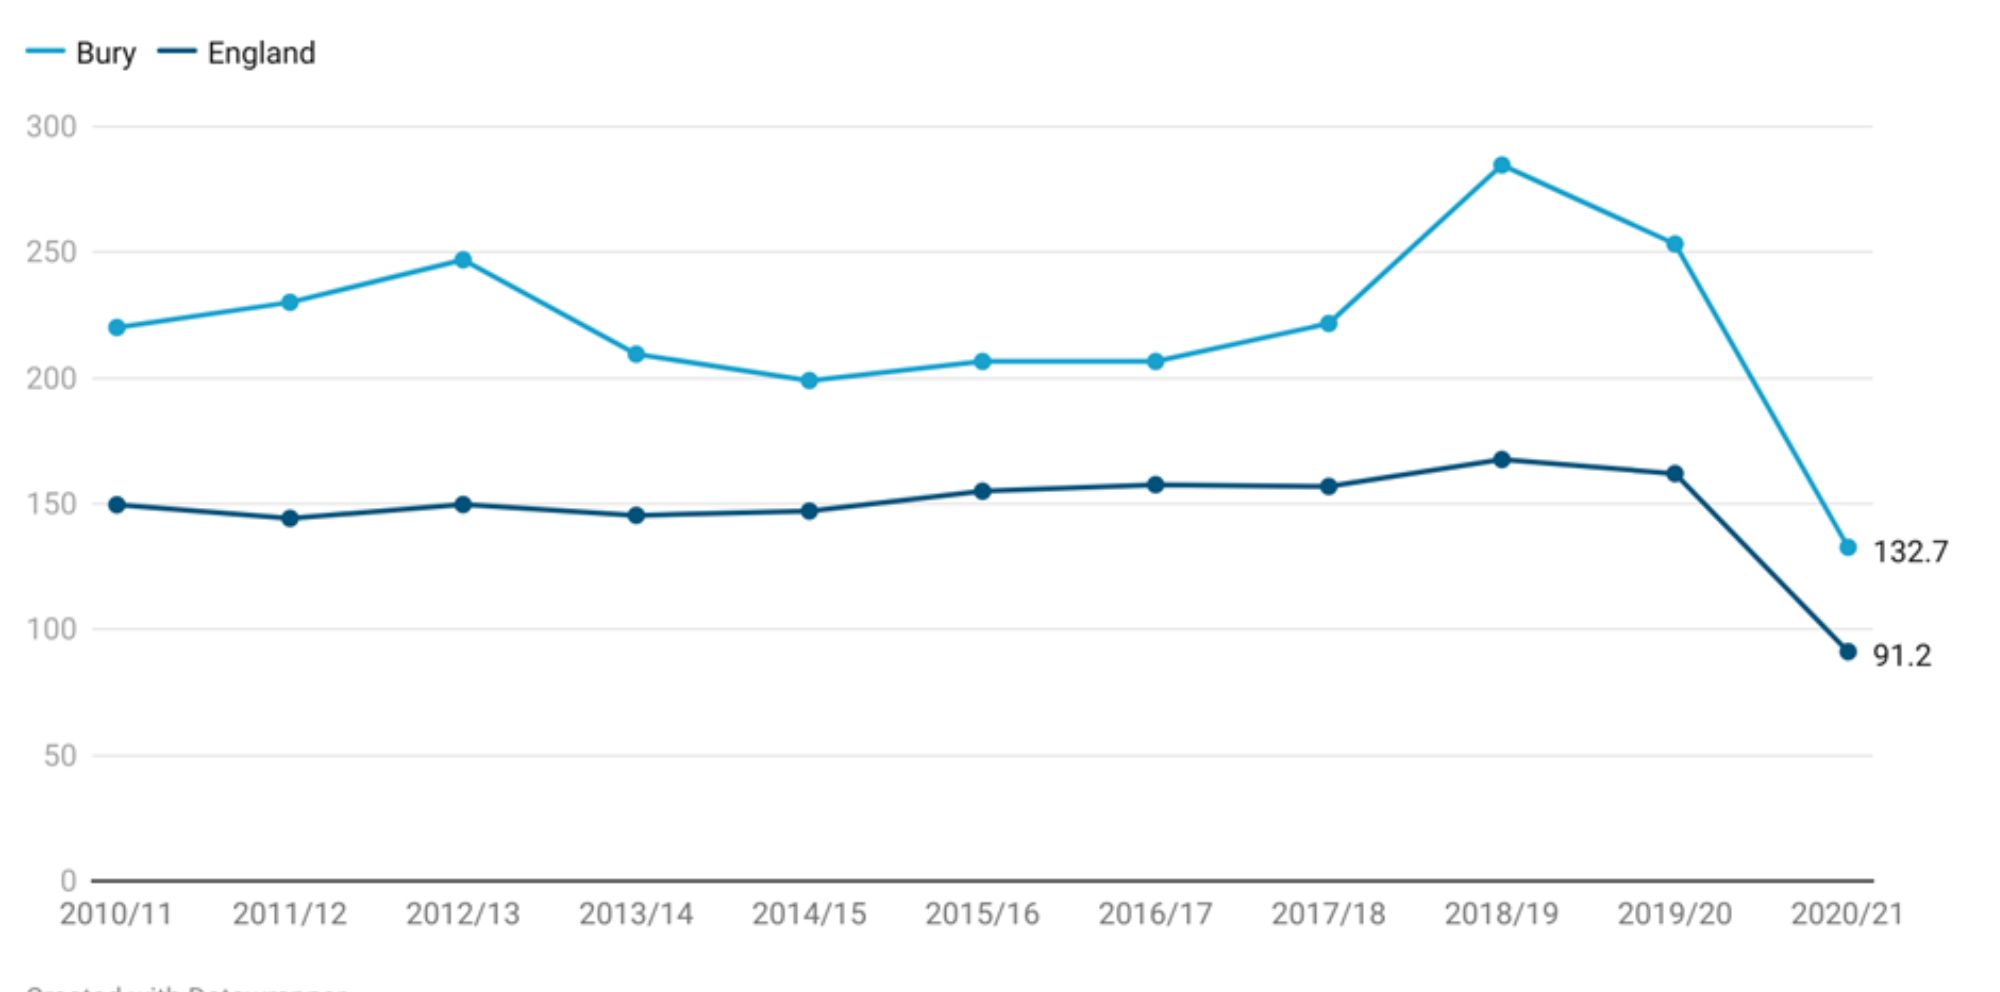
Emergency admissions for children aged 0-4 years are available as crude rate per 1,000 population aged 0-4 years. The trends in crude emergency admissions rates in 0-4 year olds in Bury and England shows some variation over the years, with fluctuations in rates and some differences in trends between the two areas.
In Bury, Emergency admissions rates for children aged 0-4 years gradually increased from 220.1 per 1,000 population aged 0-4 years in 2010-11 to 247 per 1,000 in 2012-13. This was followed by a decline until 2014-15 with a rate of 199 per 1,000 population aged 0-4 years. However, rates then increased from 206.6 in 2015-16 to 284.7 per 1,000 population in 2018-19, before decreasing slightly in 2019/20 to 253.3. The year 2020-21 saw a sharp decline in emergency admissions rates for children aged 0-4 years to 132.7 per 1,000 population aged 0-4 years. Throughout the period 2011-12 to 2020-21, the rates in Bury remained significantly worse than England average. Trend based on the 5 most recent points in Bury do not show any significant change.
In England as a whole, there was a decline in emergency admission rates from 149.6 to 147.1 in 2014-15. This was followed by an increase over the years to 167.6 in 2018-19, before declining to 162 in 2019/20. Similar to Bury, England saw a sharp decline with emergency admission rates at 91.2 in 2020-21 (Figure 9).
The sharp decline observed in Bury and England can be explained by the COVID-19 pandemic that had a large impact on hospital activity with a reduction in admissions in 2020 to 2021
Figure 9: Trend in emergency admission rates per 1,000 population aged 0-4 years for Bury and England from the year 2010-11 to 2020-21
Bury has the 3rd highest rate of emergency admissions in its group of 6 statistical children service neighbours with the lowest rate in Sefton at 96.5 and highest in Stockport at 155.9 for the year 2020-21 (Children and Maternal Health, 2022).
Data on inequalities for Bury are available by Sex only with higher rates in males (149.9 per 1,000) compared with females (114 per 1,000) (Child and Maternal Health, 2022). England data are available by sex and levels of deprivation. Similar to Bury, males aged 0-4 years have a higher admission rate (101.2 per 1,000) compared with females (80.7 per 1,000) Data by deprivation based on LSOA deprivation deciles suggests decreasing emergency admission rates with increasing levels of deprivation. The most deprived decile in England has an admission rate of 106.7 compared with 77.3 in the least deprived decile for the year 2020-21 (Child and Maternal Health, 2022).
Geographical variations in Emergency admissions (aged 0-4)
Data on geographical inequalities are available at both PCN and GP levels. We will be presenting data at PCN levels only. Data at GP levels are available here. Please note data available at PCN level are more up to date available for the year 2021-22 compared with Bury level data that are available up to the year 2020-21.
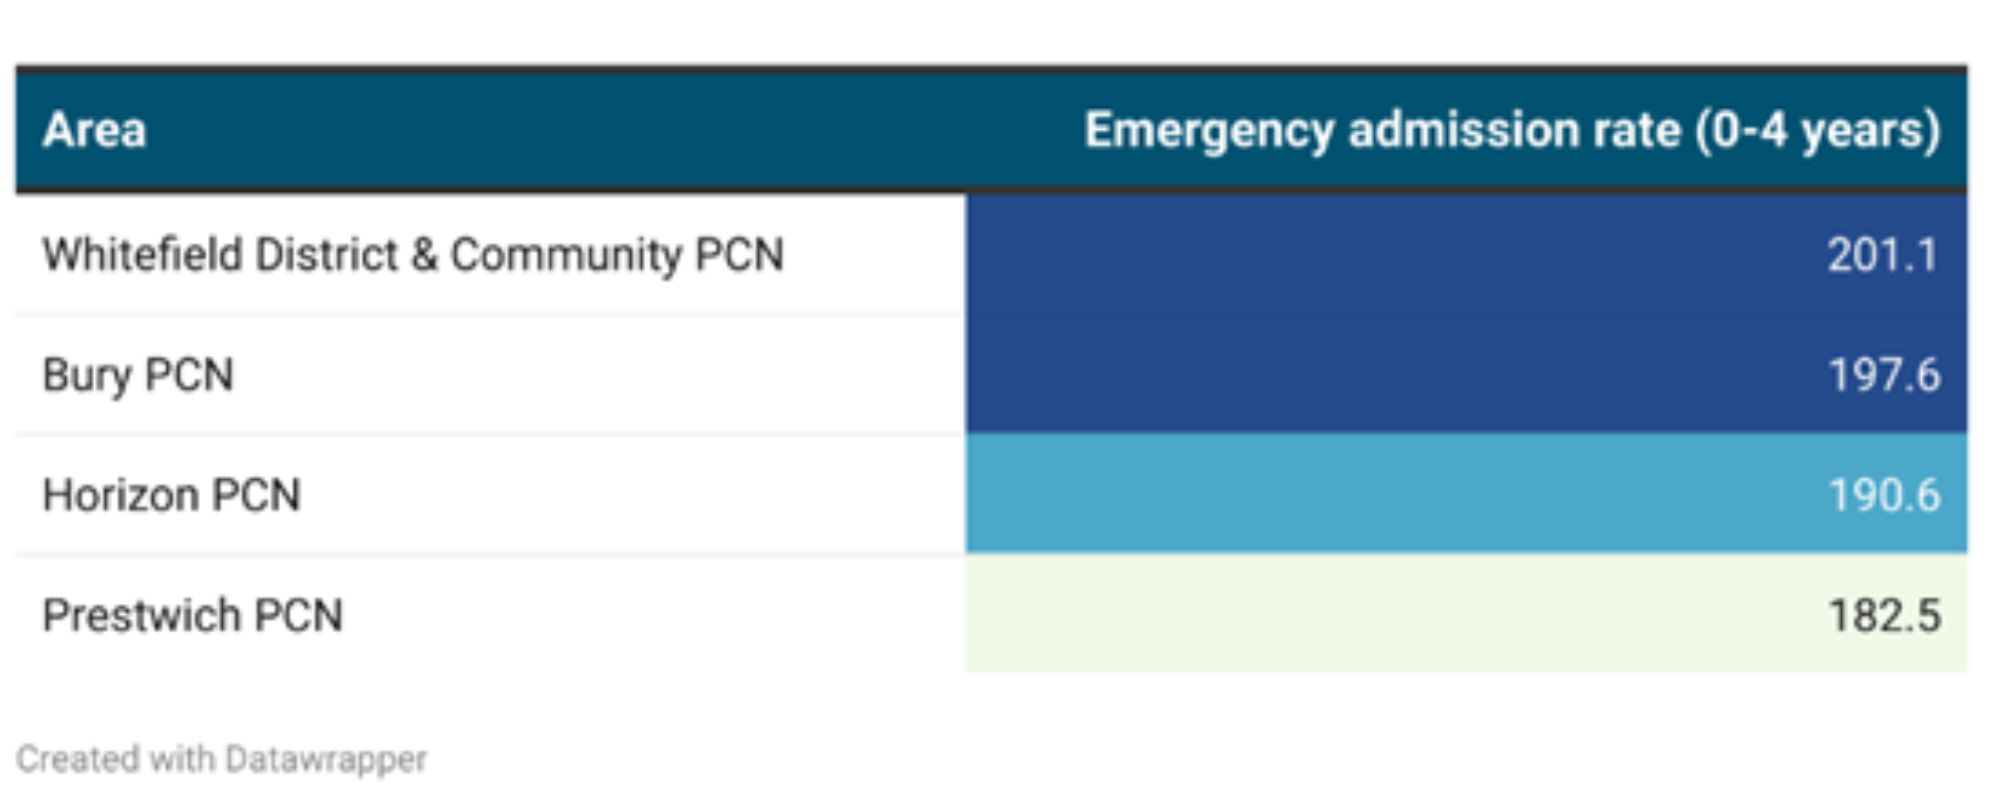
Crude emergency admission rates per 1,000 population aged 0-4 years for the period 2019-20 to 2021-22 is highest in Whitefield District and Community PCN at 201.1 and lowest in Prestwich PCN at 182.5 (Table 8).
Table 8: Emergency admission rates per 1,000 population aged 0-4 years across primary care networks in Bury from 2020-21 to 2021-22
Emergency asthma admissions for children aged 0-9 years
Asthma is the most common chronic medical condition in children in the UK (1.1 million), and it is characterised by varying levels of inflammation in the airways. Symptoms of airways inflammation include coughing, wheezing, shortness of breath, and chest tightness. Standard asthma therapies, when used regularly and correctly, can control inflammation and symptoms in the vast majority of children. Having well-controlled asthma reduces the likelihood of needing hospital care.
Acute asthma episodes are preventable. Often, asthma symptoms are accepted as normal, leaving airway inflammation untreated, increasing chances of those suffering from asthma having a life-threatening asthma attack. As a result, there are increased rates of acute care episodes and preventable deaths.
Understanding local trends in emergency admissions for asthma in children and young people with long-term conditions, as well as benchmarking against geographical and statistical neighbours, will aid in service review and redesign (Child and Maternal Health, 2022).
This indicator covers emergency admissions for asthma for children as crude rates per 100,000 population aged 0-9 years. We have included this indicator as the age range (0-9 years) covers the early years.
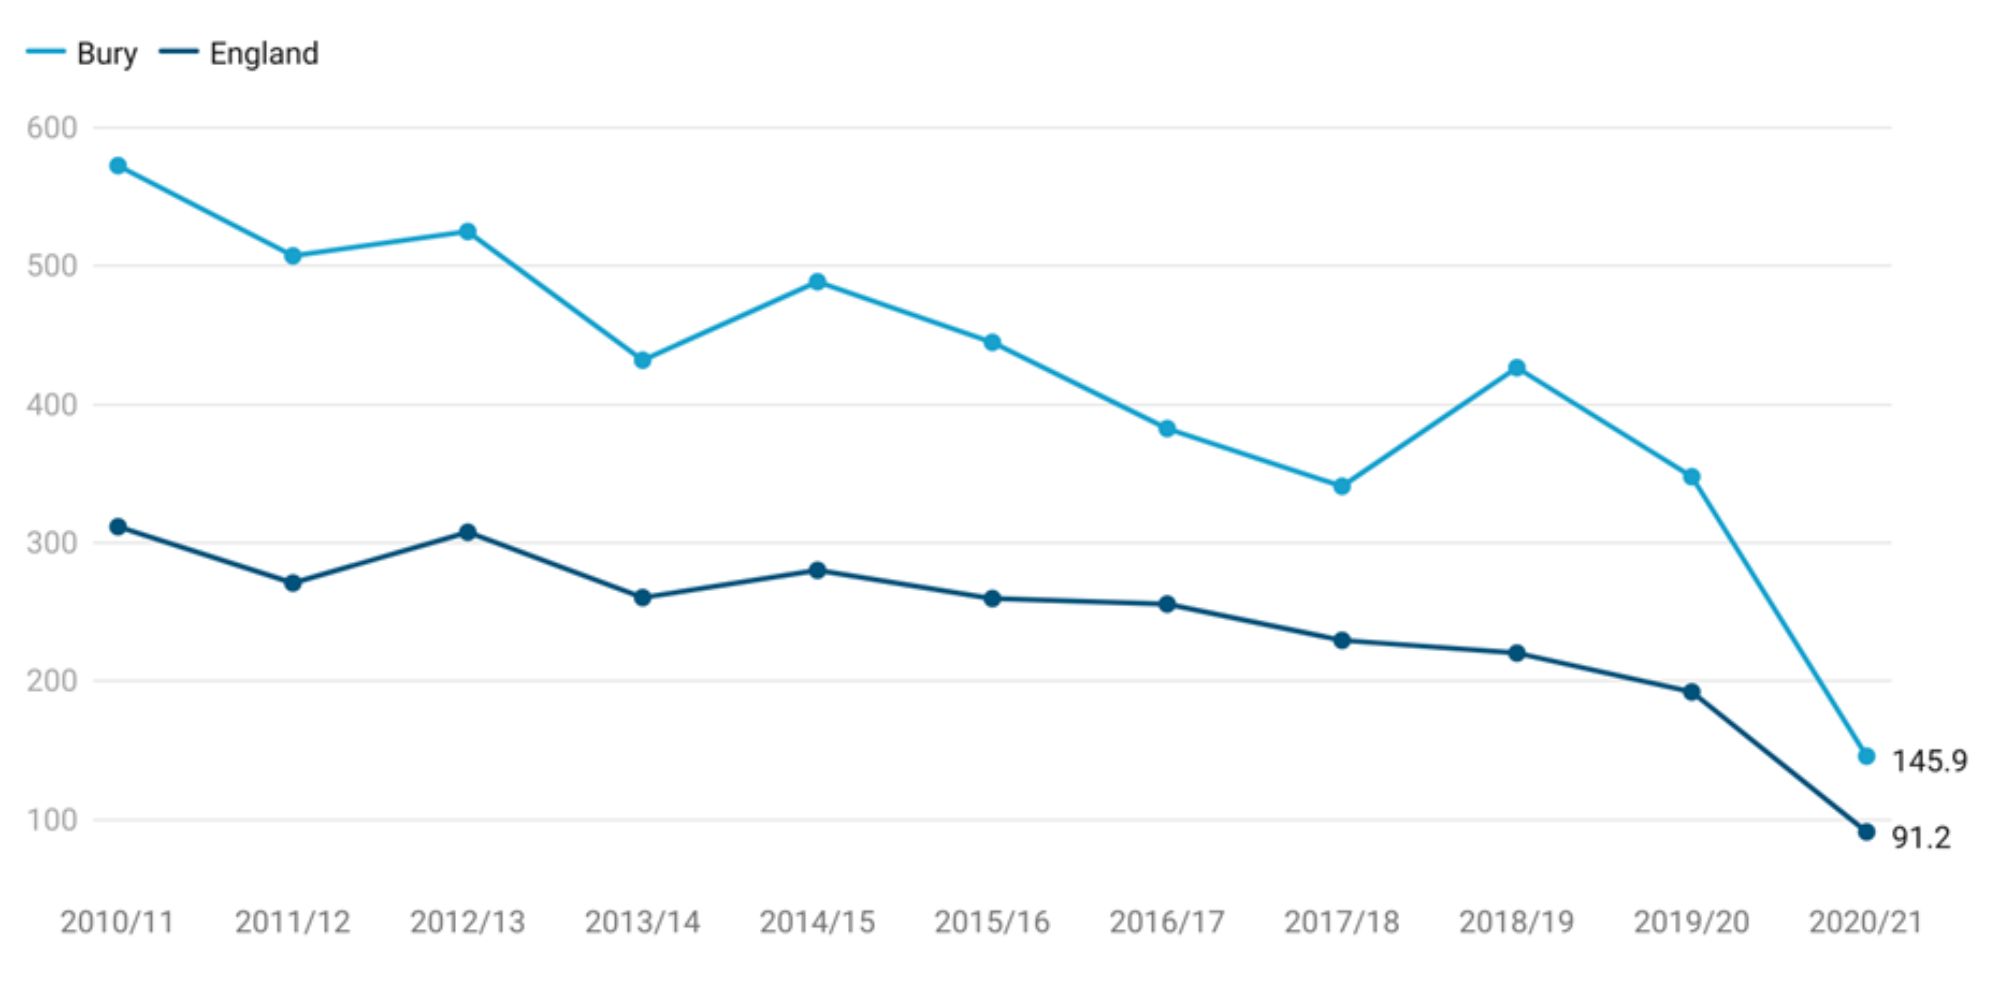
There is a general downward trend (statistically significant) in crude emergency admissions rates for asthma in 0-9 year olds in Bury. However, throughout the period 2010-11 to 2020-21, asthma emergency admission rates in Bury have remained higher (statistically significant) than England average. The highest rate of asthma admissions was 572.6 per 100,000 in 2010-11, which was followed by a steady decline with slight fluctuations to 347.8 per 100,000 in 2019-20. The rate then sharply declined to 145.9 per 100,000 in 2020/21.
In England as a whole, there was a gradual decrease in emergency admission rates for asthma from 311.7 to 192.3 in 2019-20. Similar to Bury, there was a sharp decline in 2020-21 to 91.2 (Figure 10).
The sharp decline observed in Bury and England can be explained by the COVID-19 pandemic that had a large impact on hospital activity with a reduction in hospital admissions in 2020 to 2021.
Figure 10: Trend in crude emergency admission rates for asthma (0-9 years) per 100,000 population aged 0-9 years. for Bury and England from the year 2010-11 to 2020-21
Bury has the highest rate of emergency admissions for asthma in its group of 6 statistical children service neighbours with the lowest rate in Calderdale at 99.5 for the year 2020-21 (Children and Maternal Health, 2022).
Data on inequalities for Bury are available by Sex only with higher rates in males (161.5 per 100,00) compared with females (129.2 per 100,000) (Child and Maternal Health, 2022). England data are available by sex and levels of deprivation. Similar to Bury, males aged 0-9 years have a higher asthma admission rate (116.1 per 100,000) compared with females (65 per 100,000). Data by deprivation based on LSOA deprivation deciles suggests decreasing emergency admission rates with increasing levels of deprivation. The most deprived decile in England has an admission rate of 139.1 compared with 46.3 in the least deprived decile for the year 2020-21 (Child and Maternal Health, 2022).
Injuries
Injuries are a leading cause of hospitalisation and premature mortality in children and adolescents. They are also a source of long-term health problems, such as mental health issues related to the experience(s). Unintentional injuries in and around the home are a leading cause of preventable death for children under five years and are a major cause of ill health and serious disability.
Hospital admissions caused by unintentional and deliberate injuries in children (aged 0 to 4 years)
The admissions data are available as crude rate of hospital admissions caused by unintentional and deliberate injuries in children aged under 5 years per 10,000 resident population aged under 5 years.
Hospital admissions caused by unintentional and deliberate injuries in children (aged 0 to 4 years) in the period 2021-22 for Bury are 139.7 per 10,000 resident population aged under 5 years, higher (statistically significant) than England average of 103.6. There are no available trend data on hospital admissions caused by unintentional and deliberate injuries in children 0-4 years old for Bury and England (Maternal and Child Health, 2022).
Amongst Bury’s group of 6 statistical children service neighbours, Bury has the 2nd highest hospital admissions, with the highest rate in Calderdale at 169.2 per 10,000 and lowest in Stockton-on-Tees at 103.8 per 10,000 (Maternal and Child Health, 2022)
Data on inequalities are present by sex only for Bury that suggest higher hospital admissions rates in males of 148.1 per 10,000 resident population aged under 5 years (statistically similar to England average) compared with 130.7 per 10,000 in females ((statistically similar to England average) (Maternal and Child Health, 2022).
Data on inequalities at England level are available by sex and deprivation. Similar to Bury, males have a higher rate of hospital admissions at 115.1 per 10,000 compared with females at 91.6 per 10,000 resident population aged under 5 years. Examining data by levels of deprivation, the highest hospital admissions rates are in the two most deprived deciles (125.3 in decile 1 and 111 in decile 2) and the lowest in the third least deprived decile (89 per 10,000 resident population aged under 5 years) and the least deprived decile (95.6 per 10,000 resident population aged under 5 years) (Maternal and Child Health, 2022).
Children aged 5 and under killed or seriously injured in road traffic accidents (RTA)
Road traffic accidents are a leading cause of death in children, accounting for a greater proportion of accidental deaths as children grow older. Parents cite vehicle speed and volume as reasons for not allowing their children to walk or cycle, limiting physical activity opportunities (Maternal and Child Health, 2022).
This indicator is measured as a crude rate of children aged 0-5 years who were killed or seriously injured in road traffic accidents per 100,000 population.
There have been no road traffic accidents that have killed or seriously injured children under 5 years of age in Bury from the period 2017-19 to 2018-20. The rate in northwest for the period 2018-20 is 11.1 per 100,000 population higher (statistically significant) than England average of 7 (Maternal and Child Health, 2022).
Amongst Bury’s group of 6 statistical children service neighbours, Lancashire has the highest rate of children aged 0-5 years who were killed or seriously injured in road traffic accidents at 17.8 and Stockport and Bury had the lowest rate (0) with no RTAs involving children under 5 years of age. (Maternal and Child Health, 2022)
Early Childhood Development
There are limited data on child development at 2-2½ years of age for Bury with data for some years missing. Where data are available, there are concerns about the quality of the data. However, data are available on development at the end of the Early Years Foundation Stage (EYFS) measured as school readiness.
School readiness is a key measure of early years development across a wide range of developmental areas. Children from more deprived backgrounds are at a greater risk of poorer development and the evidence shows that differences by social background emerge early in life.
School readiness: percentage of children achieving a good level of development at the end of Reception
This measure is defined as ‘Children defined as having reached a good level of development at the end of the Early Years Foundation Stage (EYFS) as a percentage of all eligible children’.
Examining the data for Bury for the year 2021-22, 63.3% of children achieved a good level of development at the end of EYFS, slightly lower but not statistically different to England average of 65.2% but higher than NW average of 61.7%. There are no available trend data for Bury and England (Maternal and Child Health, 2022). Amongst Bury’s group of 6 statistical children service neighbours, Bury has the 3rd lowest percentage in terms of school readiness, with the highest percentage in Stockton-on-Tees at 68.1% and lowest in Sefton at 60.8% (Maternal and Child Health, 2022).
Data on inequalities at Bury level are only available by sex and by free school meal status. Data from 2021-22 shows that a lower percentage (58.6%) of males in Bury achieved a good level of development at the end of Reception compared with females (68.3%) (Maternal and Child Health, 2022). Only 50.3% with a record of free meal status achieve a good level of development at the end of Reception (Maternal and Child Health, 2022).
Data on inequalities at England level are available by sex, deprivation, month born, special education needs (SEN) status, first language status and ethnic group for the year 2021-22.
Similar to Bury, a lower percentage (58.7%) of males in England achieved a good level of development at the end of Reception compared with females (71.9%). Data by deprivation for England shows that as the levels of deprivation increases, the percentage of children who reach a good level of development at the end of Reception decreases. 60.1% of children in the most deprived decile (decile 1) reached a good level of development compared with 69.5% in the least deprived decile (decile 10). Examining data by ethnic groups, a higher proportion of children from mixed/multiple ethnic groups (70%) reach a good level of development at the end of Reception, followed by white ethnic group (66.3%) and Asian/Asian British including Chinese (64.9%). Black/African/Caribbean/Black British (60.6%) and other ethnic groups (55.3%) have the lowest proportion of children reaching a good level of development. Comparing school readiness by SEN, a higher proportion of children with no identified SEN (70.9%) achieve a good level of development at the end of Reception compared with development in those children receiving SEN support (22.9%) and with a statement of EHCP (27.6%).
No data on geographical variations in Bury are available.
School readiness: percentage of children achieving at least the expected level in communication and language skills at the end of Reception
According to the 2018-2019 remit letter, the Office for Health Improvement and Disparities is expected to drive improvements in outcomes at scale, with a particular focus on child health speech, language, and communication needs, and school readiness. Disparities in child language abilities are noticeable in the second year of life and have a clear impact by the time children enter school. If these children are not supported, they are more likely to fall short of their full potential. The Office for Health Improvement and Disparities has received funding to train Health Visitors in the use of a new communication and language assessment tool to identify problems at 2 to 2 and a half years of age and to plan interventions for children who are developing below the expected level.
As part of the Department for Education's (DfE) plan to improve social mobility through education, their ambition to close the "word gap" focuses on the development of key early language and literacy skills for disadvantaged pupils or those not achieving their full potential.
Each year, the Early Years Foundation Stage Profile is used to inform child development plans, informing Key Stage 1 teachers and parents about each child's development and needs. The data from the communication and language early learning goal check provides teachers and service planners with information on children's ability to communicate effectively and whether additional intervention is required to meet the standard.
The communication and language development indicator of school readiness is used to measure the impact of Early Years services (including the universal and non-universal aspects of health visiting) and also regarded as an important social determinant of longer term health, education and life chances. It is defined as ‘Children defined as having reached at least the expected level of development in communication and language skills at the end of the Early Years Foundation Stage (EYFS) as a percentage of all eligible children.’ (Maternal and Child Health, 2022).
Examining the data for Bury for the year 2021-22, 80% of children achieved at least the expected level in communication and language skills at the end of Reception, slightly higher (not statistically different) than England average of 79.5% and higher than NW average of 76.5%. There are no available trend data for Bury and England (Maternal and Child Health, 2022). Amongst Bury’s group of 6 statistical children service neighbours, Bury has the 3rd highest percentage of children achieving at least the expected level in communication and language skills, with the highest percentage in Stockton-on-Tees at 81.7% and lowest in Sefton at 76.4% (Maternal and Child Health, 2022).
There are no data on inequalities at Bury level.
Data on inequalities at England level are available by sex, deprivation, free school meal status, month born, special education needs (SEN) status, first language status and ethnic group for the year 2021-22.
Similar to Bury, a lower percentage (74.3%) of males in England achieved at least the expected level in communication and language skills at the end of Reception compared with females (85%). Only 68% of children with a free school meal status achieved the communication and language skills compared with 82% of children not eligible for free school meals. Data by deprivation for England shows that as the levels of deprivation increases, the percentage of children who achieve at least the expected level in communication and language skills at the end of Reception decreases. Around 74.2% of children in the most deprived decile (decile 1) achieve at least the expected level compared with 84.2% in the least deprived decile (decile 10). Examining data by ethnic groups, a higher proportion of children from white ethnic groups (81.6%) achieve at least the expected level at the end of Reception, followed by mixed/multiple ethnic groups (80.8%) and Asian/Asian British including Chinese (75.2%). Black/African/Caribbean/Black British (73%) and other ethnic groups (67%) have the lowest proportion of children achieving at least the expected level. Comparing school readiness by SEN, a higher proportion of children with no identified SEN (85.5%) achieve at least the expected level in communication and language skills at the end of Reception compared with children receiving SEN support (37.1%) and with a statement of EHCP (43.9%).
There are no data on geographical variations in Bury.
Oral Health
The most common dental pathologies in the UK are dental caries (tooth decay) and periodontal (gum) disease. Tooth decay has become less common in the last two decades, but it remains a major health and social issue. It causes tooth crown destruction and frequently causes pain and infection. Dental disease is more prevalent in deprived areas than in affluent communities.
Hospital admissions for dental caries (0-5 years) is a good direct measure of dental health as well as an indirect, proxy measure of child health and diet (Maternal and Child Health, 2022). It is defined as ‘Finished consultant episodes for dental caries among children aged 0-5, rate per 100,000 population aged 0-5 years’
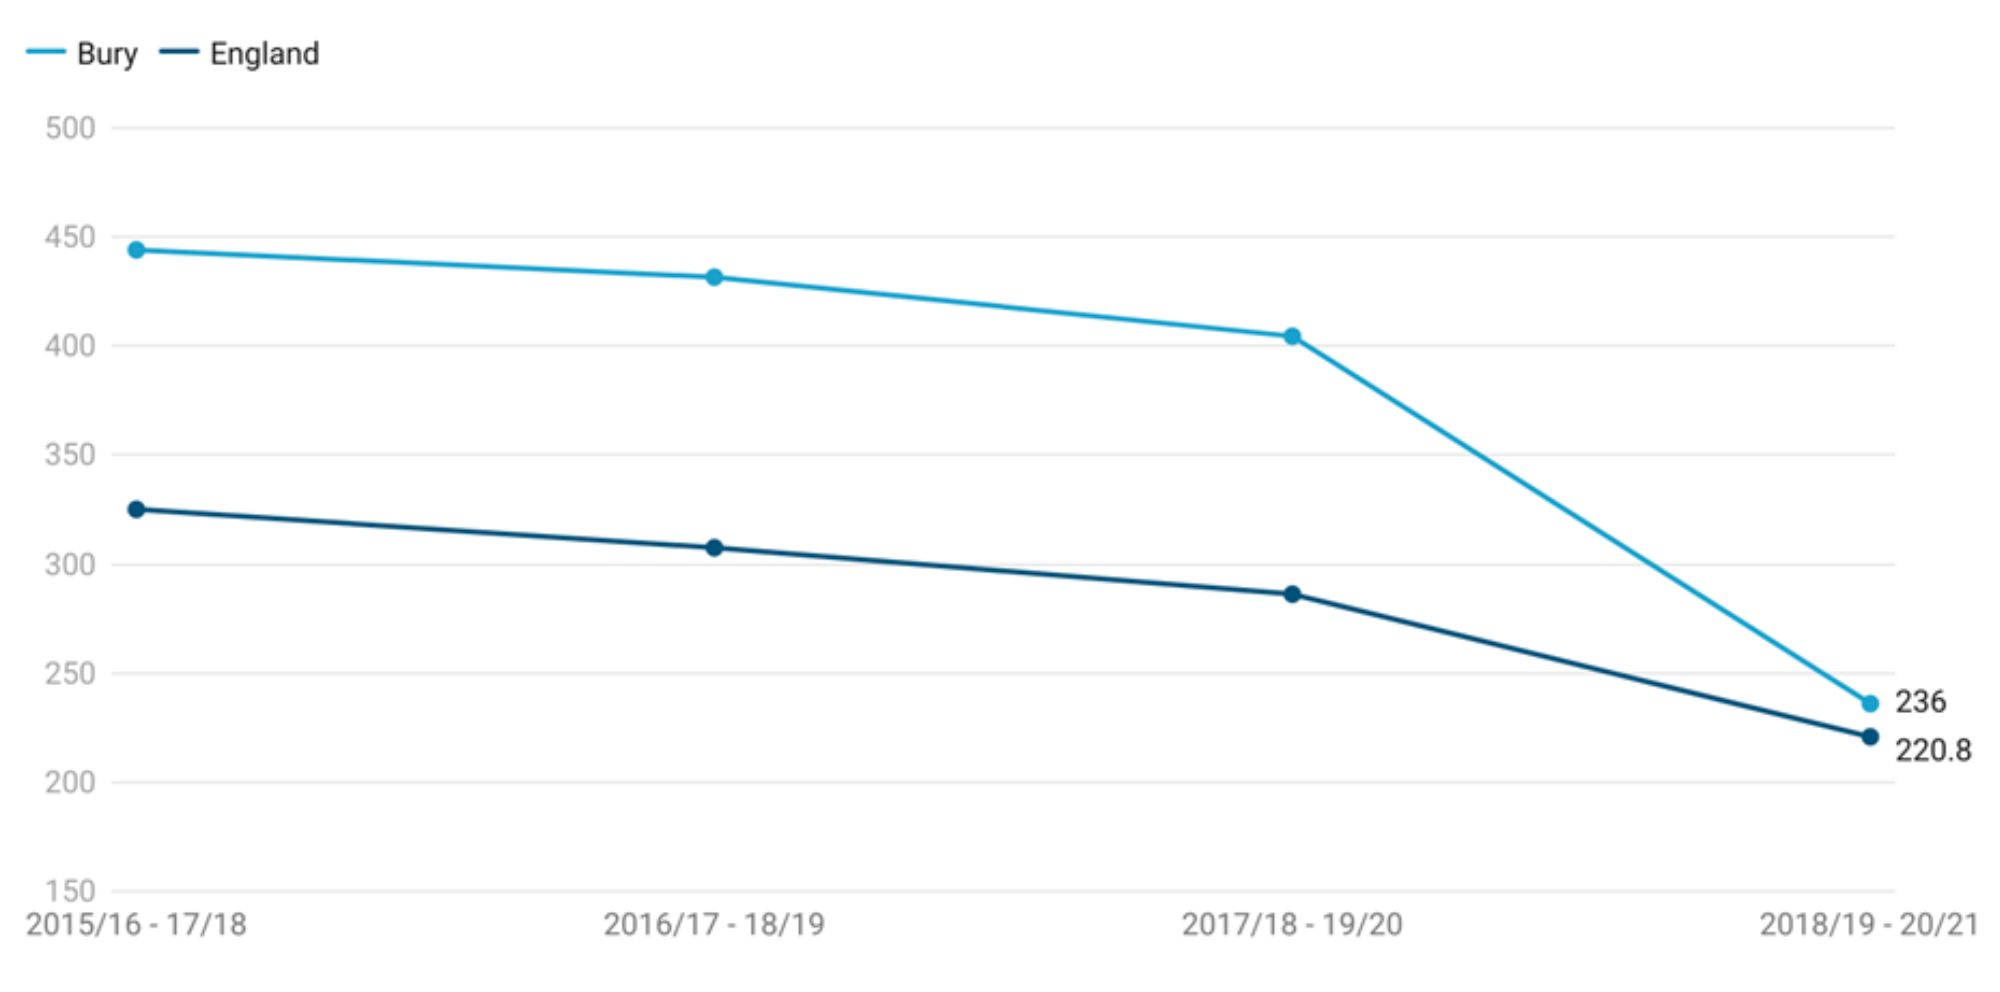
Examining the data for Bury for the period 2018-19 to 2020-21, the admission rate in Bury was slightly higher at 236 per 100,000 than England average of 220.8 per 100,000 but lower than NW average of 332.8 per 100,000.
Between the period 2015/16 – 2017/18 and 2017/18-2019/20, admissions for dental caries declined from 444.1 to 404.5. A similar decline was seen in England when the rate declined from 325.1 to 286.2. During the period 2018/19 to 2020-21, there was a sharp decline in Bury to 236 and 220.8 in England. This is likely due to COVID-19 and its impact on hospital admissions rather than improvement in child health and diet (Figure 11).
Figure 11: Trend in rates of Hospital admissions for dental caries (0-5 years)per 1,000 population aged 0-4 years for Bury and England from the year 2015-16 to 2020-21
Bury has the 2nd lowest hospital admission rates for dental caries (0-5 years) in its group of 6 statistical children service neighbours with the lowest rate in Stockton-on-Tees at 90 and highest in Lancashire at 499.1 for the period 2018/19-2020/21(Children and Maternal Health, 2022).
Data on inequalities for Bury are available by Sex only with higher rates in males (273.5 per 100,000) compared with females (195.8 per 100,000) (Child and Maternal Health, 2021). England data are available by sex and levels of deprivation. Similar to Bury, males aged 0-4 years have higher admission rates for dental caries (233.8 per 100,000) compared with females (207 per 100,000). Data by deprivation (based on LSOA deprivation deciles) suggests increasing hospital admission rates for dental caries (0-5 years) with increasing levels of deprivation. The most deprived decile in England has an admission rate of 441 compared with 73.4 in the least deprived decile for the period 2018/19-2020/21 (Child and Maternal Health, 2022).