
This section provides an overview of the age profile of Bury’s resident population, followed by a breakdown into broad age groups: babies and infants (0-4 years), children (5-11 years), young people (12-17 years), working-age adults (18-64 years), and older people (65 years and over).
Based on the results of the Census 2021, the most common age of people living (modal age) in Bury is 56 years. The median age (age that divides a population into two numerically equally sized groups; that is, half the people are younger than this age and half are older) of people living in Bury is 40 years, similar to England and Wales and the same as the figure for Bury in the 2011 census. Within Bury, Summerseat and Elton Vale are the areas with the highest median age of 51 years, whereas Sedgley Park has the lowest median age of 30 years. Table 1 below shows the median age for people living in each Middle Super Output Area (MSOA) in Bury. An MSOA (Middle Layer Super Output Area) is a statistical geography used in the UK for census data. It typically includes a population of 5,000 to 15,000 people.
Table 1: Median age in each MSOA in Bury (Census 2021)
| MSOA | Median age |
| Sedgley Park | 30 |
| Fernhill & Pimhole | 33 |
| Buckley Wells & Fishpool | 35 |
| Bank Top & Radcliffe East | 36 |
| Besses | 36 |
| Fairfield & Jericho | 37 |
| Whitehead Park | 37 |
| Radcliffe | 37 |
| Outwood Gate | 38 |
| Prestwich East | 38 |
| Redvales & Hollins | 40 |
| Whitefield East | 40 |
| Prestwich Clough & Rainsough | 40 |
| Prestwich Central | 40 |
| Black Lane | 41 |
| Kirkhams & Holyrood | 41 |
| Ramsbottom | 43 |
| Walmersley & Limefield | 43 |
| Higher Woodhill | 43 |
| Walshaw & Woolfold | 44 |
| Ainsworth & Bradley Fold | 45 |
| Unsworth | 47 |
| Whitefield West & Park Lane | 47 |
| Nuttall & Tottington | 48 |
| Summerseat | 51 |
| Elton Vale | 51 |
The age groups with the greatest health needs tend to be the very young and the very old. The under-5 population in Bury is estimated at 11,157 (5.8% of total) and the over-90 population at 1,445 (0.7% of total).
Table 2 below presents a more detailed breakdown of Bury’s resident population by sex and five-year age group using Census 2021 data. The most common 5-year age categories in Bury are: the 30-34 age band for the entire population (7%), the 55-59 age band for males (7% of the total male population), and the 30-34 age band for females (7.2% of the total female population).
Table 2: Resident population of Bury by gender and 5-year age group (Census 2021)
| Age (5 year age band) | Male | Male | Female | Female | All | All |
| Number (n) | % of total | Number (n) | % of total | Number (n) | % of total | |
| 0 ‒ 4 | 5,775 | 6.1 | 5,382 | 5.5 | 11,157 | 5.8 |
| 5 ‒ 9 | 6,436 | 6.8 | 6,055 | 6.1 | 12,491 | 6.4 |
| 10 ‒ 14 | 6,551 | 6.9 | 6,298 | 6.4 | 12,849 | 6.6 |
| 15 ‒ 19 | 5,938 | 6.2 | 5,294 | 5.4 | 11,232 | 5.8 |
| 20 ‒ 24 | 4,847 | 5.1 | 4,702 | 4.8 | 9,549 | 4.9 |
| 25 ‒ 29 | 5,592 | 5.9 | 5,942 | 6.0 | 11,534 | 5.9 |
| 30 ‒ 34 | 6,413 | 6.7 | 7,064 | 7.2 | 13,477 | 7.0 |
| 35 ‒ 39 | 6,437 | 6.8 | 6,922 | 7.0 | 13,359 | 6.9 |
| 40 ‒ 44 | 5,908 | 6.2 | 6,169 | 6.2 | 12,077 | 6.2 |
| 45 ‒ 49 | 6,195 | 6.5 | 6,292 | 6.4 | 12,487 | 6.4 |
| 50 ‒ 54 | 6,571 | 6.9 | 6,873 | 7.0 | 13,444 | 6.9 |
| 55 ‒ 59 | 6,685 | 7.0 | 6,775 | 6.9 | 13,460 | 6.9 |
| 60 ‒ 64 | 5,660 | 6.0 | 5,627 | 5.7 | 11,287 | 5.8 |
| 65 ‒ 69 | 4,534 | 4.8 | 4,894 | 5.0 | 9,428 | 4.9 |
| 70 ‒ 74 | 4,776 | 5.0 | 5,197 | 5.3 | 9,973 | 5.1 |
| 75 ‒ 79 | 3,203 | 3.4 | 3,808 | 3.9 | 7,011 | 3.6 |
| 80 ‒ 84 | 2,103 | 2.2 | 2,711 | 2.7 | 4,814 | 2.5 |
| 85 ‒ 89 | 1,044 | 1.1 | 1,737 | 1.8 | 2,781 | 1.4 |
| 90 and over | 439 | 0.5 | 1,006 | 1.0 | 1,445 | 0.7 |
| Total | 95,107 | 49.1 | 98,748 | 50.9 | 193,855 |
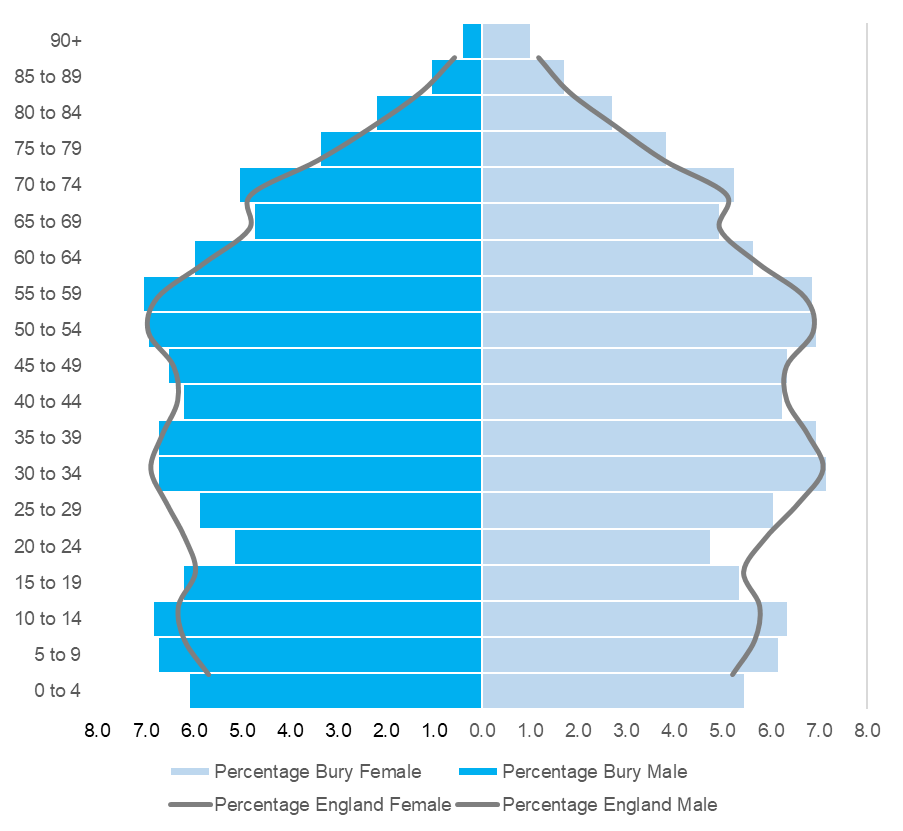
Figure 1 below presents the population pyramid for Bury and compares the age distribution of Bury with that of England. Compared to England, Bury has a higher percentage of both males and females aged 0 to 14, and a lower percentage of both males and females aged 20 to 39.
For all other age groups, the distribution is similar to England
Figure 1: Population pyramid presenting the percentage composition by 5-year age group and sex of resident population in Bury compared with England (Census 2021)
Age Groups
Breakdown of the Bury population through the life course is presented next using broad age groups such as babies & infants, children, young people, working age adults and older people. All results presented here are from Census 2021
Over half (59%) of Bury’s resident population is of working age (18-64 years), 5.8% are babies and infants (0-4 years), 9.1% are children (5-11 years), 7.8% are young people (12-17 years) and 18.3% are older adults (65+ years) (Figure 2).
Figure 2: Percentage of Bury population by broad age groups (Census 2021)

Babies & infants (0-4 years of age)
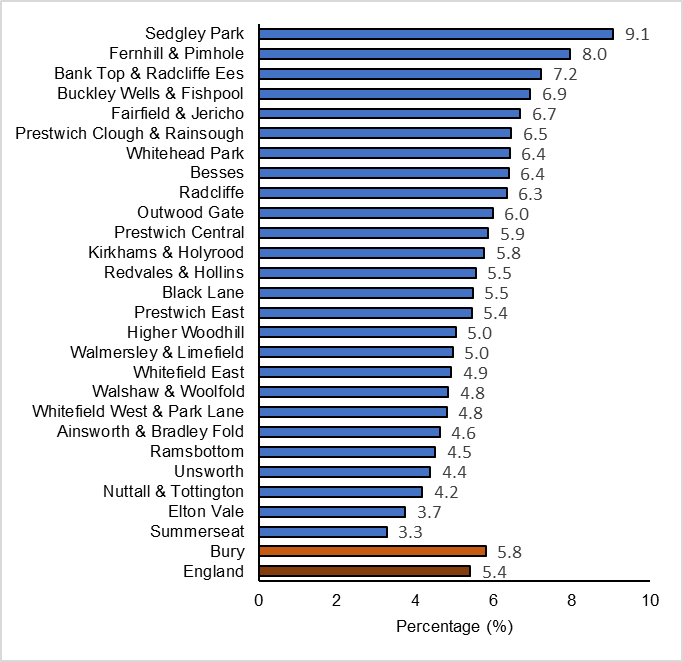
Bury had 11,157 babies and infants (0-4 years of age) in 2021. Babies and infants represented 5.8% of the total population in Bury, similar to the England average of 5.4%. Sedgley Park has the highest proportion of babies and infants, with 9.1% of the total population under 5 years of age, whereas the lowest proportion (3.3%) of under 5s is in Summerseat. Figure 3 below presents the proportion of the population aged 0-4 years living in each Middle Super Output Area (MSOA) in Bury as a percentage of the total population in that MSOA.
Figure 3: Proportion of population aged 0-4 years living in each Middle Super Output Area (MSOA) in Bury as a percentage of the total population in that MSOA (Census 2021)
Children (5-11 years of age)
There are 17,688 children (5-11 years old) representing 9.1% of the population in Bury, which is higher than the England average of 7.2%. Sedgley Park has the highest proportion of children (15.3%), whereas the lowest proportion is in Elton Vale and Nuttall & Tottington (7.4%). Figure 4 below presents the proportion of the population aged 5-11 years living in each Middle Super Output Area (MSOA) in Bury as a percentage of the total population in that MSOA.
Figure 4: Proportion aged 5-11 years living in each Middle Super Output Area (MSOA) in Bury as a percentage of the total population in that MSOA (Census 2021)

Young People (12-17 years)
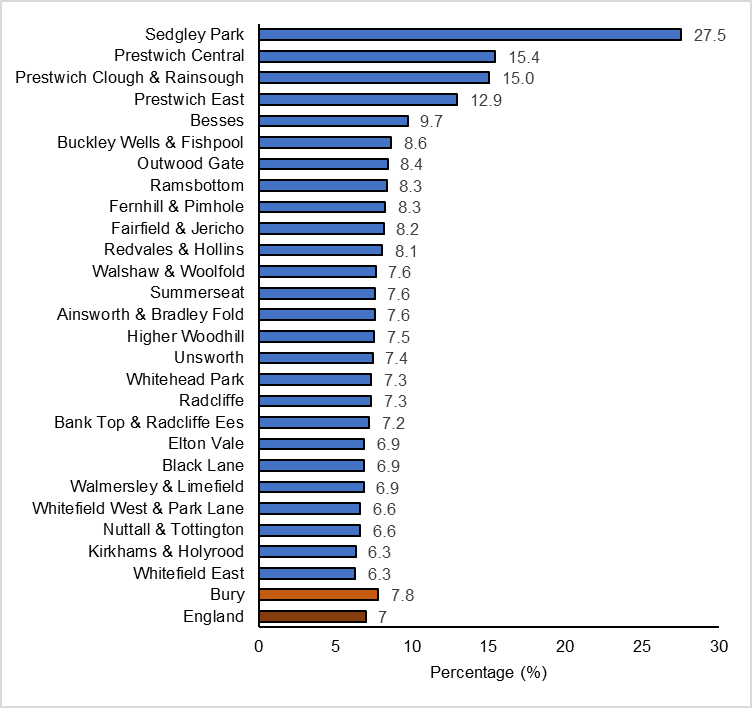
There are 15,031 young people in Bury, accounting for 7.8% of the total population in the borough slightly higher than England average of 7%. The highest proportion of young people is in Sedgley park with 27.5% of the population aged 12-17 years, nearly 3.5 times higher than the average for Bury, followed by Prestwich Central (15.4%). Kirkhams and Holyrood and Whitefield East (6.3) have the lowest proportion of young people. Figure 5 below presents the proportion of population aged 12-17 years living in each Middle Super Output Area (MSOA) in Bury as a percentage of the total population in that MSOA.
Figure 5: Proportion of population aged 12-17 years living in each Middle Super Output Area (MSOA) in Bury as a percentage of the total population in that MSOA (Census 2021)
Working age adults (18-64 years)
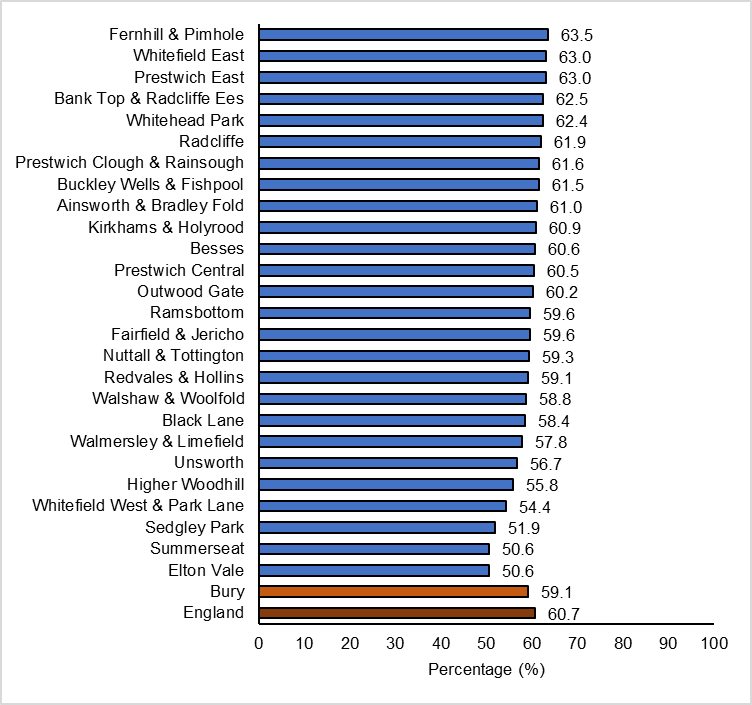
Bury has 114,526 working-age adults (59.1%), which is slightly lower than the England average of 60.7%. Fernhill and Primhole have the highest proportion (63.5%) of the population aged 18-64 years, while Elton Vale and Summerseat have the lowest proportion of working-age adults (50.6%). Figure 6 below presents the proportion of the population aged 18-64 years living in each Middle Super Output Area (MSOA) in Bury as a percentage of the total population in that MSOA.
Figure 6: Proportion of population aged 18-64 years living in each Middle Super Output Area (MSOA) in Bury as a percentage of the total population in that MSOA (Census 2021)
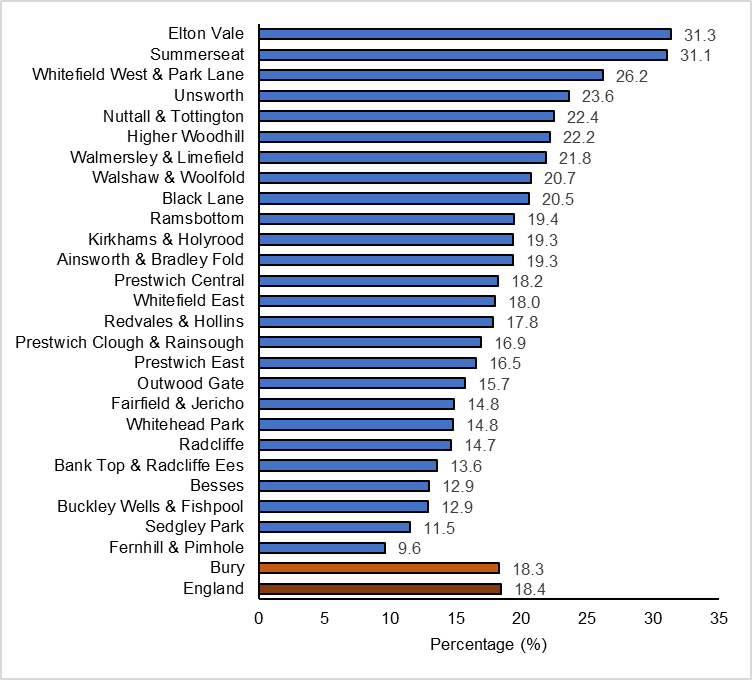
Older adults (65 years and over)
There are 35,447 older adults (18.3%) in Bury, similar to the England average of 18.4%. Elton Vale (31.3%) and Summerseat (31.1%) have the highest proportion of older adults, while Fernhill and Pimhole (9.6%) have the lowest proportion. Figure 7 below presents the proportion of the population aged 65 years and over living in each Middle Super Output Area (MSOA) in Bury as a percentage of the total population in that MSOA.
Figure 7: Proportion of population aged 65 years and over living in each Middle Super Output Area (MSOA) in Bury as a percentage of the total population in that MSOA (Census 2021)
Population change in Bury comparing Census 2021 to Census 2011
Between the 2011 and 2021 Censuses, Bury's population increased by 4.7%, from approximately 185,100 to 193,800, which is slightly lower than the growth rates of the Northwest (5.2%) and England (6.6%). Nearby areas like Salford and Manchester have seen their populations increase by around 15.4% and 9.7%, respectively, while others such as Blackburn with Darwen saw an increase of 5.0%, and Rossendale saw smaller growth (4.1%).
The population change in Bury is not uniform across all age groups. Table 3 below presents Bury ‘s population by broad age group with percentage change across these groups and comparison with England between Census 2011 and Census 2021.
Table 3: Bury‘s population by broad age group with percentage change across these groups and comparison with England between Census 2011 and Census 2021.
| Bury | Bury | Bury | England | |
| Age Groups | 2011 | 2021 | % change | % change |
| 0-4 years (babies & infants) | 12,235 | 11,157 | -8.8 | -7.3 |
| 5-11 years (children) | 15,467 | 17,688 | 14.4 | 13.6 |
| 12-17 years (young people) | 14,250 | 15,031 | 5.5 | 2.9 |
| 18-64 years (working age adults) | 113,568 | 114,526 | 0.8 | 3.9 |
| 65+ years (older people) | 29,540 | 35,447 | 1.8 | 20.1 |
| Total | 185,060 | 193,849 | 4.7 | 6.6 |
Census 2021 results show that the number of babies and infants (0-4 years) in Bury decreased by 8.8%, a higher decline compared to the national average of 7.3%. The population of children (5-11 years) in Bury grew by 14.4%, slightly above the national increase of 13.6%. Young people (12-17 years) in Bury saw a 5.5% increase, which is higher than the 2.9% increase in England. The working-age adult population (18-64 years) in Bury experienced a modest growth of 0.8%, compared to a 3.9% increase nationally. The most significant growth in Bury was among older adults (65+ years), with a 20.0% increase, closely mirroring the national growth rate of 20.1%.
Demographic shifts in Bury highlight the need for balanced planning to address the challenges of an ageing population while supporting younger age groups and sustaining economic growth. A decline in the number of infants suggests a potential future decrease in younger cohorts, while the increase in children and young people highlights immediate pressure on education and youth services. The slow growth in the working-age population could impact economic activity and labour availability. Meanwhile, the significant rise in the elderly population will drive demand for healthcare, social care, and other support services.