 and Public Health Profiles")
Deaths
This section offers information on mortality indicators from the Office for National Statistics (ONS) and public health profiles to assist local decision-makers in assessing outcomes across a variety of causes of death in Bury.
Mortality statistics in England are based on the details collected when deaths are certified and registered. Statistics on deaths are used by a number of public and private sector organisations such as the UK Health Security Agency (UKHSA) to inform policy decisions, monitor population health or measure progress against goals such as reducing stillbirth (ONS, 2023).
At the local authority level, ONS mortality data can be used in a variety of ways to inform local policies and decision-making. Examples across different functions include the following:
· Public health: Identifying the main causes of death in communities and determining the most effective interventions to address them. By examining trends in mortality rates age, sex and causes of death, public health planners can develop targeted interventions and strategies to improve the health of local communities. Additionally, they can monitor health inequities within their populations and create targeted interventions to reduce them. For instance, using data on cardiovascular disease related deaths in their local population, local authorities can implement targeted public health interventions to reduce smoking rates or increase levels of physical activity.
· Adult social care: Identifying vulnerable groups in the community including older adults, individuals with chronic health conditions, or deprived population groups to develop programmes and services that meet the specific needs of these groups.
· Environmental Health: Mortality data can be used to identify environmental factors that may be contributing to poor health outcomes in the community. For example, high mortality rates for respiratory diseases may indicate poor air quality in certain areas. This information can be used to prioritise environmental health initiatives and to target resources to the areas that need them most.
· Emergency Management: Emergency management teams (EMTs) can use mortality data to examine trends in mortality rates during crisis like natural disasters or disease outbreaks. A recent example of using mortality data is the COVID-19 pandemic. Data on deaths from COVID-19 were the subject of intense scrutiny globally from the outset of the pandemic, and were important in situational awareness, particularly when testing was more limited, and in understanding the severity of disease in different groups.
Total Deaths:
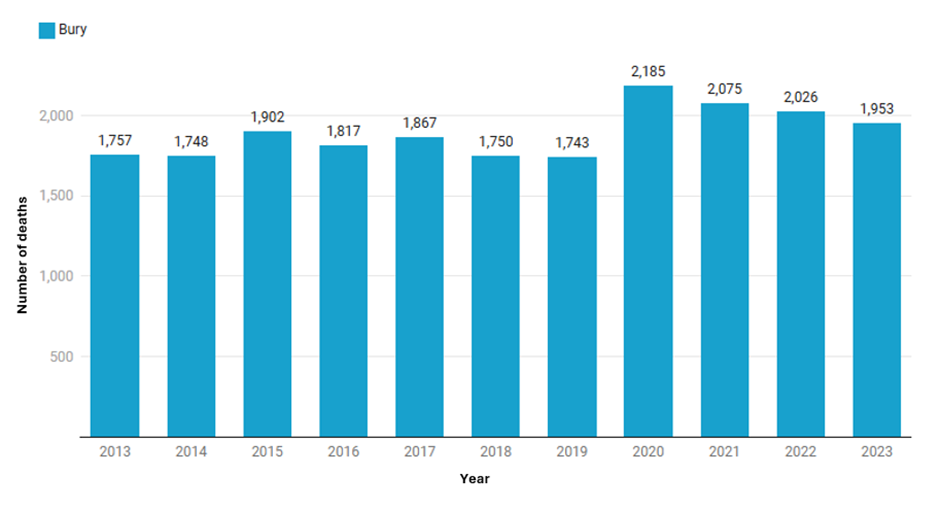
In Bury, there are approximately 1,800 deaths annually from all causes and at all ages (the ten-year average from 2013-2023 is 1,893 deaths). The number of deaths increased in the years 2015, 2020 and 2021 in Bury, with the highest number of deaths (2,185) in the year 2020 (Figure 1), and having decreased gradually since then.
Figure 1: Number of annual deaths from all causes and all ages in Bury for the years 2013 to 2023 (ONS, 2023)
Examining the number of deaths by age (Figure 2 below), the number of deaths increase from 45 years and over with a sharper increase after 75 years of age
Figure 2: Number of annual deaths from all causes by age categories in Bury for the years 2013 to 2023 (ONS, 2023)
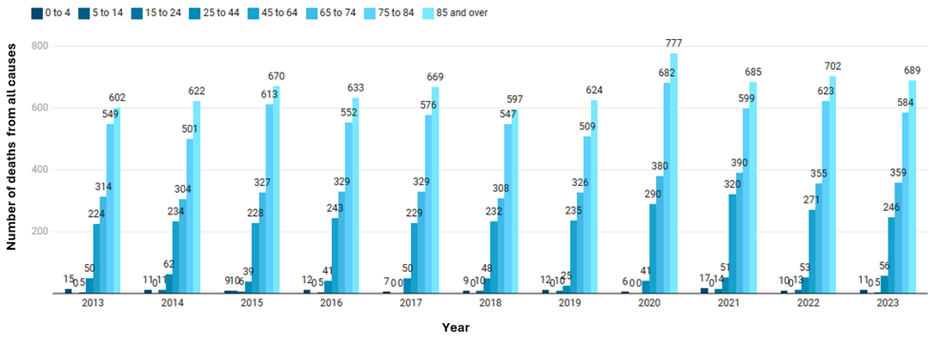
This can be due to a combination of factors related to aging and increased vulnerability to various health conditions due to age. A number of observations can be made when examining the number of deaths from all causes in all age from the years 2013 to 2023:
- There were higher number of deaths in over 75s in 2015. This is likely due to the number of excess winter deaths in 2014/15 due to influenza A(H3N2) that was particularly virulent in elderly people, an already at-risk group, and resulted in numerous care home outbreaks (ONS, 2015).
- A spike in the number of deaths was again seen in the year 2017 for over 75 years of age. For this year, the number of excess winter deaths in England and Wales were the highest recorded since winter 1975 to 1976 and one third of the deaths were from respiratory disease (ONS, 2018).
- Another spike was seen in the year 2020 and 2021 for those aged 75 years and over. The COVID-19 pandemic was largely responsible for the increase in deaths among people over 75 years of age in 2020 and 2021. Age is a significant risk factor for severe outcomes from COVID-19 and compared to people under 40 years old, the chances of dying from COVID-19 are 70 times higher for those aged over 80 and 50 times higher among those aged 70-79. This is likely due to older people being more likely than younger people to have underlying health problems (LGA, 2021).
Infant mortality
Infant mortality is an indicator of the general health of population reflecting both the availability and quality of healthcare services as well as broader social and economic and environmental factors. It is measured as number of deaths of infants under one year of age per 1,000 live births. Infant mortality rate can be split by neonatal deaths (under 28 days) and post-neonatal deaths (between 28 days and 1 year). Over the past 40 years, infant mortality rates have significantly declined across the UK countries. However, compared to other European countries, development has slowed over the past twenty years.
Some infant deaths can be prevented by targeting interventions to reduce the modifiable risk factors that occur in around a third of infant deaths. These factors have a multiplier effect where greater number of these factors can make the infant more vulnerable. The most common modifiable risk factors are smoking in pregnancy, obesity in pregnancy and household smoking. In addition to these, there are protective factors that can reduce infant mortality and include vaccinations (including flu vaccination for pregnant women), breastfeeding, and safe-sleeping practices.
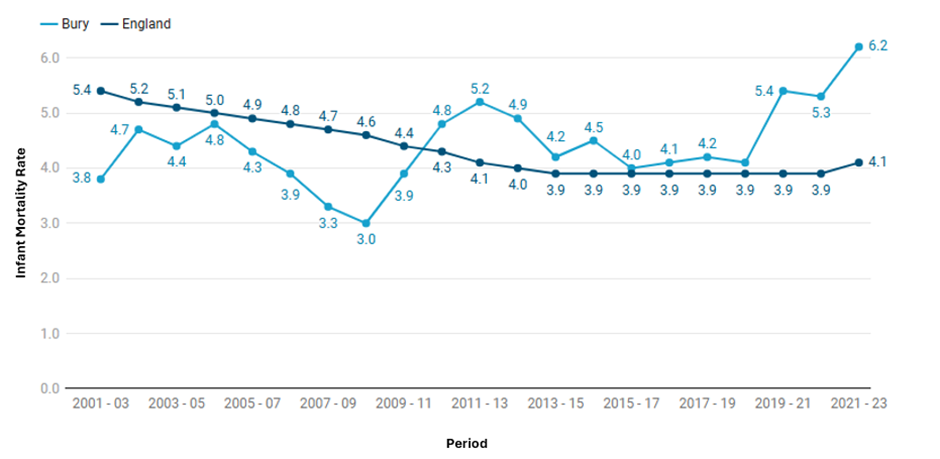
The infant mortality rate for Bury is 6.2 per 1000 live births and is statistically worse compared to England average of 4.1 per 1000 live births (Child and Maternal Health Profile, 2023).
Figure 3: Trend in infant mortality in Bury from the period 2001-2003 to 2021-23
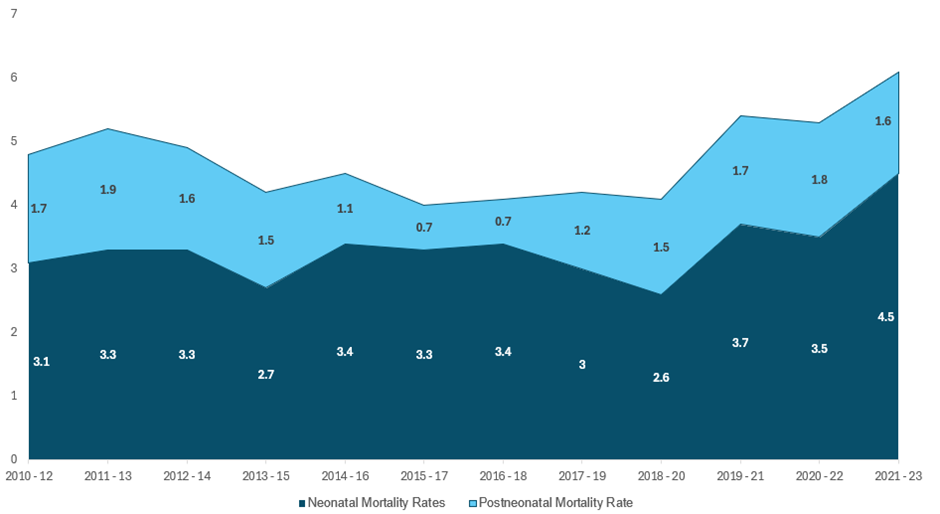
Neonatal mortality (deaths under 28 days per 1000 live births) is 4.5 for Bury, higher and statistically worse than the England average of 3 per 1000 live births (Child and Maternal Health Profile, 2023). Since the period 2010-12, Bury had the highest number of neonatal deaths (28) in the period 2021-23. Post neonatal mortality rate for Bury is 1.6 per 1000 live births is statistically similar to England average of 1.1 (Child and Maternal Health Profile, 2023). Due to small numbers, this could be due to random year-to-year fluctuations. Figure 4 below presents the trend in infant mortality by neonatal and post-neonatal mortality in Bury, and we can see that deaths under 28 days (neonatal mortality) makes the highest contribution to the infant mortality rates in Bury.
Figure 4: Trend in infant mortality by neonatal and post-neonatal mortality in Bury from the period 2010-12 to 2020-22
There is currently no national target for the infant mortality rate in England but the government has a national ambition in England to achieve 50% reductions in neonatal mortality by 2030. The lack of data at local level means it is not possible to examine inequalities with the exception of sex for neonatal mortality, but data for England suggests local inequalities by deprivation and ethnicity, where deprived areas, black ethnic groups and Asian ethnic groups see higher infant mortality rates (Nuffield Trust, 2022). Data for Bury by sex suggests higher neonatal mortality rates for males (3.2 per 1000 live births) compared with females (2.6 per 1000 live births). Although neonatal mortality is generally 20% higher in boys than girls due to biological phenomena, research suggests that socioeconomic factors such as income and education are associated with these differences in neonatal mortality rates between males and females (Kramer et al, 2002).
Premature mortality (Deaths under 75 years of age):
Premature mortality or deaths under 75 years of age are measured using the directly age-standardised mortality rate (DASMR), which is typically reported separately for males and females. This measure corrects for variations in age distribution between populations. The DASMR for all under-75-year-old deaths offers a way to compare mortality rates across populations while taking age structure differences into account. This is important because premature mortality, or deaths that take place before the age of 75, can be a key sign of a population's general health. Public health officials and policymakers can pinpoint areas where interventions may be required to improve health outcomes and decrease premature mortality by monitoring changes in DASMR over time and across different population groups. These rates are usually calculated as three-year rolling rates to account for random fluctuations in mortality rates due to small sample sizes or short-term events such as disease outbreaks.
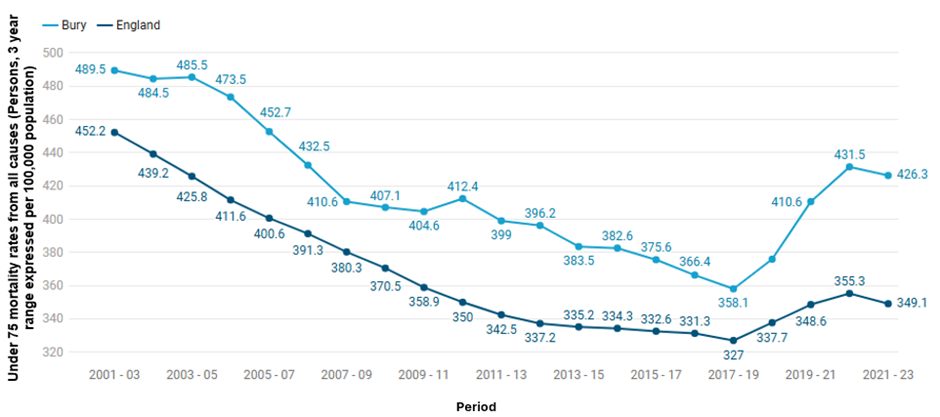
Premature mortality from all causes in Bury has been falling from 489.5 per 100,000 population in 2001-03 to 426.3 per 100,000 population in 2021-23. A greater decline has been seen in England where the rates declined from 452.2 per 100,000 population in 2001-03 to 349.1 per 100,000 population. This constant downward trend in mortality rates continued for both Bury and England until 2017-19. From the period 2018-20 to 2020-22, premature mortality in Bury and England increased (with a sharper rise in Bury) before falling slightly to its current rate of 426.3 in Bury and 349.1 in England during 2021-23 The rise is likely due to the impact of COVID-19. From the period 2001-03 to 2021-23, premature mortality rates in Bury have continued to remain above and statistically worse than the average for England (Figure 5). Premature mortality from specific causes will be discussed later in the section.
Figure 5: Under 75 mortality rates from all causes (Persons, 3 year range expressed per 100,000 population) for Bury and England from the period 2001-2003 to 2021-2023 (Mortality Profile, 2023)
Inequalities
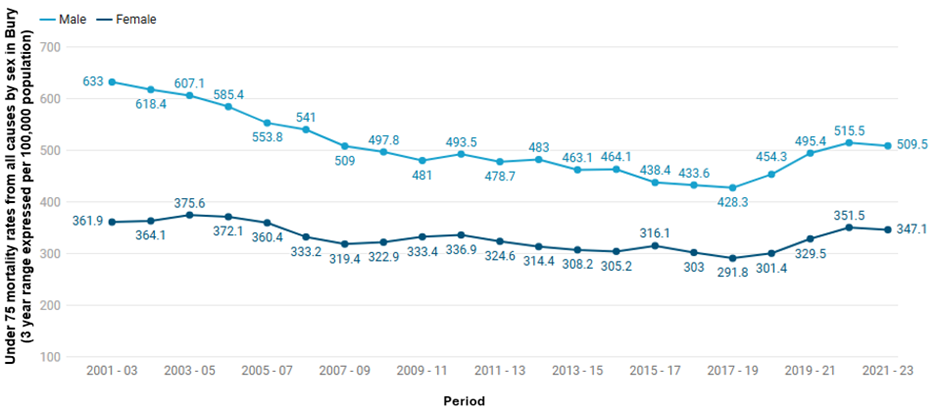
We lack the necessary data at local levels to examine inequalities apart from inequalities by sex. Premature mortality rates per 100,000 from all causes remained higher for males compared with females. The rates decreased for males under 75 from 633 in 2001–2003 to 509.5 in 2021–2023, and for females it decreased from 361.9 to 347.1 during the same time period. There was a slight increase in both male and female premature mortality rates from 2017-19 to 2020-22. Overall, the trend shows a decreasing premature mortality rate from all causes for males until 2017-19, whereas the premature mortality rate for females has slightly fluctuated but remained stable (Figure 6).
Premature mortality rates from all causes for England followed a similar overall pattern with decline in rates for males from 455.1 in 2008-10 to 429.2 in 2021-2023, and for females the rates declined from 290.6 in 2008-2010 to 273.3 in 2021-2023. Compared to the average for England, the rates in Bury remained above the average (statistically significant) for males and females throughout the observed time period.
Figure 6: Under 75 mortality rates from all causes for males and females (3 years range expressed per 100,000 population) for Bury from the period 2001-2003 to 2021-2023 (Mortality Profile, 2023)
Inequalities by sex for premature mortality rates are widely documented in England, where males consistently have higher rates of premature death than females. Various factors may contribute to this difference, including biological, behavioural, and social risk factors. For example, biological differences between males and females may play a role, as men are more likely to have higher levels of testosterone and lower levels of oestrogen, which can lead to an increased risk of cardiovascular diseases and other health issues. Additionally, males may be more likely to smoke or drink alcohol, which increase their likelihood of premature deaths or delay seeking medical attention/adhere less to recommended treatments, which can exacerbate the severity of their health conditions (NHS digital, 2019).
Data by deprivation levels for premature mortality rates are not available at Bury level. However, data for England shows increasing rates of premature mortality as the levels of deprivation increases. The rate of premature mortality is almost twice as high (509.6 per 100,000 population) in the most deprived areas of England compared to the least deprived areas (275.3 per 100,000 population).Over time the gap between the most and least deprived decile in England has remained stable but has slightly increased over the last 2 data periods from 2018-20 to 2020-22.
Premature mortality (deaths under 75 years of age) from causes considered preventable
Public health frameworks define preventable deaths under 75 years of age that could have been avoided through timely and effective public health interventions. These include a wide range of causes of death such as suicide and self-inflicted injuries and homicide/assault; ischaemic heart disease (IHD), some cancers, alcohol related diseases, illicit drug use disorders. The Public Health Outcomes Framework (PHOF) presents premature mortality rates for all cause (preventable), cancer, cardiovascular disease, liver disease and respiratory disease. Deaths from all cause considered preventable will be discussed below and for the specific causes in the later sections.
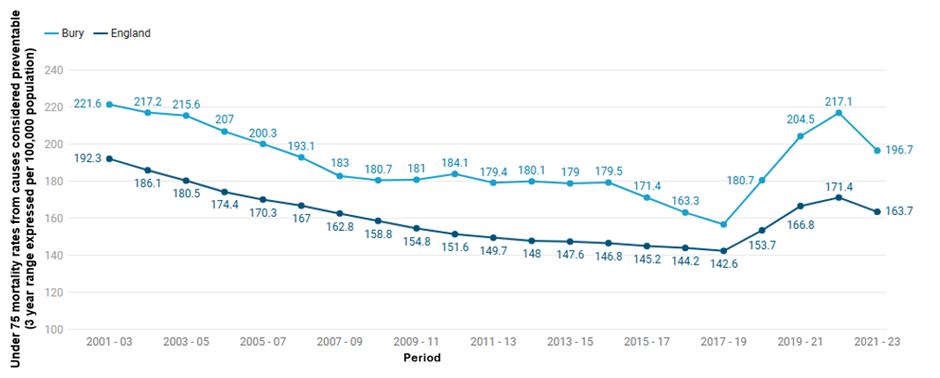
Figure 6 presents age standardised under 75 mortality rates from causes considered preventable (2019 definition) (Persons, 3 year range) from 2001-2003 to 2021-23 for Bury and England (Mortality Profile, 2023). The rates are presented per 100,000 population. Bury saw a continuous steady decline in preventable deaths rates from 221.6 in 2001-03 to 156.9 in 2017-19, followed by a rise from 180.7 in 2018-20 to 217.1 in 2020-22. The most recent data period of 2021-23 showed a slight decline to 196.7. The rates in Bury have continued to remain above England’s average since 2001-03 (Figure 7). Similar to Bury, England saw a decline from 192.3 per 100,000 population in 2001-03 to 142.6 per 100,000 population in 2017-19. This was followed by a rise from 153.7 in 2018-20 to 171.4 in 2020-22 and then a slight decline to 163.7 in 2021-23.
Figure 7: Age standardised under 75 mortality rates from causes considered preventable (2019 definition) (Persons, 3 year range) from 2001-2003 to 2021-23 for Bury and England (Mortality Profile, 2023).
Inequalities
Data on inequalities for Bury are available by sex only. Premature mature mortality rates from causes considered preventable remained higher for males compared with females throughout the period 2001-03 to 2021-23. However, the rates have been decreasing for males over the years from 312.3 in 2001–03 to 199.7 in 2017-19, followed by an increase to 277.2 in 2020-22 and then a slight decrease to 249.2. The rates in females remained fairly stable but have increased from 139.8 in 2001-03 to 146.4 in 2021-23 (Figure 8).
Premature preventable mortality rates for England saw a decline in rates for males from 266.8 in 2001-03 to 216.3 in 2021-23, and for females the rates declined from 123.2 in 2001-03 to 113.9 in 2021-23. Compared to the average for England, the rates in Bury remained worse (statistically significant) than the England average for females throughout the observed time period, with the exception of 2002-04 where they were statistically similar. For males, the rates remained above England average from 2001-03 to 2015-17 and then were statistically similar to England average for 2016-18 and 2017-19, followed by being above again (statistically significant) for the remaining time periods. Data for England suggests minimal improvement in the premature death rates from preventable causes for females and for Bury there is an overall increase in rates over time
Figure 8: Age standardised under 75 mortality rates for males and females (3 years range expressed per 100,000 population) for Bury from the period 2001-2003 to 2021-2023 (Mortality Profile, 2023)

Data by deprivation levels for under 75 mortality rates from causes considered preventable are not available at Bury level. However, data for England shows increasing rates of premature mortality from causes considered preventable as the levels of deprivation increase. The mortality rate is more than twice as high (240.9 per 100,000 population) in the most deprived areas of England compared to the least deprived areas (117 per 100,000 population) for 2021-23 (Mortality Profile, 2023).
Leading causes of death
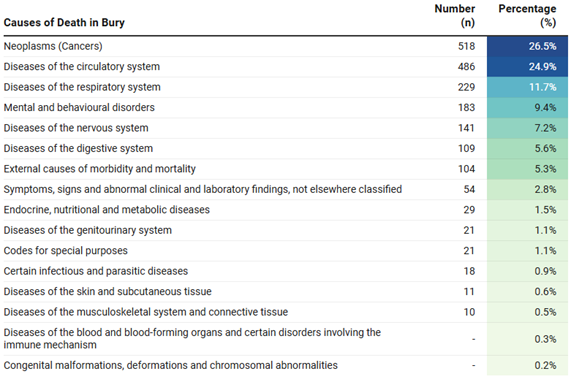
There were 1,953 deaths in Bury in the year 2023. The three leading causes of mortality across all ages in Bury for the year 2023 are cancers, circulatory diseases and respiratory diseases. In 2023, Cancer was the main cause of death accounting for 26.5% of the total deaths. Circulatory system disorders like heart disease and stroke were the second most common cause of death, accounting for 24.9% of the total deaths. Diseases of the respiratory system accounted for 11.7% of deaths in Bury, leaving this the third most common cause of death. Table 1 below presents the number and percentage of deaths in 2023 by causes based on ICD-10 classification (ONS, 2023). Some causes of deaths were supressed due to small numbers.
Table 1: Number and percentage of deaths in 2023 by causes based on ICD-10 classification in Bury (ONS, 2023)
Leading causes of death by Sex
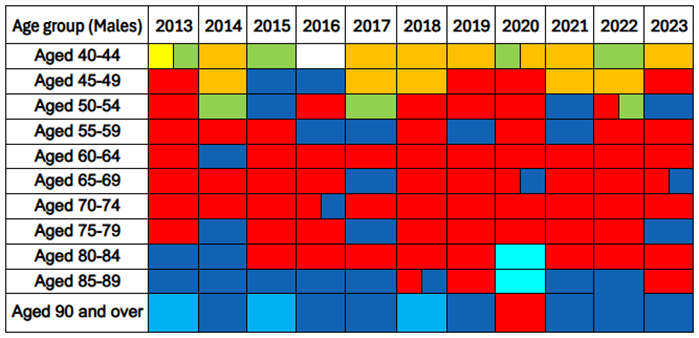
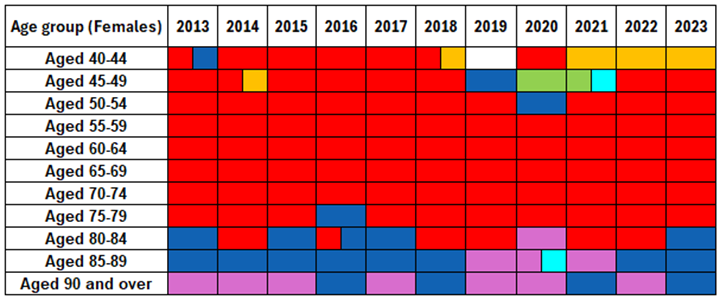
Figure 9 below presents the leading cause of mortality for males aged 40 years and over in Bury for each year from 2013 to 2023 (ONS, 2023). There are several trends that can be observed from the data below. Neoplasms are the most common cause of death for men aged between 50 and 85 years, followed by circulatory diseases (primarily Ischaemic heart diseases). The most common cancers across these age groups contributing to mortality are lung and bowel cancers. Circulatory diseases, specifically ischaemic heart diseases, are the primary cause of death for most years in males aged 85 to 89 and 90 years and over
External causes of morbidity and mortality (such as accidents and intentional injuries) are the leading cause of mortality for males aged 40-44 and 45-49 across most of the years. Please note, due to small numbers in younger age group specific causes of mortality cannot be presented in detail. COVID-19 emerged as a leading cause of mortality for males aged 80-89 years in the year 2020. This highlights the impact of the COVID-19 pandemic on mortality rates in vulnerable population groups.
Figure 9: Leading cause of mortality for males aged 40 years and over by five-year age bands in Bury from the year 2013 to 2023 (ONS, 2023)
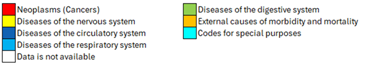
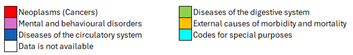
Examining the data for females in Bury (Figure 10), cancers are the leading cause of mortality for females aged 45–80 years. The most common cancers across these age groups are lungs, bowel and breast cancers. External causes of morbidity and mortality were the leading cause of death for females aged 40-44 from 2021-2023.
Diseases of the circulatory system are a significant cause of mortality in females aged 80 and over in Bury.
Figure 10: Leading cause of mortality for females aged 40 years and over by five-year age bands in Bury from the year 2013 to 2023 (ONS, 2023)
Mortality - Behavioural risk factors
In this section, we will present publicly available data on mortality rates from smoking and alcohol.
Alcohol:
Alcohol use is a significant public health issue in England and is closely related to mortality rates. Excessive alcohol use can result in a variety of health issues, such as liver disease, cancer, and heart disease, all of which can lead to premature deaths. Alcohol and mortality have a complex relationship that is largely influenced by the amount and frequency of alcohol consumption, a person's age and health status, and the presence of additional risk factors like smoking and obesity (OHID, 2023). Studies have shown that even moderate alcohol use can increase the risk of developing certain diseases like liver disease and some types of cancer including liver, bowel and breast cancers. However, higher consumption levels significantly increase the risk, especially for heavy drinkers (Oxford Population Health, 2022).
Alcohol misuse is estimated to cost the NHS about £3.5 billion per year and the impact on the society is even higher at £21 billion annually (Home office, 2012). The government has set out the alcohol strategy to reducing the harmful use of alcohol and the data presented below will support the strategy by presenting data to promote measurable, evidence-based prevention activities at a local level.
· Alcohol-related mortality
Alcohol related mortality is defined as deaths from conditions which are wholly or partially caused by alcohol (OHID, 2022). Data from 2023 suggests that deaths from alcohol-related conditions (n=78), all ages, directly age-standardised rate per 100,000 population in Bury (41.7 per 100,000 population) are similar to England average (40.7 per 100,000 population). Figure 11 below shows the trend in alcohol-related mortality for Bury and England from 2016-2023 (Alcohol Profiles, 2023). Trend data for Bury suggests that alcohol related mortality decreased from 43.9 in 2016 to 35.3 in 2018. This was followed by a steady rise to 50.7 in 2022 and a sharp decline to its current rate of 41.7 in 2023. Recent trend data shows no significant changed based on the 5 most recent data points. Data from England suggests a steady rise from 36.3 in 2016 to 40.7 in 2023.
Figure 11: Deaths from alcohol-related conditions, all ages, directly age-standardised rate per 100,000 population from 2016 to 2022 for Bury and England (Mortality Profile, 2023).
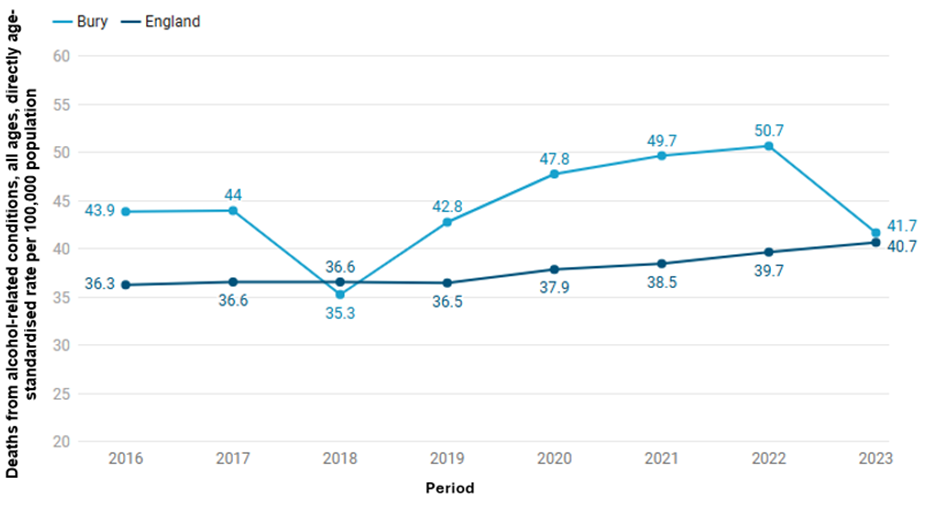
Data on inequalities in the alcohol-related mortality rates in Bury are only available by sex, where alcohol-related mortality is more than thrice as high in males for 2023 (67.6 per 100,000) compared with females (19.4 per 100,000) in Bury. Similar to Bury, alcohol related mortality for males in England for the year 2023 (62.1 per 100,000) are three times as that of females (22.1 per 100,000). Data by deprivation are available for England only and shows a deprivation gradient where individuals in the most deprived decile (52.8 per 100,000) have almost twice as high rates compared with the least deprived decile (31per 100,000).
· Alcohol-specific mortality
Alcohol-specific mortality is defined as deaths from conditions wholly caused by alcohol. This definition is also used by the Office of National Statistics in their annual UK data release. Alcohol-specific mortality for Bury in 2023 (15.5 per 100,000 population) is statistically similar to the England figure (15 per 100,000) during the same time period (Alcohol Profile 2023). Examining trends for Bury, alcohol-specific mortality rates have fluctuated over the years (Figure 11), varying from being statistically similar to and significantly worse than the England average. The alcohol-specific mortality rate reached its’ peak in Bury in 2022 when it was 23.9 per 100,000, followed by a significant decrease the following year to 15.5 (Figure 12). Trend in Bury shows no significant change based on the 5 most recent data points. For England, mortality rates remained relatively stable, with slight fluctuations from 10.7 in 2006 to 10.8 in 2019. This was followed by a steady increase from 13 per 100,000 in 2020 to the current rate of 15 per 100,000 in 2023.
Figure 12: Directly-standardised Alcohol-specific mortality rates from 2006 to 2023 for Bury and England (Mortality Profile, 2023).
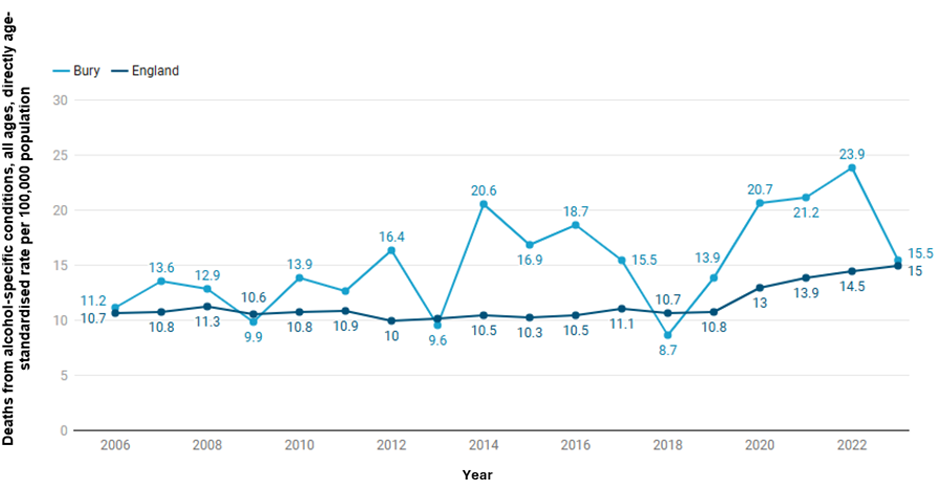
Data on inequalities in the alcohol-specific mortality rates are unavailable in Bury but at England level for 2023, alcohol-specific mortality is twice as high in males (20.6 per 100,000) compared with females (9.7 per 100,000). Data by deprivation are also available for England only and shows a deprivation gradient where individuals in the most deprived decile (20.9 per 100,000) have over twice as high mortality rates compared with the least deprived decile (9.8 per 100,000).
Smoking
Smoking is a major cause of preventable illnesses and premature deaths in the UK. Smoking can lead to a wide range of disease including lung cancer, chronic obstructive pulmonary disease (COPD), heart disease, stroke, and many other serious health conditions. In addition to impact on an individual, smoking has significant economic implications. For the year 2025, the annual cost of productivity losses from smoking-related illnesses, social care, fire, and health care was estimated to be £138 million, while the cost of premature deaths was estimated at £108 million (ASH, 2025).
Smoking has a significant impact on the inequalities as smoking rates in the UK are higher in deprived population groups, who are already more likely to experience poor health outcomes.
· Smoking attributable mortality
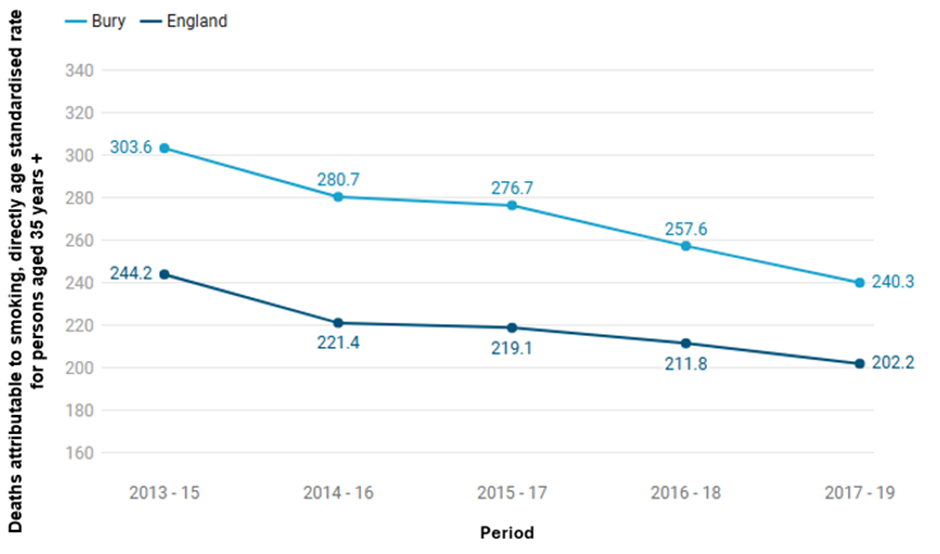
Smoking attributable mortality is defined as the number of deaths in a population that are caused by smoking and presented as directly age standardised rate for persons aged 35 years and over. Smoking attributable mortality rate for Bury in 2017-19 is 240.3 per 100,000 population, higher than the England average of 202.2 per 100,000 during the same time period. The overall trend suggests a decline in smoking attributable mortality rates for both Bury and England, however the rates in Bury have remained higher than the average for England between the period 2013-15 to 2017-19.
Smoking attributable mortality rate in Bury has declined from 303.6 per 100,000 in 2013-15 to 240.3 per 100,000 population in 2017-19. Similar decline was seen in England, where the rates declined from 244.2 per 100,000 in 2013-15 to 202.2 per 100,000 in 2017-19 (Figure 13).
Figure 13: Directly age-standardised smoking attributable mortality rates for Bury and England from 2013-15 to 2017-19 (Local tobacco control profiles, 2022).
There is a lack of local data on inequalities in Smoking attributable mortality rates, with data available only by deprivation at England level. The data on deprivation levels for 2017-19 shows that individuals in the most deprived decile (302.9 per 100,000) have more than twice as high mortality rates compared with the least deprived decile (142.7 per 100,000).
Mortality – Specific conditions
In this section, we will present publicly available data on mortality rates from cancer, cardiovascular, respiratory, and liver diseases.
Cancer
In the UK, 367,000 people are diagnosed with cancer annually. Around 40% of those cancers are caused by behavioural risk factors including smoking and alcohol and overweight and obesity (CRUK, 2020). Annual NHS costs for cancer services are £5 billion, but the cost to society as a whole – including costs for loss of productivity – is £18.3 billion (HM Government, 2015).
Premature or under 75 years of age mortality from cancer (Persons) in Bury for 2023 (142.6 per 100,000 population in those aged under 75 years) is statistically higher than England average (120.8 per 100,000). Amongst Bury’s statistical neighbours, Bury has the highest premature mortality rate from cancer, with the lowest rate in Bracknell Forest (102.5 per 100,000).
Data on inequalities are only available by sex for Bury with higher premature mortality from cancer being seen in 2023 in males (152 per 100,000) compared with females (133.7 per 100,000). Data on deprivation are only available at England level, where a social gradient is observed with higher mortality (146.5 per 100,000) in decile 1 compared with decile 10 (102.4 per 100,000) for 2023.
The directly standardised mortality rate from all cancers, all ages in Bury is 270.8 per 100,000 population for the year 2023, higher (statistically significant) than the England average of 246.7 per 100,000. (Mortality Profile, 2023). Bury has the third highest rate for cancer mortality for all ages in its group of 16 statistical neighbours, with the lowest rate in Sutton of 213.1 per 100,000 (Figure 14).
Figure 14: Directly standardised mortality rate from all cancers, all ages for Bury and its statistical neighbours per 100,000 population (Mortality Profile, 2023)
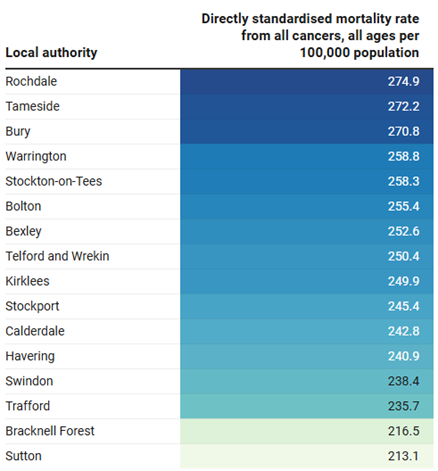
Data on inequalities in mortality rate from all cancers, all ages in Bury are only available by sex, where cancer mortality in males in 2023 is higher (333.9 per 100,000) compared with females (226.3 per 100,000). Mortality rates for males are similar to the England average of 296.6 per 100,000, and Bury is the second highest amongst its’ statistical neighbours for 2023. Bury is also similar for mortality rate for all cancers for females to the England average of 209.4 per 100,000, and is third highest amongst Bury group of similar local authorities. Data by deprivation are available for England only and shows a deprivation gradient where individuals in the most deprived decile (247.1 per 100,000) have higher cancer mortality rates compared with the least deprived decile (186 per 100,000) (Mortality Profile, 2023).
· Lung Cancer
The mortality rate from lung cancer, all ages (Persons) per 100,000 population for 2021-23 in Bury (60.7 per 100,000) is statistically higher than England average (47.5 per 100,000). Bury has the fourth highest mortality from lung cancer in its group of 16 statistical neighbours, with the lowest mortality in Havering of 40.5 per 100,000 (Figure 15).
Figure 15: Directly standardised mortality rate from lung cancer, all ages per 100,000 population 2021-23 (Mortality Profile, 2023)
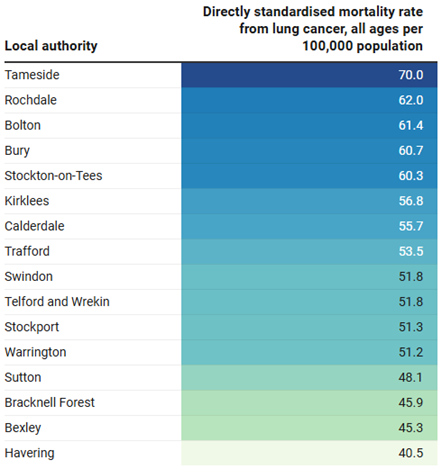
Data on inequalities in mortality rates from lung cancer for all ages in Bury are only available by sex. For the period 2021-23, cancer mortality in females (59.4 per 100,000) is slightly lower compared to males (63.9 per 100,000) in Bury. Compared with England, the mortality rate for males in Bury is statistically similar to the England average (54.7 per 100,000) and is the fifth highest amongst Bury’s statistical neighbours. In contrast, the rate for females in Bury is higher (statistically significant) than the England average for females (41.9 per 100,000) and is second highest amongst its group of similar local authorities.
Data by deprivation are available for England only and for 2021-23 it shows a steep deprivation gradient where individuals in the most deprived decile (69.3 per 100,000) have nearly two times higher cancer mortality rates compared with the least deprived decile (35.6 per 100,000).
· Breast Cancer
Directly standardised mortality rate from breast cancer for females of all ages in Bury, for the period 2021-23, is 31.9 per 100,000 population. This rate is statistically similar to the England average of 30.5 per 100,000. Bury has the sixth highest mortality from breast cancer in females in its group of statistical neighbours, with the lowest mortality in Tameside of 24.2 per 100,000 (Figure 16).
Figure 16: Directly standardised mortality rate from breast cancer, per 100,000 population, for females of all ages for Bury and its statistical neighbours 2021-23 (Mortality Profile, 2023)
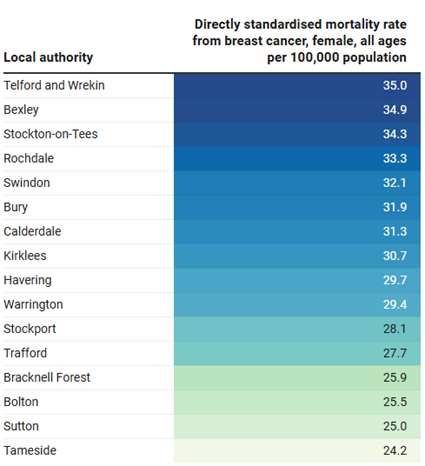
Data on inequalities in mortality rates from breast cancer for females of all ages in Bury are not present. Data by deprivation are available for England only, and they show a slight deprivation gradient. The mortality rate from breast cancer in the most deprived decile (31.5 per 100,000) is slightly higher compared to the mortality rate in the least deprived decile (28.8 per 100,000) for the period 2021-23.
· Colorectal Cancer
Directly standardised mortality rate from colorectal cancer, per 100,000 population, for all ages (persons) in Bury of 27 per 100,000 for 2021-23 is statistically similar to England average of 25.6 per 100,000. Comparing Bury to its statistical neighbours, Bury has the sixth highest mortality rate, with the lowest mortality rate in Sutton of 21 per 100,000 (Figure 17).
Figure 17: Directly standardised mortality rate from colorectal cancer, per 100,000 population, for all ages (persons) for Bury and its statistical neighbours, 2021-23 (Mortality Profile, 2023)
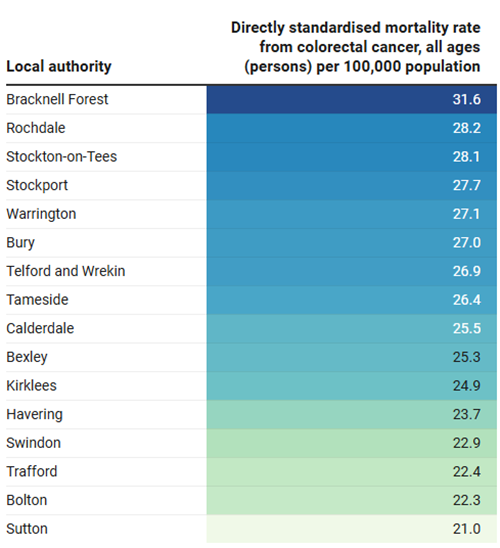
Data on inequalities in mortality rates from colorectal cancer, all ages in Bury are only available by sex. Cancer mortality in males for the period 2021-23 is higher (32.1 per 100,000) compared with females (22.5 per 100,000). Compared with England, mortality rates for males and females in Bury are similar to England average of 31.4 per 100,000 for males and 20.9 per 100,000 for females. Data by deprivation are available for England only and shows a slight deprivation gradient for 2021-23, where individuals in the most deprived decile (27.7 per 100,000) have higher colorectal cancer mortality rates compared with the least deprived decile (24.3 per 100,000).
Cardiovascular diseases (CVD)
Cardiovascular disease (CVD) is a group of disorders that affect the heart and blood vessels, including coronary heart disease (CHD), stroke, heart failure, many causes of dementia and peripheral arterial disease. CVD is a major cause of death and disability in England. It affects 6 million people and accounts for a quarter of deaths in England. Annual healthcare costs in England relating to CVD are estimated at £7.4 billion, with an annual cost to the wider economy of £15.8 billion (HM Government, 2019).
Premature mortality rate from cardiovascular disease (CVD) i.e for individuals under 75 years of age in Bury is 98.1 per 100,000 population in 2023. This rate is higher (statistically significant) than the England average of 77.4 per 100,000. Trend data suggests that the mortality rate in Bury is increasing and getting worse.
Data on inequalities are only available by sex for Bury nearly three times higher premature mortality from CVD in males (147.4 per 100,000) compared with females (51.1 per 100,000) for the year 2023. Data on deprivation are only available at England level, where a social gradient is observed with higher mortality (110.4 per 100,000) in the most deprived decile (decile 1) compared with the least deprived decile (56.7 per 100,000).
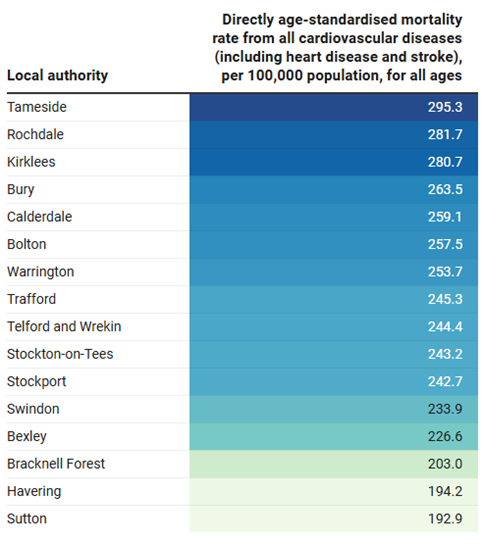
Directly standardised mortality rate from all cardiovascular diseases (including heart disease and stroke) for all ages in Bury in 2023 is 263.5 per 100,000 population. This rate is statistically higher than the England average of 232.4 per 100,000. Amongst its group of similar statistical neighbours, Bury has the fourth highest CVD mortality rate for the year 2023, with the lowest CVD mortality rate in Sutton (192.9 per 100,000) and highest in Tameside (295.3 per 100,000) (Figure 18).
Figure 18: Directly standardised mortality rate from all cardiovascular diseases (including heart disease and stroke), per 100,000 population, for all ages for Bury and its statistical neighbours, 2023 (Mortality Profile, 2023)
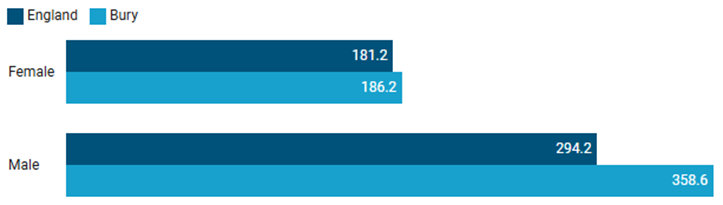
Data by inequalities are limited for Bury and are only available by sex for the year 2023. Mortality rate for CVD for males in Bury (358.6 per 100,000) is nearly twice that of females (186.2 per 100,000). Compared to England, CVD mortality rate for males in Bury is statistically higher than England average in males of 294.2 per 100,000, whereas it is similar to the England average of 181.2 per 100,000 for females (Figure 19).
Figure 19: Comparison of directly standardised mortality rate from all cardiovascular diseases (including heart disease and stroke), per 100,000 population, for all ages by sex in Bury with England 2023 (Mortality Profile, 2023)
There are no publicly available data by deprivation for Bury. Data by levels of deprivation in England suggests a social gradient where individuals in the most deprived quintile have higher CVD mortality rates (284 per 100,000) compared with the least deprived quintile (191.9 per 100,000).
· Stroke
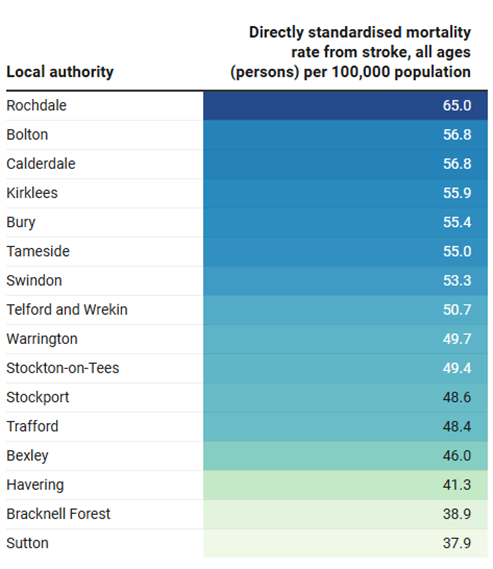
The mortality rate from stroke for all ages in Bury for the period 2021-23 is 55.4 per 100,000 population. This rate is statistically similar to the England average of 49.3 per 100,000. Bury has the fifth highest mortality rate from stroke among its group of statistical neighbours, with the highest rate in Rochdale (65 per 100,000) and the lowest rate in Sutton (37.9 per 100,000) (Figure 20).
Figure 20: Directly standardised mortality rate from stroke per 100,000 population, for all ages (persons) for Bury and its statistical neighbours 2021-23 (Mortality Profile, 2023)
Data on inequalities in mortality rates from stroke for all ages in Bury are only available by sex. For the period 2021-23, the mortality rate from stroke in males (64.6 per 100,000) is higher compared to females (47 per 100,000). Bury has the third highest stroke mortality in men amongst its group of similar local authorities. Compared with England, mortality rates for males are significantly higher than England average of 52.1 per 100,000 and similar to the England average of 46.6 per 100,000 for females. Data by deprivation are available for England only and shows a slight deprivation gradient where individuals in the most deprived decile (57.6 per 100,000) have higher stroke mortality rates compared with the least deprived decile (41.5 per 100,000) for 2021-23.
· Dementia and Alzheimer’s disease
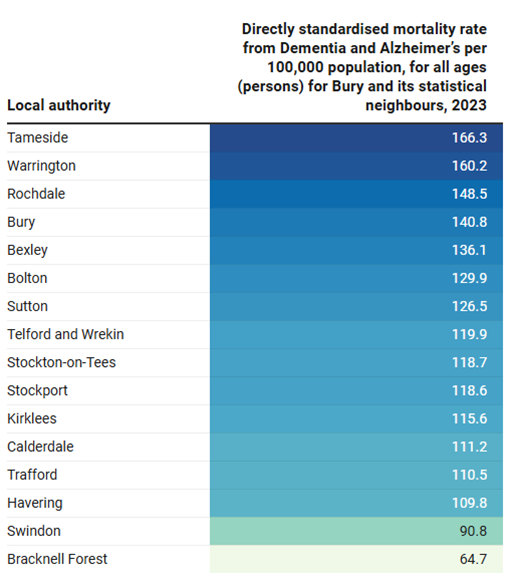
Mortality rate from Dementia and Alzheimer’s, all ages (Persons) per 100,000 population for the year 2023 in Bury (140.8 per 100,000) is significantly higher than the England average (111.7 per 100,000). Bury has the fourth highest mortality from Dementia and Alzheimer’s disease in its group of statistical neighbours, with the highest mortality in Tameside of 166.3 per 100,000 and lowest mortality in Bracknell Forest of 64.7 per 100,000 (Figure 21). However, it is worth noting that Bury performs relatively well in diagnosing dementia, and this may contribute to its relatively high rate of dementia deaths.
Figure 21: Directly standardised mortality rate from Dementia and Alzheimer’s per 100,000 population, for all ages (persons) for Bury and its statistical neighbours 2023 (Mortality Profile, 2023)
Data on inequalities in mortality rates from Dementia and Alzheimer’s, all ages in Bury are only available by sex, where Dementia and Alzheimer’s mortality in females in 2023 is significantly higher (149.8 per 100,000) compared with males (122.4 per 100,000). Mortality rates from dementia and Alzheimer’s for males in Bury are similar to England average of 100.6 per 100,000 and the fifth highest when compared to Bury’s group of statistical neighbours. Mortality rates in females are significantly higher than the average of England (117.9 per 100,000). Amongst Bury’s group of similar local authorities, dementia and Alzhiemer’s mortality is the fourth highest in Bury. Data by deprivation are available for England only and shows a slight deprivation gradient where individuals in the most deprived decile (129 per 100,000) have higher Dementia and Alzheimer’s mortality rates compared with the least deprived decile (106.2 per 100,000) for 2023.
Liver disease
Liver disease is one of the leading causes of mortality in England with individuals dying early from the disease. The majority of liver diseases are preventable from public health interventions focused on reducing alcohol consumption and obesity (OHID, 2023). Around 62,000 years of working life are lost to liver disease every year and its impact on the poorest in our society is disproportionally severe, contributing to the widening of socioeconomic health inequalities in the UK (Liver research, 2017).
Under 75 years of age mortality rate from liver disease (Persons) in Bury for 2023 is 30.3 per 100,000 population, significantly higher than the England average of 21.9 per 100,000. Data in inequalities are only available by sex for Bury with significantly higher premature mortality from liver disease in males (38.3 per 100,000) compared with females (22.4 per 100,000). Data on deprivation is only available at England level, where a social gradient is observed with higher mortality (30.3 per 100,000) in the most deprived decile (decile 1) compared with decile 10 (16.3 per 100,000).
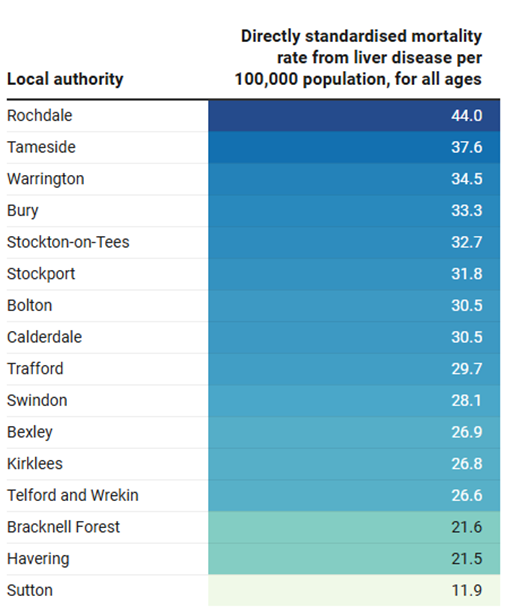
Directly standardised mortality rate from liver diseases per 100,000 population, for all ages (persons) in the year 2023 for Bury (33.3 per 100,000) is similar to England average (27.7 per 100,000). Amongst its group of similar statistical neighbours, Bury has the fourth highest mortality rate from liver diseases for the year 2023, with the lowest liver disease mortality rate in Sutton (11.9 per 100,000) and highest in Rochdale (44 per 100,000) (Figure 22).
Figure 22: Directly standardised mortality rate from liver disease per 100,000 population, for all ages (persons) for Bury and its statistical neighbours 2023 (Mortality Profile 2023)
Data by inequalities are limited for Bury and are only available by sex, where males in Bury have nearly twice (44 per 100,000) the mortality rate for liver disease compared with females (23.9 per 100,000) for 2023. Compared to England, mortality rate for liver disease for males in Bury is statistically similar to England average for males of 36 per 100,000, and for females it is similar to the England average for females of 20.1 per 100,000. There are no publicly available data by deprivation for Bury. Data by levels of deprivation in England suggests a social gradient where individuals in the most deprived quintile have higher liver disease mortality rates (36.6 per 100,000) compared with the least deprived quintile (21.1 per 100,000) (Mortality Profile, 2023).
Respiratory disease
Respiratory disease is one of the top leading causes of premature mortality in England and smoking is the major cause of chronic obstructive pulmonary disease (COPD), one of the major respiratory diseases. Around 55% of these respiratory deaths are considered potentially preventable (OHID, 2023).
Under 75 years of age mortality from respiratory disease (Persons) in Bury is 35 per 100,000 population, similar to the England average of 33.7 per 100,000.
Data on inequalities are only available by sex for Bury with higher premature mortality from respiratory disease in males (40.9 per 100,000) compared with females (29.6 per 100,000) for 2023. Data on deprivation is only available at England level, which shows a sharp deprivation gradient with higher premature mortality in the most deprived decile (decile 1) of 57.5 per 100,000 compared with 21.9 per 100,000 in the least deprived decile (decile 10) for 2023.
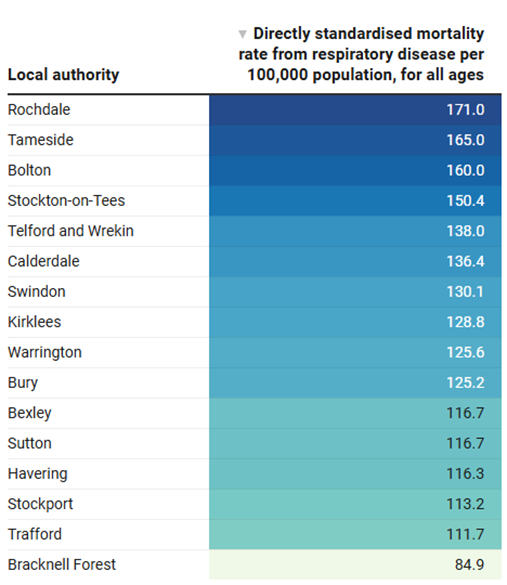
Mortality rate from respiratory disease, all ages (Persons) per 100,000 population for the year 2023 in Bury (125.2 per 100,000) is similar to the England average of 117.8. Bury has the tenth highest mortality from respiratory disease in its group of statistical neighbours, with the highest mortality in Rochdale of 171 per 100,000 and lowest mortality in Bracknell Forest of 84.9 per 100,000 (Figure 23).
Figure 23: Directly standardised mortality rate from respiratory disease per 100,000 population, for all ages (persons) for Bury and its statistical neighbours 2023 (Mortality Profile, 2023)
Data on inequalities in mortality rate from respiratory disease, all ages in Bury are only available by sex/. In 2023, the mortality rate from respiratory disease in males is higher (160.6 per 100,000) compared to females (102.8 per 100,000). Mortality rate from respiratory disease for males in Bury is similar to the England average of 141.9 per 100,000 for 2023. The mortality rate for males in Bury is similar to the England average of 141.9 per 100,000, while the rate for females in Bury is also similar to the England average of 100.6 per 100,000. Data by deprivation are available for England only and shows inequalities by levels of deprivation, where individuals in the most deprived decile (169.3 per 100,000) have higher respiratory disease mortality rates compared with the least deprived decile (94.6 per 100,000) for 2023.