Ethnicity
Health outcomes differ by ethnicity, with patterns of mortality and disease being more complex when analysed by ethnicity than by deprivation.National data from the Office for National Statistics (ONS) suggests that before the COVID-19 pandemic, people of White and mixed ethnic backgrounds had lower life expectancy than other ethnic groups (King’s Fund, 2021). Part of the reason for this was the so-called ‘healthy migrant effect’: recent migrants tend to be healthier than average for the countries they move to, as ill people are less likely to migrate. When the COVID-19 pandemic occurred, it had a greater impact on many ethnic minority communities, driving overall death rates higher in Bangladeshi and Pakistani men and women, and Black Caribbean men, while equalising death rates among other ethnic groups (Public Health England, 2020). This is likely due to a combination of factors, such as greater employment in work that could not be done from home and with limited sick-pay entitlements, higher levels of overcrowded housing, and of long-term illnesses.
Variations in health by ethnicity are closely linked with those by deprivation, as well as a complex interplay of social, economic, cultural, and environmental factors. For instance, ethnic minority groups are more likely to live in deprived areas, experience discrimination, face language barriers, and encounter cultural differences in healthcare services, which may impact their access to healthcare and health outcomes.
This section presents a detailed breakdown of the ethnicity in Bury, covering broad and detailed ethnic categories, as well as geographical distribution. It includes a comparison of the ethnicity data from the Census 2021 and Census 2011, highlighting the changes that have emerged over the 10-year period between Census 2011 to 2021.
Ethnicity breakdown by Broad Ethnic Categories in Bury:
According to the 2021 census results, the majority of Bury's resident population (160,716 individuals, representing 82.9%) identified their ethnic group within the high-level “White” category, which is 1.9% higher than the national figure of 81% for England. Notably, this figure represents a significant decrease of 6.3% from the previous census conducted in 2011, when 89.2% of Bury's usual residents identified as "White." This reduction is consistent with the nationwide trend, which saw the proportion of the population identifying as "White" decrease from 85.4% in 2011 to 81% in 2021.
There have been significant changes to other ethnic groups in Bury. High-level “Asian” category constitutes the second largest ethnic group in Bury for both Census 2021 and Census 2011. “Asian” ethnic category saw the highest increase from 7.2% in 2011 to 10.6% in 2021. This change was slightly higher than England, where residents identifying within the high-level Asian category increased from 7.8% in 2011 to 9.7% in 2021 (Table 1).
Table 1: Percentage of population by Broad ethnic categories in Bury and England for Census 2011 and 2021
| Broad Ethnic Categories | Bury | Bury | England | England |
| 2011 | 2021 | 2011 | 2021 | |
| White groups | 89.2% | 82.9% | 85.4% | 81.0% |
| Mixed | 1.8% | 2.6% | 2.3% | 2.9% |
| Asian | 7.2% | 10.6% | 7.8% | 9.7% |
| Black | 1.0% | 1.9% | 3.5% | 4.2% |
| Others | 0.7% | 1.9% | 1% | 2.2% |
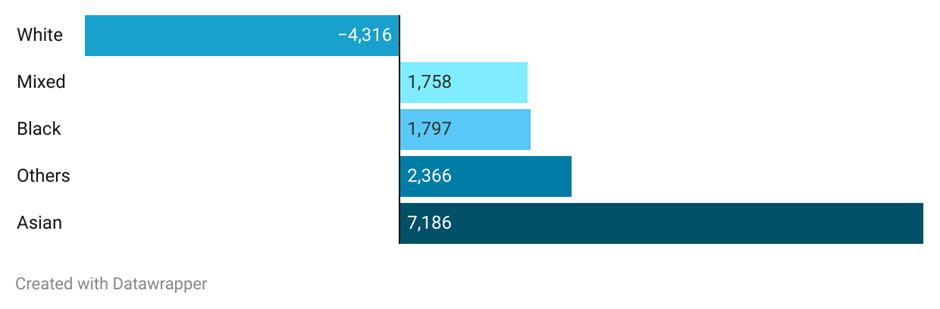
Examining the change in numbers for broad ethnic categories (see Figure 1 below), Asian population in Bury has seen the biggest increase, growing by 7,186 residents over the ten-year period between Census 2011 and 2021 (53.6% increase). On the other hand, there are 4,316 fewer residents identifying as White (2.36% decrease).
Figure 1: Change in broad ethnic categories (n) between Census 2011 and Census 2021
Ethnicity breakdown by Detailed Ethnic Categories in Bury:
Looking across detailed ethnic categories in Bury, 78.2% of the total population in 2021 identified as "English, Welsh, Scottish, Northern Irish or British," indicating a decrease from 85.3% in 2011. This figure is relatively higher than the corresponding national figures, as only 73.5% of the total population in England identified their ethnic group as "White: English, Welsh, Scottish, Northern Irish or British" in 2021, compared with 79.8% in 2011.
Asian, Asian British, or Asian Welsh: Pakistani ethnic category in Bury has risen from 4.9% in 2011 to 7.8% in 2021, making it the second-highest detailed ethnic category in Bury. This number exceeds the corresponding percentage in England, where 2.8% of the population in 2021 (up from 2.1% in 2011), identified as Asian, Asian British, or Asian Welsh: Pakistani. It is noteworthy that Bury differs from England's second-highest detailed ethnic category, "White: Other White," which saw a population increase from 4.6% in 2011 to 6.3% in 2021 (Table 2)
Table 2: Percentage (%) of population by detailed ethnic categories in Bury and England for Census 2011 and 2022.
| Detailed Ethnic Categories | Bury | Bury | England | England |
| 2011 | 2021 | 2011 | 2021 | |
| White: English, Welsh, Scottish, Northern Irish or British | 85.3% | 78.2% | 79.8% | 73.5% |
| White: Gypsy or Irish Traveller | 0.0% | 0.1% | 0.1% | 0.1% |
| White: Irish | 1.3% | 1.1% | 1.0% | 0.9% |
| White: Other White | 2.5% | 3.5% | 4.6% | 6.3% |
| White: Roma | 0.1% | 0.2% | ||
| Mixed or Multiple ethnic groups: Other Mixed or Multiple ethnic groups | 0.3% | 0.6% | 0.5% | 0.8% |
| Mixed or Multiple ethnic groups: White and Asian | 0.5% | 0.9% | 0.6% | 0.8% |
| Mixed or Multiple ethnic groups: White and Black African | 0.2% | 0.4% | 0.3% | 0.4% |
| Mixed or Multiple ethnic groups: White and Black Caribbean | 0.7% | 0.8% | 0.8% | 0.9% |
| Black, Black British, Black Welsh, Caribbean or African: African | 0.6% | 1.3% | 1.8% | 2.6% |
| Black, Black British, Black Welsh, Caribbean or African: Caribbean | 0.3% | 0.4% | 1.1% | 1.1% |
| Black, Black British, Black Welsh, Caribbean or African: Other Black | 0.1% | 0.2% | 0.5% | 0.5% |
| Asian, Asian British or Asian Welsh: Bangladeshi | 0.2% | 0.2% | 0.8% | 1.1% |
| Asian, Asian British or Asian Welsh: Chinese | 0.6% | 0.5% | 0.7% | 0.8% |
| Asian, Asian British or Asian Welsh: Indian | 0.7% | 1.0% | 2.6% | 3.3% |
| Asian, Asian British or Asian Welsh: Other Asian | 0.9% | 1.1% | 1.5% | 1.7% |
| Asian, Asian British or Asian Welsh: Pakistani | 4.9% | 7.8% | 2.1% | 2.8% |
| Other ethnic group: Any other ethnic group | 0.5% | 1.6% | 0.6% | 1.6% |
| Other ethnic group: Arab | 0.3% | 0.4% | 0.4% | 0.6% |
Ethnicity Breakdown by Geography in Bury
Below we will examine ethnic breakdown by ward and Middle Super Output Areas (MSOAs) for broad ethnic categories.
Ethnicity by Wards:
There are significant variations in the data across the 17 wards in Bury when examined by broad ethnic categories (Table 3).
Table 3: Percentage (%) of population by Broad ethnic categories across 17 wards in Bury
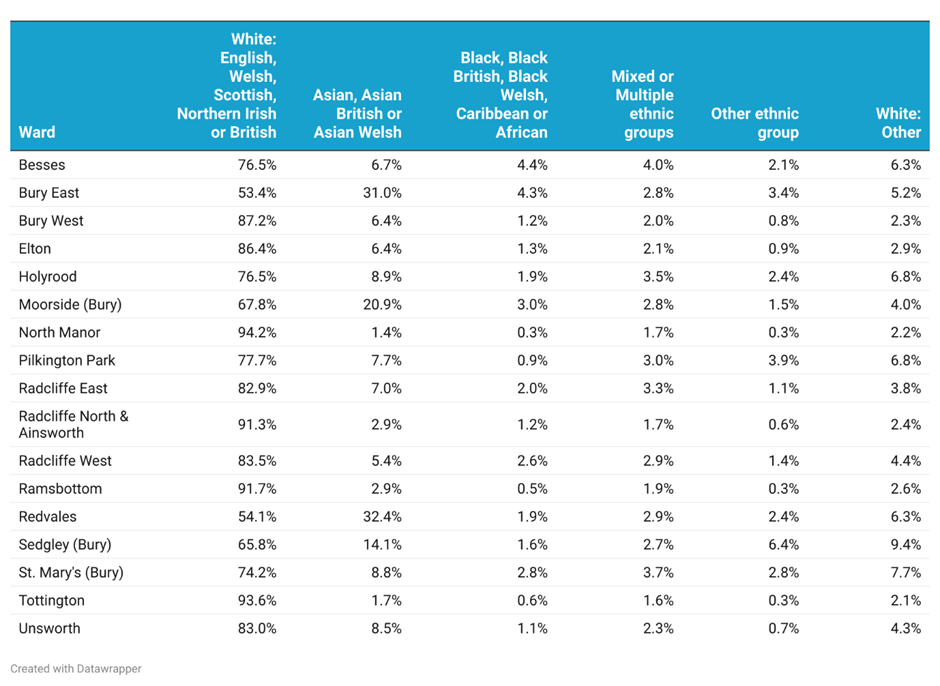
The wards with the highest proportion of residents reporting their ethnicity as “White: English, Welsh, Scottish, Northern Irish or British” are North Manor (94.2%), Tottingham (93.6%) and Ramsbottom (91.7%). Whereas the wards with the highest proportion of residents reporting their ethnicity as “Asian, Asian British or Asian Welsh” are Redvales (32.4%), Bury East (31%) and Moorside (20.9%).
Ethnicity by MSOAs:
There are wide variations when examining data by Broad ethnic categories across the 26 MSOAs in Bury (Table 4).
Table 4: Percentage (%) of population by Broad ethnic categories across 26 MSOAs in Bury
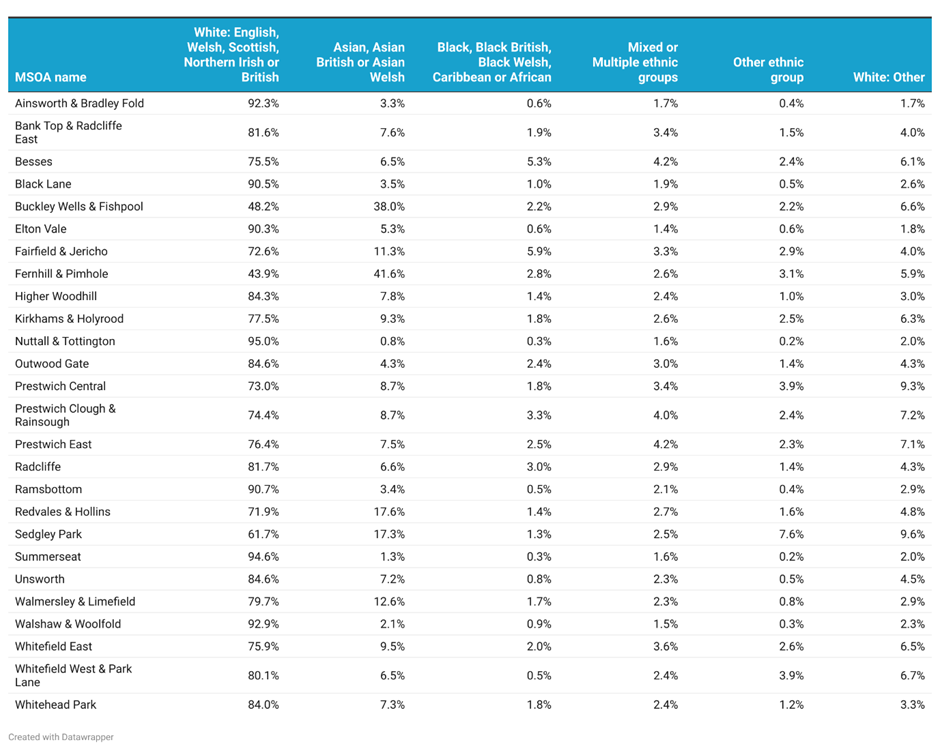
The MSOA’s with the highest proportion of residents reporting their ethnicity as “White: English, Welsh, Scottish, Northern Irish or British” are Nuttall & Tottington (95%), closely followed by Summerseat (94.6%) and Ainsworth & Bradley Fold (92.3%). The highest proportion of residents in Bury who identify their ethnicity as “Asian, Asian British or Asian Welsh” live in Fernhill and Pimhole (41.6%) and Buckley Wells & Fishpool (38%).
Ethnicity by Broad Age Groups in Bury:
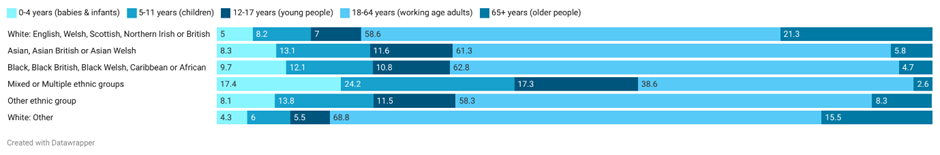
The non-white ethnic groups in Bury have a younger age structure compared to white ethnic groups (See Figure 2 below).
The highest proportion of babies and infants (0-4 years) are in the Mixed or Multiple ethnic groups (17.4%) and Asian, Asian British or Asian Welsh, and the lowest proportion are in the Other White (4.3%) and White English, Welsh, Scottish, Northern Irish or British (5%) ethnic groups.
Similarly, the highest proportion of children aged 5-11 years are in the Mixed or Multiple ethnic groups (24.2%), followed by Asian, Asian British or Asian Welsh (13.1%). The lowest proportion are in the Other White (4.3%) and White English, Welsh, Scottish, Northern Irish or British (5%) ethnic groups.
The Asian, Asian British, or Asian Welsh (11.6%) and Other (11.5%) ethnic groups have the highest proportion of young people (12-17 years). In contrast, the Other White (5.5%) and White English, Welsh, Scottish, Northern Irish, or British (7%) ethnic groups have the lowest proportion of individuals in this age range.
For working-aged adults (18-64 years), the highest proportions are found in the Other White (68.8%) and Black, Black British, Black Welsh, Caribbean, or African (62.8%) ethnic groups. The lowest proportions of working-aged adults are in the Mixed or Multiple ethnic groups (38.6%).
The highest proportion of older people (65+ years) are in the White English, Welsh, Scottish, Northern Irish, or British ethnic groups (21.3%) and Other White (15.5%) ethnic groups and the lowest proportion are in the Other (2.6%) and Black, Black British, Black Welsh, Caribbean, or African (4.7%) ethnic groups.
Figure 2: Ethnicity breakdown by Broad Age Groups in Bury