 with sex breakdown by broad age groups.")
This section presents a breakdown of Bury’s population by sex, including local perspectives at Middle Layer Super Output Areas (MSOA) levels. The sex breakdown is further categorised by broad age groups: babies and infants, children and young people, working-age adults, and older adults.
Bury has a slightly higher percentage of females, at 50.9% (98,748 residents), compared with 49.1% males (95,107 residents) according to the 2021 Census. This is similar to the North West region, where 50.9% of residents are female and 49.1% are male, and aligns with the national picture of England, where 51% of residents are female compared with 49% male (Census, 2021).
Figure 1: Number and percentage of male and female residents in Bury
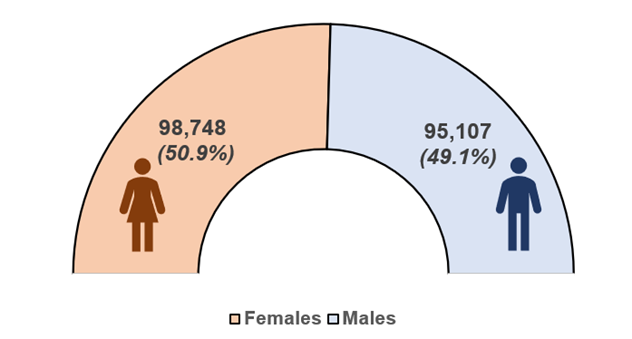
Figure 2 below presents the population statistics for Bury by Sex for each census year starting from Census 1991 to Census 2021.
Figure 2: Number of Male and Female residents in Bury for the census years 1991, 2001, 2011 and 2021
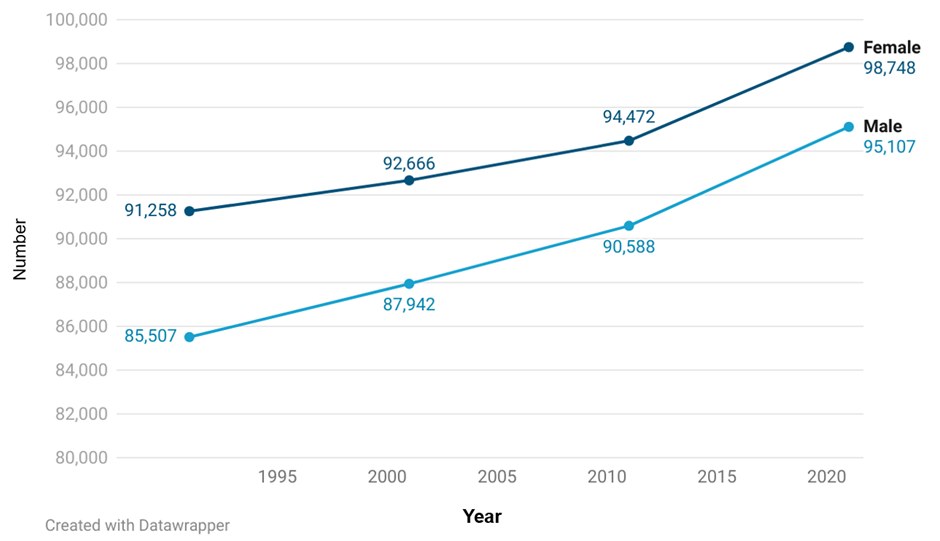
Through the census years from 1991 to 2021, Bury has consistently had a slightly higher number of females compared with males. However, the difference has gradually reduced with each census. The largest difference was in the 1991 census, where there were 5,751 more females than males. The smallest difference was in the 2021 census, with 3,641 more females than male
Geographical distribution
Only 3 of the16 MSOAs in Bury (Kirkhams & Holyrood, Fernhill & Pimhole and Prestwich Central) have higher percentages of males compared with females. (Census 2021). The most pronounced gaps by sex are found in Besses and Summerseat. In Besses, females constitute approximately 5.6% more of the population compared to males. Similarly, in Summerseat, the female population exceeds the male population by about 4.6%.
Table 1: Number and percentage of Male and Female residents by MSOAs in Bury
| MSOA Name | Male | Male | Female | Female | All persons | All persons |
| number | % | number | % | number | % | |
| Kirkhams & Holyrood | 3,245 | 50.7 | 3,159 | 49.3 | 6,404 | 100 |
| Fernhill & Pimhole | 5,724 | 50.4 | 5,626 | 49.6 | 11,350 | 100 |
| Prestwich Central | 3,298 | 50.3 | 3,262 | 49.7 | 6,560 | 100 |
| Radcliffe | 4,290 | 49.8 | 4,327 | 50.2 | 8,617 | 100 |
| Whitefield West & Park Lane | 3,593 | 49.8 | 3,622 | 50.2 | 7,215 | 100 |
| Sedgley Park | 4,760 | 49.8 | 4,805 | 50.2 | 9,565 | 100 |
| Buckley Wells & Fishpool | 3,863 | 49.7 | 3,914 | 50.3 | 7,777 | 100 |
| Ramsbottom | 4,470 | 49.4 | 4,570 | 50.6 | 9,040 | 100 |
| Whitehead Park | 3,588 | 49.3 | 3,694 | 50.7 | 7,282 | 100 |
| Nuttall & Tottington | 3,688 | 49.1 | 3,816 | 50.9 | 7,504 | 100 |
| Whitefield East | 2,788 | 49.1 | 2,891 | 50.9 | 5,679 | 100 |
| Redvales & Hollins | 3,369 | 49 | 3,508 | 51 | 6,877 | 100 |
| Bank Top & Radcliffe East | 3,027 | 49 | 3,156 | 51 | 6,183 | 100 |
| Unsworth | 3,534 | 49 | 3,684 | 51 | 7,218 | 100 |
| Higher Woodhill | 2,787 | 48.9 | 2,908 | 51.1 | 5,695 | 100 |
| Elton Vale | 3,580 | 48.8 | 3,753 | 51.2 | 7,333 | 100 |
| Walmersley & Limefield | 3,930 | 48.7 | 4,141 | 51.3 | 8,071 | 100 |
| Black Lane | 3,737 | 48.7 | 3,938 | 51.3 | 7,675 | 100 |
| Ainsworth & Bradley Fold | 3,002 | 48.6 | 3,178 | 51.4 | 6,180 | 100 |
| Prestwich East | 3,750 | 48.5 | 3,980 | 51.5 | 7,730 | 100 |
| Walshaw & Woolfold | 3,903 | 48.4 | 4,155 | 51.6 | 8,058 | 100 |
| Prestwich Clough & Rainsough | 2,754 | 48.4 | 2,932 | 51.6 | 5,686 | 100 |
| Fairfield & Jericho | 3,939 | 48.3 | 4,213 | 51.7 | 8,152 | 100 |
| Outwood Gate | 3,608 | 48.2 | 3,876 | 51.8 | 7,484 | 100 |
| Summerseat | 2,820 | 47.7 | 3,097 | 52.3 | 5,917 | 100 |
| Besses | 4,063 | 47.2 | 4,539 | 52.8 | 8,602 | 100 |
Broad age groups
Based on the results of Census 2021 for Bury, there are 1,476 more males under 18 years of age compared with females. Across broad age groups, a total of 5,775 male and 5,382 female are babies & infants (0-4 years of age). Similarly, there are more children (5-11 years of age) who are males (9,054) compared with females (8,634). Young people (12-17 years of age) also follow a similar pattern with more males (7,847) than females (7,184).
When looking at working age adults (18-64 years old) and older age adults (65+ years old), the pattern reverses. There are 1,863 more working age females compared with males (58,195 and 56,322 respectively) and 3,254 more older age adult females compared with males (19,353 and 16,009 respectively).
Table 2: Number and percentage of Male and Female residents by Broad age groups in Bury
| Age Groups | Male | Male | Female | Female | All | All |
| number | % | number | % | number | % | |
| 0-4 years (babies & infants) | 5775 | 51.8 | 5382 | 48.2 | 11157 | 100 |
| 5-11 years (children) | 9054 | 51.2 | 8634 | 48.8 | 17688 | 100 |
| 12-17 years (young people) | 7847 | 52.2 | 7184 | 47.8 | 15031 | 100 |
| 18-64 years (working age adults) | 56332 | 49.2 | 58195 | 50.8 | 114527 | 100 |
| 65+ years (older people) | 16099 | 45.4 | 19353 | 54.6 | 35452 | 100 |
| Total | 95107 | 49.1 | 98748 | 50.9 | 193855 | 100 |
The highest difference by sex is in the 65+ age group (older people), where there are 3,254 more females compared with males. On average, females currently live longer than males (see Life Expectancy), which significantly impact the sex profile of Bury’s population.