Sex
Sex
Sex
-
 Sex: A breakdown of Bury's population by sex including local perspectives at Middle Super Output Areas (MSOA) with sex breakdown by broad age groups.
This section presents a breakdown of Bury’s population by sex including local perspectives at Middle layer Super Output Areas (MSOA) levels with sex breakdown by broad age groups (babies and infants, children and young people, work age adults and older adults).
Bury has a slightly higher percentage of females at 50.9% (98,748 residents) compared with 49.1% of males (95,107 residents) (Census, 2021). This is similar to North West, where 50.9% of residents are females (compared with 49.1% males) and the national picture for England where 51% of the residents are females (compared with 50% males) (Census, 2021).
Table 1: Median age in each MSOA in Bury (Census 2021)
-
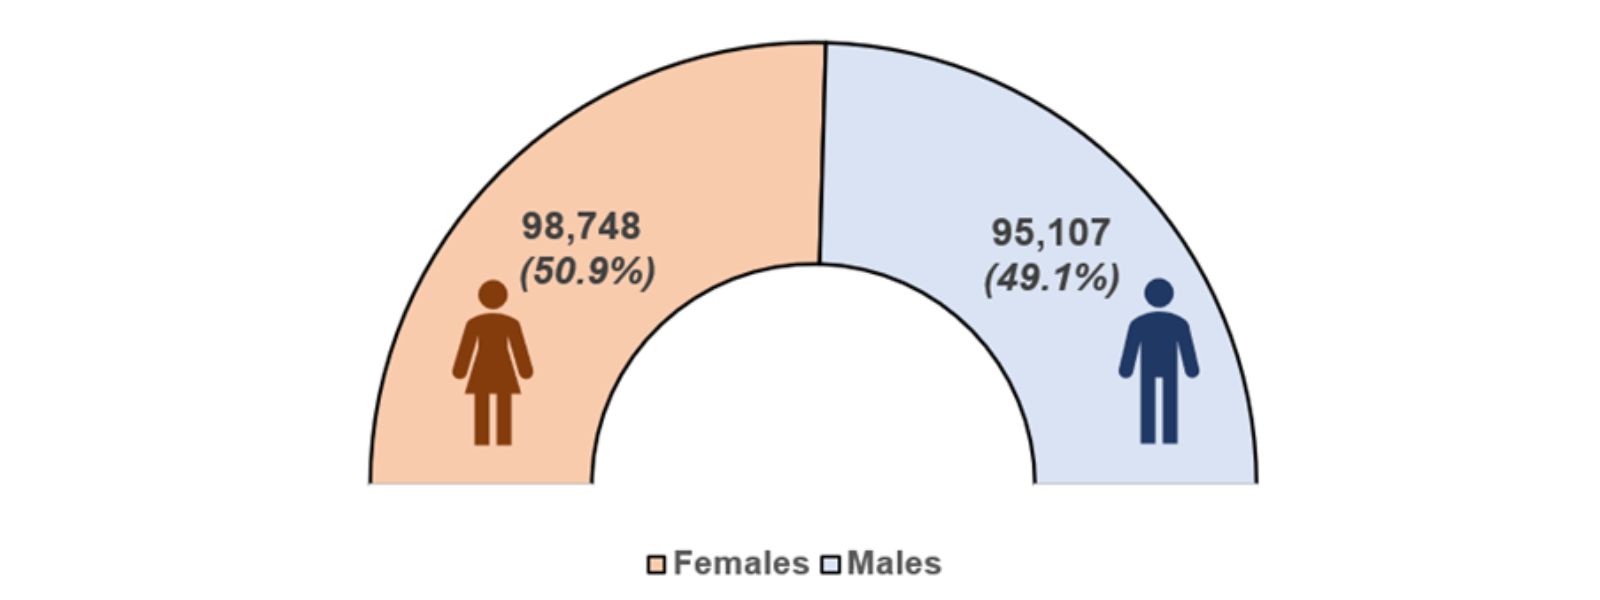 Figure 1: Number and percentage of male and female residents in Bury
Figure 2 below presents the population statistics for Bury by Gender for each census year starting from Census 1991.
Figure 2: Number of Male and Female residents in Bury for the census years 1991, 2001, 2011 and 2021
-
.jpg) Figure 2: Number of Male and Female residents in Bury for the census years 1991, 2001, 2011 and 2021
Figure 2: Number of Male and Female residents in Bury for the census years 1991, 2001, 2011 and 2021
Through the census years from 1991 to 2021, Bury has continued to have a slightly higher number of females compared with males, however the difference has slowly reduced at each census. The biggest difference is for census year 1991, where there were 5751 more females compared with males and the lowest difference is for the census year 2021, where there were 3641 more females compared with males.
Geographical Distribution
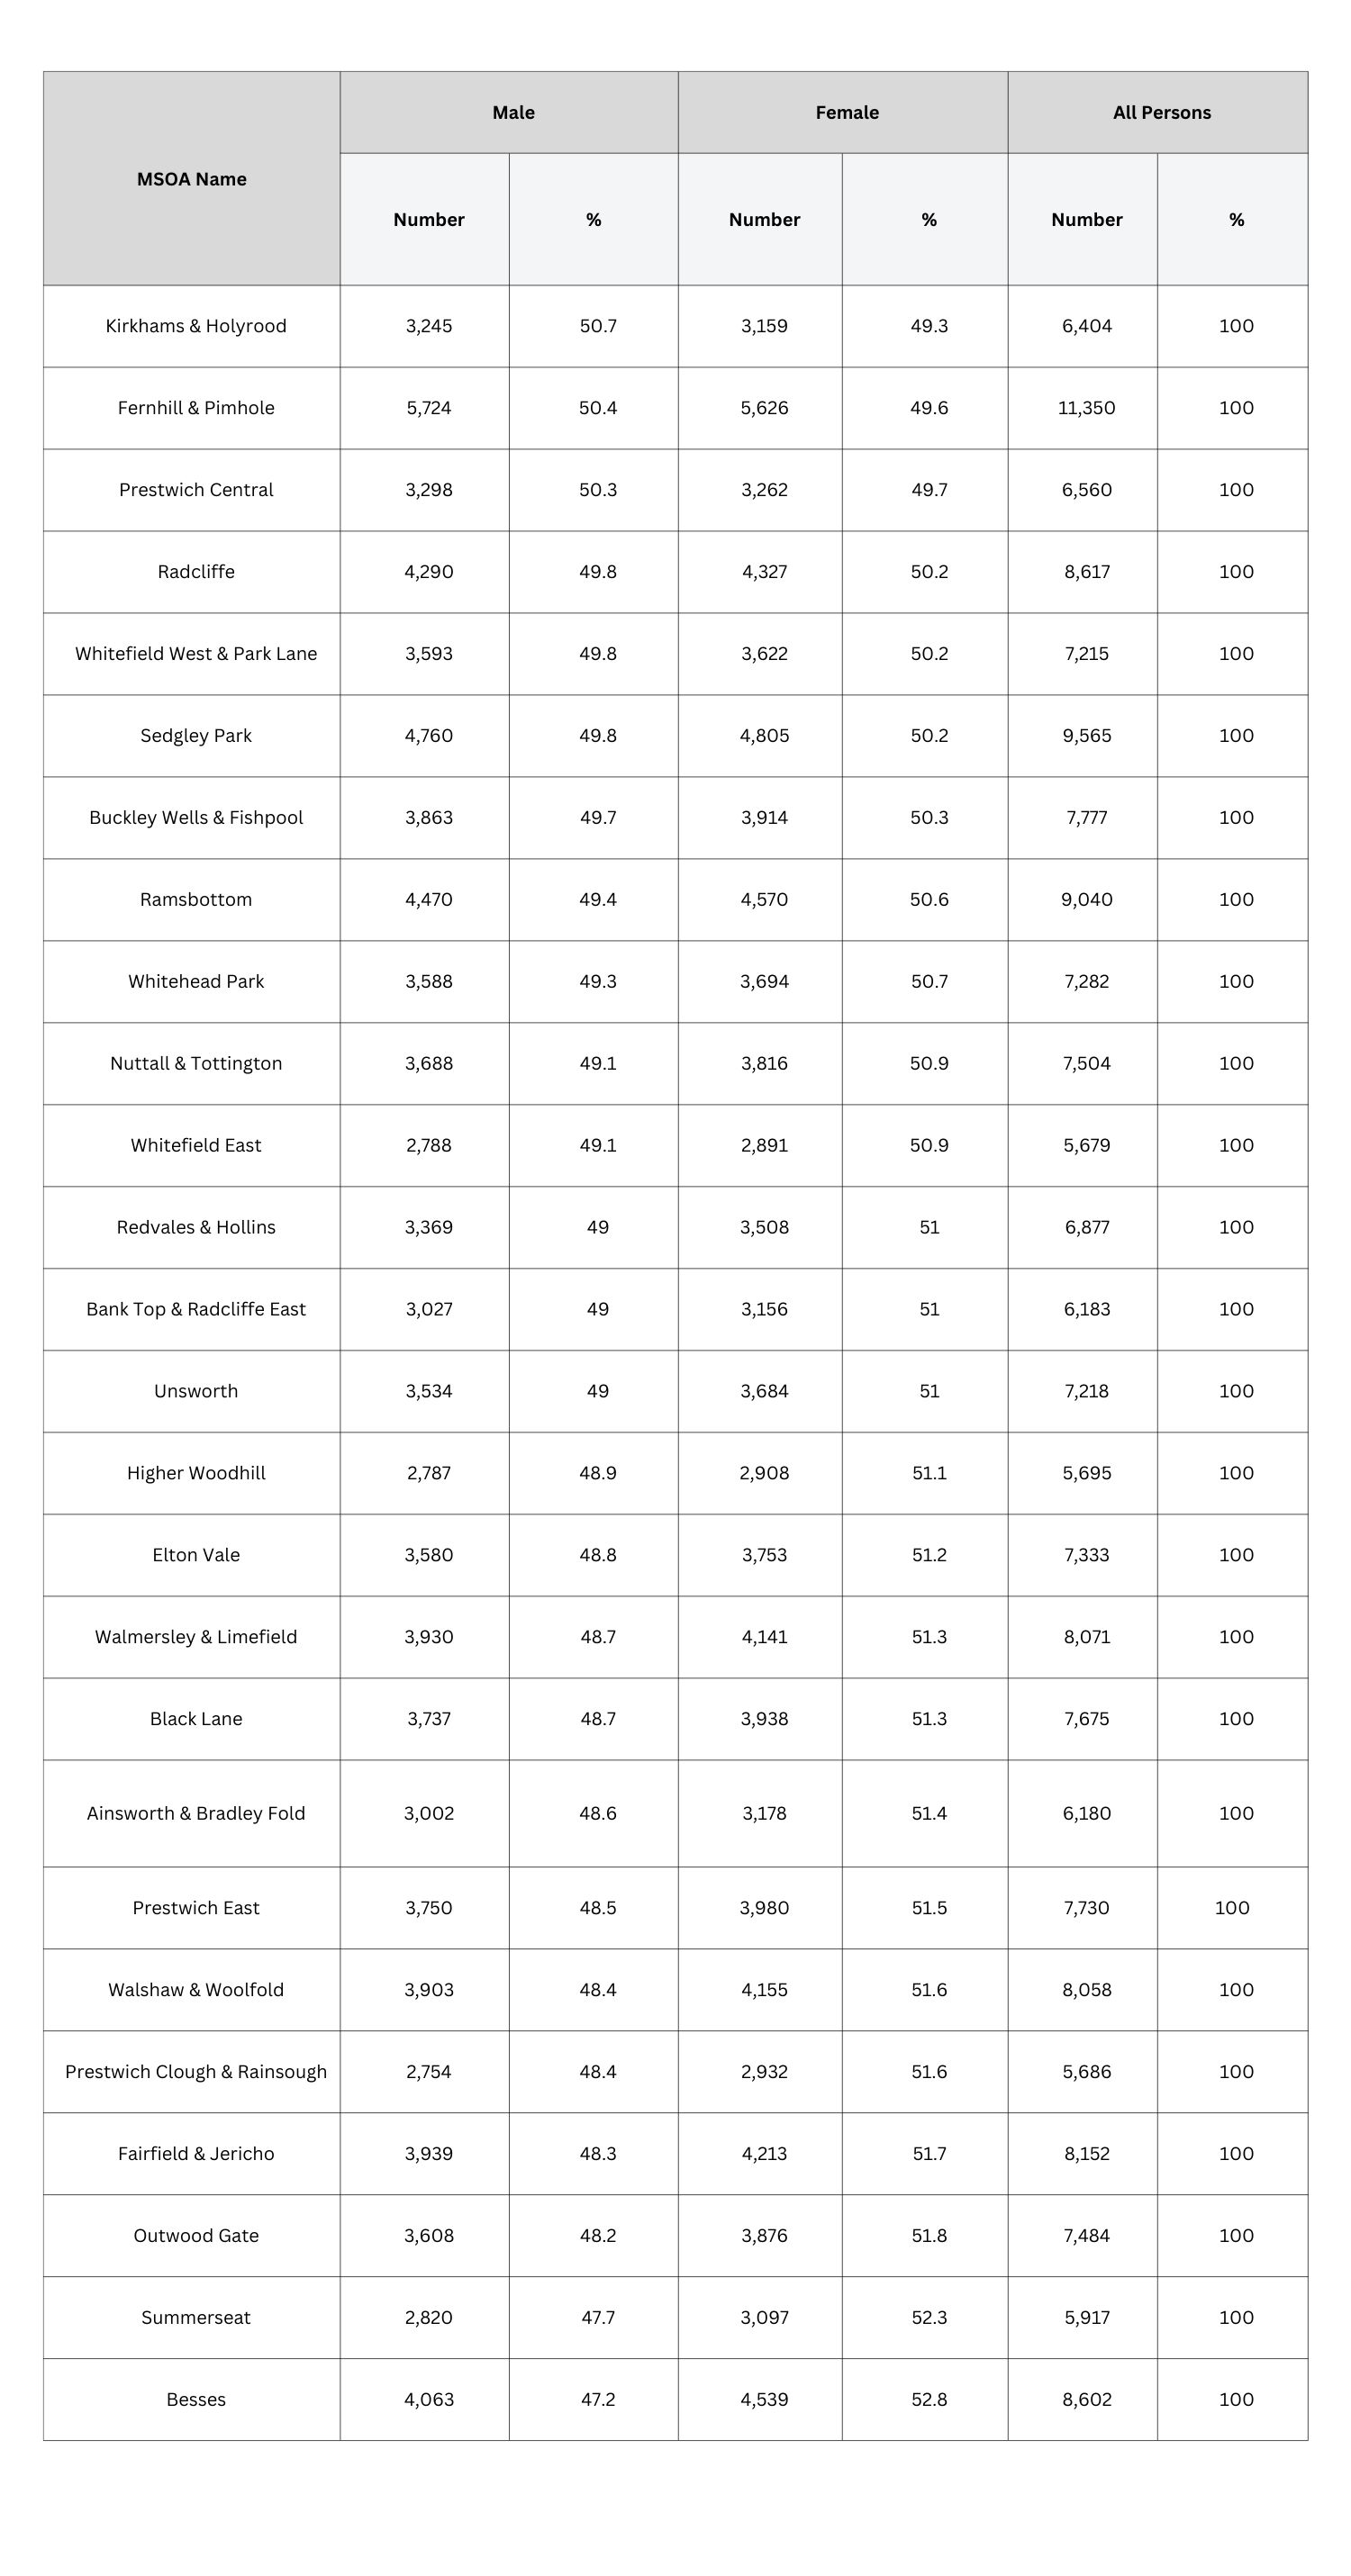
Only 3 of the16 MSOAs in Bury (Kirkhams & Holyrood, Fernhill & Pimhole and Prestwich Central) have higher percentages of males compared with females. (Census 2021).
Table 1: Number and percentage of Male and Female residents by MSOAs in Bury
-
 To download a copy of this table, please left click the button below or use the 'Related Files' section located at the bottom of the page.
Broad age groups
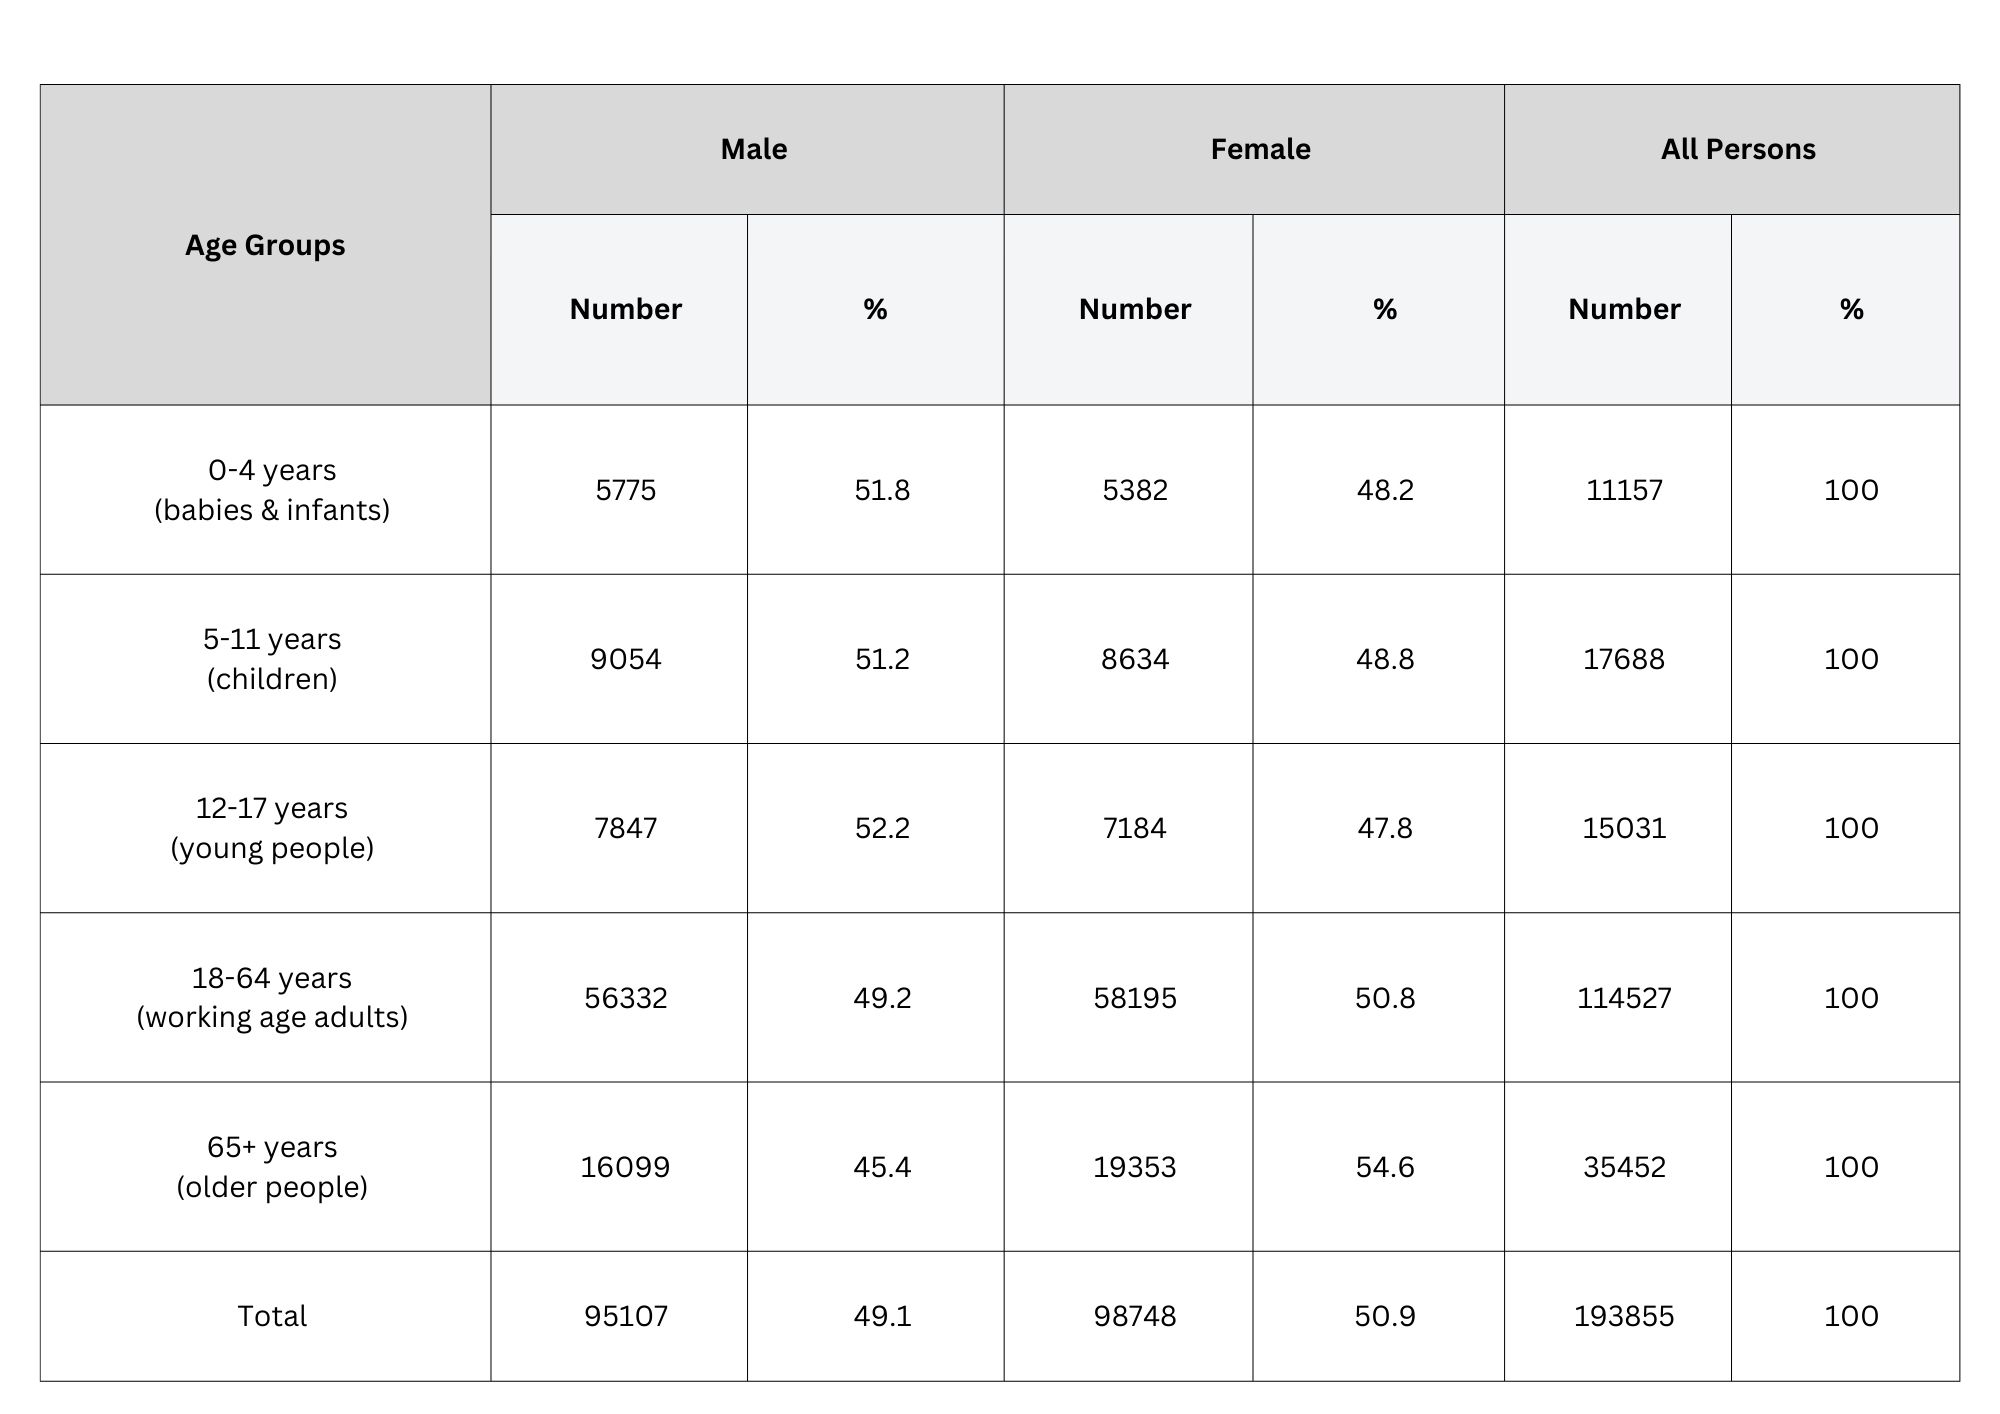
Based on the results of Census 2021 for Bury, there are 1,476 more males under 18 years of age compared with females. Across broad age groups, a total of 5,775 male and 5382 female babies & infants (0-4 years of age). Similarly, there are more children (5-11 years of age) who are males (9,054) compared with females (8,634). Young people (12-17 years of age) also follow a similar pattern with more males (7,847) than females (7,184).
When looking at working age adults (18-64 years old) and older age adults (65+ years old), the pattern reverses. There are 1863 more working age females compared with males (58,195 and 56,322 respectively) and 3254 more older age adult females compared with males (19,353 and 16,009 respectively).
Table 2: Number and percentage of Male and Female residents by Broad age groups in Bury
-
 To download a copy of this diagram, please left click the button below or use the 'Related Files' section located at the bottom of the page.
The highest difference between the genders is in the 65+ age group (older people), where there are 3,254 more females compared with males. On average, females currently live longer than males (see Life expectancy), which significantly impact the sex profile of Bury’s population