Vulnerable Children and Young People
Vulnerable Children and Young People
Vulnerable Children and Young People
The section on vulnerable children and young people explores key indicators that provide valuable insights into their welfare, social services, education, school performance, justice system involvement, and housing situation. These indicators offer a comprehensive understanding of the challenges and needs faced by this vulnerable population. By examining these indicators, we can gain a deeper understanding of their unique circumstances and develop targeted interventions to address their specific needs.
Children Services
Local authorities have a statutory duty to protect children living in their area.
The primary objective of Children's Services is to provide assistance and safeguard vulnerable children. This entails offering additional support to both children and their families. When there are concerns about a child being at risk of harm, Children's Services take necessary measures to ensure their safety. The extent of their involvement may vary and adapt depending on several factors, including:
The specific help required by the parent and the child.
The presence of suspicion that a child has experienced or is at risk of harm.
Assessment of whether the child's situation is improving or deteriorating.
Children's Services engage with families at different levels, which can be classified as follows:
Universal services: These services are accessible to every family and typically involve professionals such as health visitors, general practitioners (GPs), and school nurses.
Early help: This level of involvement occurs when a problem is identified concerning a child, leading to an assessment. Children in this category may require additional support, such as speech therapy, counselling (e.g., CBT), or other forms of assistance.
Child in need: This level involves assessing the complex needs of a child, including those with disabilities. The objective is to enable the child to remain in their own home while providing additional support, which may include:
Day care services for children under the age of 5
Parenting classes or courses
Family support workers or practical assistance at home
Aid with housing
A plan is often formulated to facilitate ongoing monitoring and care for the child.
Children in care
Children and young people in care are among the most socially excluded in children in England. There are significant inequalities in health and social outcomes compared with all children and these contribute to poor health and social exclusion of care leavers later in life.
This indicator is defined as Children looked after at 31 March as a crude rate per 10,000 population aged under 18 years. A child who has been in the care of their local authority for more than 24 hours is known as a looked after child. Looked after children are also often referred to as children in care, a term which many children and young people prefer.
Based on the most recent data available, the crude rate of children in care per 10,000 population aged under 18 years in Bury for the year 2022 was 82 per 10,000 population aged under 18 years and statistically higher than England average of 70 per 10,000 population (Child and Maternal Health, 2022).
Trend data for Bury and England are only available for the years 2021 and 2022. Children in care rate for Bury increased from 80 per 10,000 in 2021 to 82 per 10,000 in 2022. Similarly rates in England increased from 67 per 10,000 in 2021 to 70 per 10,000 in 2022. The rates for Bury were higher than England average (statistically significant) for both the years (Child and Maternal Health, 2022).
Bury has the 3rd highest rate of children in care in its group of 6 statistical children service neighbours with the highest rate in Stockton-on-Tees of 133 and lowest rate in Stockport at 72 for the year 2022 (Child and Maternal Health, 2022).
There are no data on inequalities for Bury (Child and Maternal Health, 2022). England data are available by levels of deprivation only. Data for England based on deprivation deciles suggests a deprivation gradient with increasing rates of children in care by increasing levels of deprivation. The most deprived decile in England has a rate of 110 compared with 45 in the least deprived decile for the year 2022 (Child and Maternal Health, 2022).
Looked after children aged 10-15
This indicator is defined as crude rate per 10,000 population of looked after children and young people aged 10-15 at 31st March.
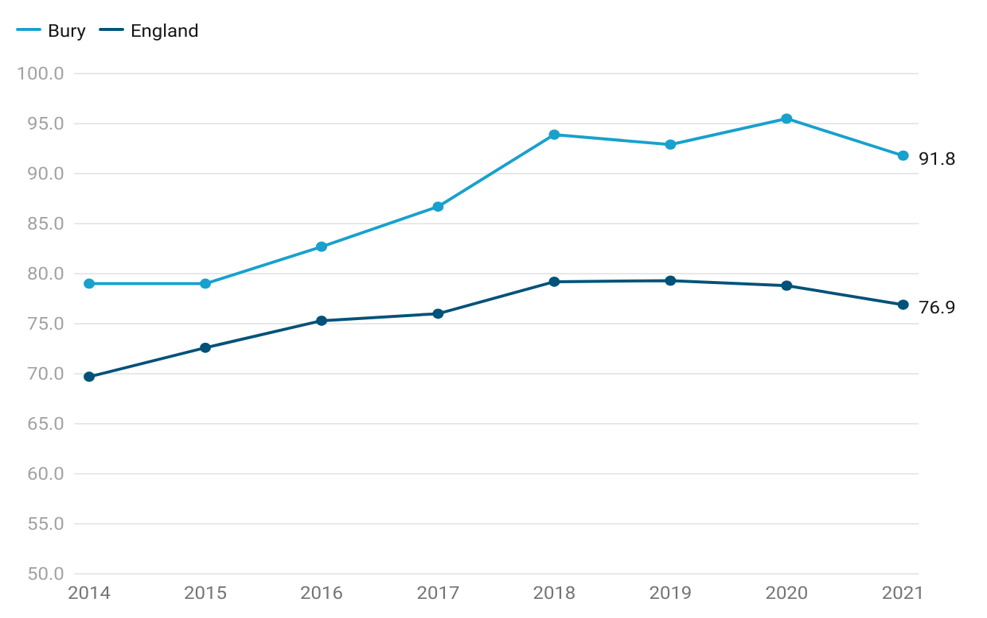
Based on the most recent data available, the crude rate of looked after children per 10,000 population of looked after children and young people aged 10-15 for the year 2021 was 91.8 per 10,000 population and statistically higher than England average of 76.9 per 10,000 (Child and Maternal Health, 2021).
Examining trend for Bury, crude rate of looked after children per 10,000 population of looked after children and young people aged 10-15 steadily increased from the lowest rate of 79 in 2014 to 95.5 in 2020. This was followed by a slight decline to 91.8.
England saw a consistent gradual increase from 69.7 per 10,000 population in 2014 to 79.3 per 10,000 population in 2019. This was followed by a slight decline with the rate reaching 78.8 in 2020 and further declining to 76.9 in 2021 (Child and Maternal Health, 2021).
Comparing Bury to England, the rates were similar to England average from the year 2014 to 2019 and higher (statistically significant) than England average for the year 2020 and 2021 (Figure 1). There is no significant change in trend for Bury based on the 5 most recent data points.
Figure 1: Trend crude rate per 10,000 population of looked after children and young people aged 10-15 at 31st March for Bury and England from the year 2014 to 2021
Bury has the 3rd highest rate of looked after children in its group of 6 statistical children service neighbours with the highest rate in Stockton-on-Tees of 149.2 and lowest rate in Stockport at 74.3 for the year 2021 (Child and Maternal Health, 2021).
There are no data on inequalities for Bury (Child and Maternal Health, 2021). England data are available by levels of deprivation only. Data for England based on deprivation deciles suggests a deprivation gradient with increasing rates of looked after children by increasing levels of deprivation. The most deprived decile in England has a rate of 122.1 compared with 48.6 in the least deprived decile for the year 2021 (Child and Maternal Health, 2021).
Percentage (%) of looked after children whose emotional wellbeing is a cause for concern
This indicator is defined as the proportion of all looked after children aged between 5 and 16 (inclusive) at the date of their latest assessment, who have been in care for at least 12 months on 31 March whose Strengths and Difficulties Questionnaire (SDQ) score was 17 or over. The SDQ score is a 25-item measure designed to assess behaviours, emotions, and relationships over the last six months in children and young people aged 4–17 years. This indicator presents the proportion of looked after children in the area who are affected by poor emotional wellbeing.
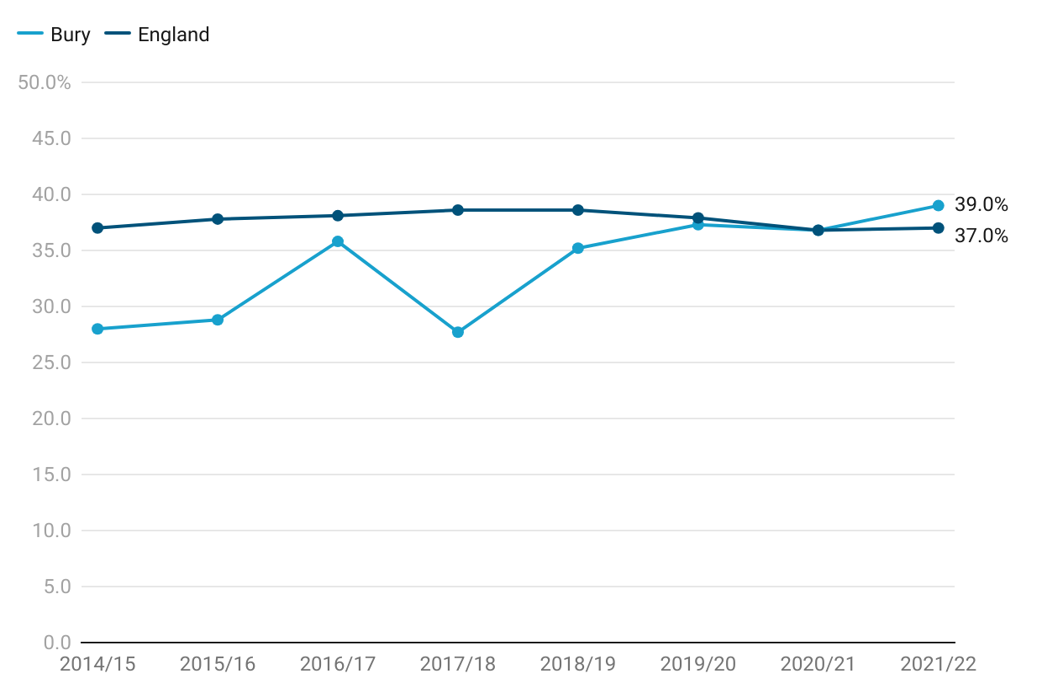
In 2021/22, the percentage of looked after children in Bury whose emotional well-being is a cause for concern was 39%, slightly higher than but statistically similar to England average of 37%.
The trend for the percentage of looked after children in Bury whose emotional well-being is a cause for concern has gradually increased with some fluctuations from the lowest at 28% in 2014/15 and highest at 39% in 2021/22. From 2014/15 to 2015/16, there was a slight increase from 28% to 28.8%, followed by a sharper rise to 35.8% in 2016/17. In 2017/18, the percentage decreased to 27.7%, but then increased again in 2018/19 to 35.2%. The trend continued with a further increase to 37.3% in 2019/20. In 2020/21, the percentage remained relatively stable at 36.8%, before increasing to 39% in 2021/22.
The trend in England has remained relatively stable. From 2014/15 to 2019/20, the percentages of looked after children whose emotional well-being is a cause for concern remained consistent, ranging from 37% to 38.6%. In 2020/21, the percentage decreased slightly to 36.8%, before marginally increasing to 37% in 2021/22.
Throughout the observed period (2014/15 to 2021/22), the proportion of looked after children whose emotional well-being is a cause for concern in Bury has generally remained statistically similar to the average in England. However, it is important to highlight that there was an exception during the period of 2017/18, where the proportion in Bury was significantly lower (statistically significant) compared to England average (Figure 2). There is no significant change in trend for Bury based on the 5 most recent data points.
Figure 2: Trend in percentage (%) of looked after children whose emotional wellbeing is a cause for concern for Bury and England from the period 2014/15 to 2021/22
Bury has the 3rd highest proportion of looked after children whose emotional well-being is a cause for concern in its group of 6 statistical children service neighbours with the highest proportion in Calderdale of 41% and lowest rate in Lancashire at 33% for the year 2021/22 (Child and Maternal Health, 2022).
There are no data on inequalities for Bury (Child and Maternal Health, 2022). England data are available by levels of deprivation only. Data for England based on deprivation deciles suggests that the highest percentage (%) of looked after children whose emotional wellbeing is a cause for concern are in the fourth less (42%) and fifth less (40%) deprived deciles. The most deprived decile in England has the lowest percentage (33%) of looked after children whose emotional wellbeing is a cause for concern (Child and Maternal Health, 2022). Data on inequalities by sex suggests that a higher proportion of male looked after children’s emotional well-being is a cause for concern (40% ) compared with females (34% ) (Child and Maternal Health, 2022).
Immunisation
Looked after children can be at a higher risk of missing out on childhood vaccinations. This indicator measures the proportion of children in care for at least 12 months whose immunisations were up to date.
Children in care immunisations.
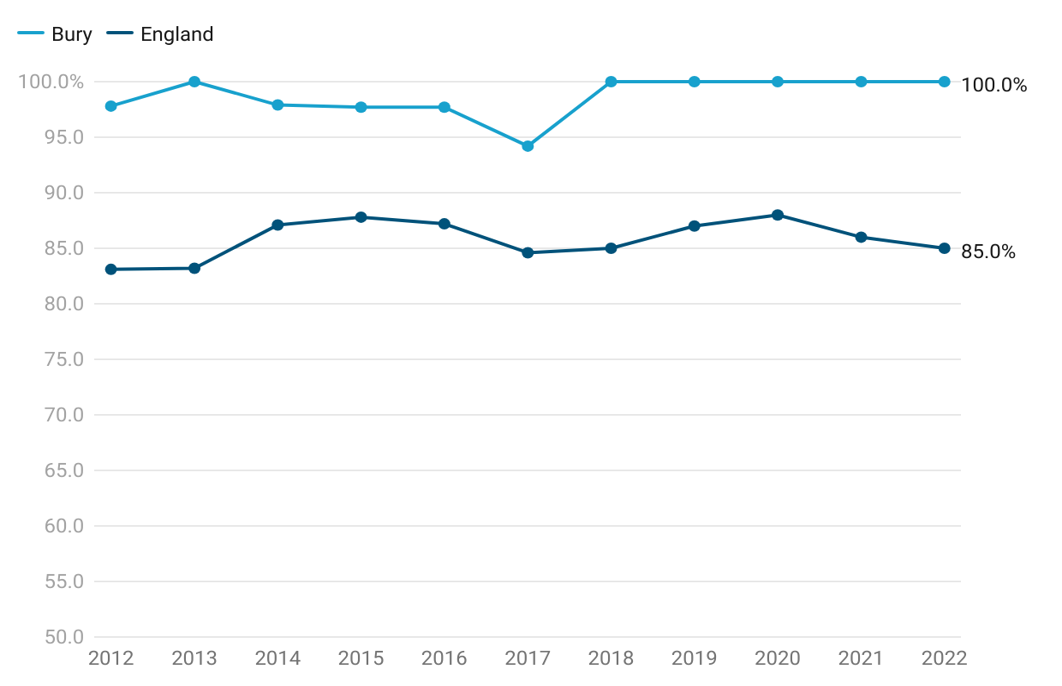
In 2022, the percentage of children in care who are up to date with the vaccinations in the NHS routine list was 100%, higher and statistically better than England average of 85%.
The trend for children in care immunisations in Bury has shown consistently high levels of immunisation coverage over the specified period. In 2012, the proportion of children in care who received immunisations was 97.8% that declined to 94.2% in 2017 and then remained at 100.0% from 2018 to 2022. This indicates that virtually all children in care in Bury, based on the available data, have received the recommended immunisations from the year 2018.
The proportion of children in care receiving immunisations in England has remained below 90% from the year 2012 to 2022. The proportion gradually increased with slight fluctuations from 83.1% in 2012 to 88.0% in 2020. However, there was a slight drop to 86% in 2021 and further to 85% in 2022 (Figure 3). No recent trend for Bury can be calculated based on the five most recent data points.
Figure 3: Trend in percentage (%) of children in care immunisations for Bury and England from the period 2012 to 2022
Bury has the highest proportion of children in care immunisations in its group of 16 similar local authorities with the lowest rate in Medway at 83% for the year 2022 (Child and Maternal Health, 2022).
There are no data on inequalities for Bury (Child and Maternal Health, 2022). England data are available by levels of deprivation only. Data for England based on deprivation deciles suggests that the highest immunisation rate of 91% (statistically better than England average) is observed in the second most deprived decile and the second least deprived decile has the lowest immunisation rates of 77.4% (statistically worse than England average) (Child and Maternal Health, 2022).
Child Protection
A child protection plan is a plan drawn up by the local authority which sets out how a child can be kept safe, how things can be made better for the family and what support they will need. Children subject to a child protection plan will have a primary need code of abuse (physical, sexual or emotional) or neglect. More information on what constitutes to abuse can be found in the Children in need census guide. The Department for Education (DfE) is responsible for child protection in England. It sets out policy, legislation, and statutory guidance on how the child protection system should work.
Local safeguarding partners are responsible for child protection policy, procedure, and guidance at a local level. The local safeguarding arrangements are led by three statutory safeguarding partners:
Local authority
Integrated care board (ICB, previously clinical commissioning group or 'CCG')
Police
Working together with other relevant agencies, they must co-ordinate and ensure the effectiveness of work to protect and promote the welfare of children, including planning, identifying, and supporting children at risk of harm.
Children on child protection plans: Rate per 10,000 children <18 years
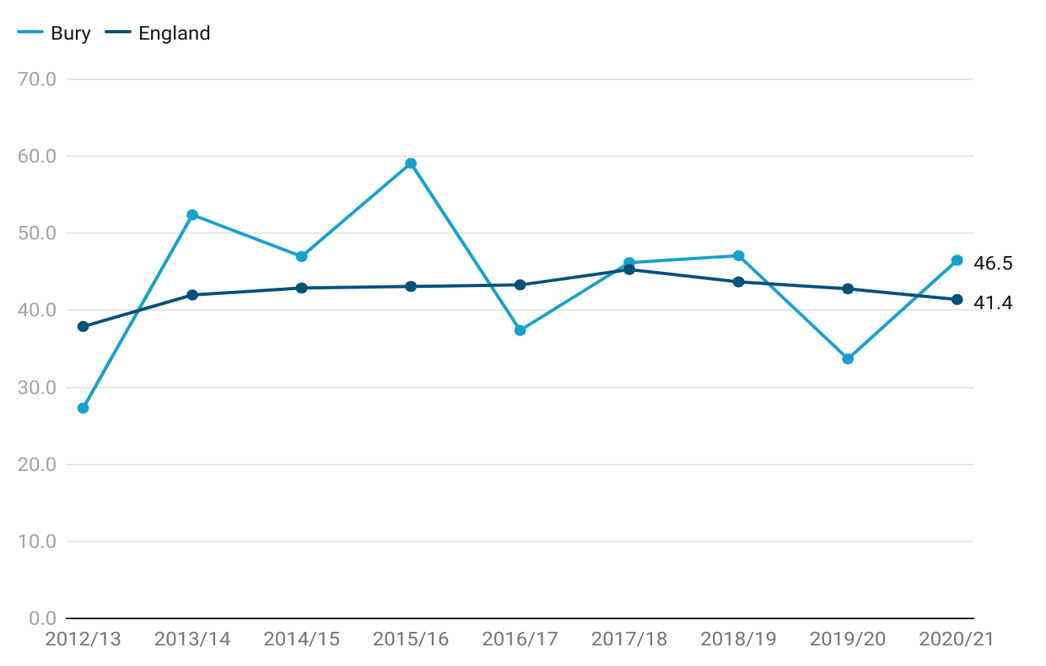
This indicator is defined as the number of children who are the subject of a child protection plan at the end of the year (31 March) expressed as a crude rate per 10,000 children aged 0-17 years. Rate of children on child protection plans in Bury for the period 2020/21 was 46.5 per 10,000 children <18 years and statistically similar to England average of 41.4.
The trend for the rate of children on child protection plans in Bury has shown some fluctuations over the specified period. In 2012/13, the rate was 27.3 per 10,000 children aged 0-17 years, which increased to 52.4 in 2013/14 and then decreased to 47 in 2014/15. The rate continued to vary in subsequent years, with a peak of 59.1 in 2015/16, a decrease to 37.4 in 2016/17 and another increase to 46.2 in 2017/18. This was followed by a decline to 33.7 in 2019/20, before experiencing a slight increase to 46.5 in 2020/21.
From 2012/13 to 2020/21, the trend in the rate of Children on child protection plans in England showed some variations. In 2012/13, the rate was 37.9 per 10,000 children and increased to 42.0 in 2013/14. It continued to rise to 42.9 in 2014/15 and reached its highest point at 45.3 in 2017/18. This was followed by a period of consistent decline from 43.7 in 2018/19, to 42.8 in 2019/20 and 41.4 in 2020/21 (Figure 4).
Comparing Bury with England, Bury has generally maintained similar rates to the England average from 2016/17 to 2020/21 (Figure 4). There is no significant change in trend for Bury based on the 5 most recent data points.
Figure 4: Trend in children on child protection plans expressed as crude rate per 10,000 children <18 years for Bury and England from the period 2012/13 to 2020/21 (Child and Maternal Health, 2021)
Bury has the 3rd highest rate of children on child protection plans in its group of 6 statistical children service neighbours with the highest rate in Stockton-on-Tees and lowest rate in Lancashire at 22.5 for the year 2020/21 (Child and Maternal Health, 2021).
There are no data on inequalities for Bury (Child and Maternal Health, 2021). England data are available by levels of deprivation only. Data for England based on deprivation deciles suggests that the highest rate of children on child protection plans (statistically higher than England average) was observed in the most deprived decile at 65.8 and the lowest rate was observed in the 3rd less deprived decile at 29.9 (statistically lower than England average) (Child and Maternal Health, 2021).
Youth Justice System
Crime and Disorder Act of 1998 led to the establishment of the youth justice system in England and Wales, with a primary objective of preventing young individuals from offending or re-offending. The Youth Justice Board for England and Wales oversees the system at the national level, while its implementation is carried out locally through youth offending teams (YOTs). In England and Wales, the age of criminal responsibility is set at ten years old, and young individuals are considered adults under the legal system once they reach the age of eighteen. This framework is designed to provide a structured and supportive approach to addressing youth offending, aiming to promote rehabilitation and positive behavioural changes for young offenders.
Children and young people at risk of offending or within the youth justice system often have more unmet health needs than other children and face a range of health inequalities, including learning disabilities, mental health issues, and risky health behaviours. Studies indicate that over a quarter of children and young people in the youth justice system have a learning disability (Bryan, 2004). Rates of mental health problems are significantly higher for those involved in the criminal justice system compared to the general population, with higher suicide rates in this group (Leon, 2002; Fazel et al., 2005). The experience of criminality, legal issues, and detention can be stressful and traumatic, contributing to higher rates of mental illness (Balmer et al., 2015). Moreover, young offenders tend to engage in risky health behaviours, with a substantial proportion reporting regular alcohol consumption before entering custody (Lennox, 2014).
First time entrants to the youth justice system
Inclusion of this indicator ensures that vulnerable children and young people (aged 10 to 17) at risk of offending, are included in mainstream planning and commissioning. It is measured as a crude rate of 10- to 17-year-olds receiving their first reprimand, warning or conviction per 100,000 population aged 10 to 17 years by area of residence.
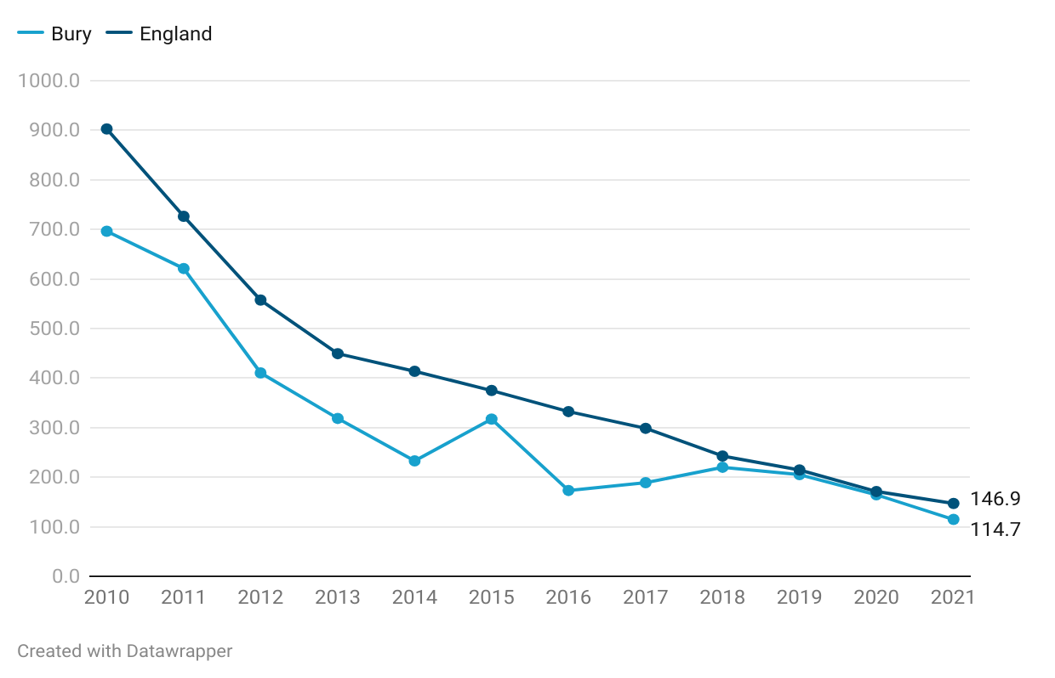
Rate of first time entrants to the youth justice system in Bury for the year 2021 was 114.7 per 100,000 population aged 10 to 17 years by area of residence and statistically similar to England average of 146.9.
The trend for the rate of first time entrants to the youth justice system in Bury has declined from the highest rate of 696.2 in 2010 to the lowest rate of 114.7 in 2021. England saw a similar decline with rates declining from the highest at 902.8 in 2010 to the lowest at 146.9 in 2020. There is no significant change in trend for Bury based on the 5 most recent data points.
Comparing Bury with England, Bury generally maintained statistically better rates to the England average from the year 2010 to 2017, with the exception of 2011 and 2015 when Bury's rates were statistically similar to England average. From the year 2018 to 2021, the rates were statistically similar to England average (Figure 5). There is no significant change in trend for Bury based on the 5 most recent data points.
Figure 5: Trend in first time entrants to the youth justice system expressed as crude per 100,000 population aged 10 to 17 years by area of residence from the year 2010 to 2021
Children entering the youth justice system (10-17 yrs)
This indicator is defined as the crude rate of children and young people aged 10 to 17 years cautioned or sentenced per 1,000 population.
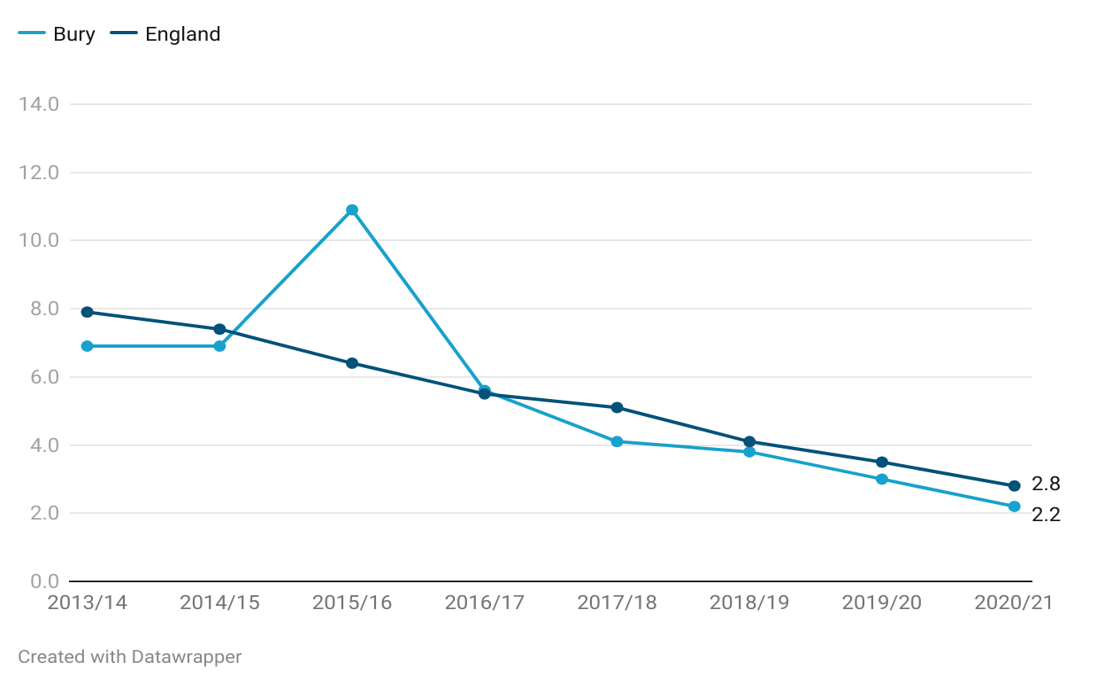
Rate of children entering the youth justice system (10-17 yrs) in Bury for the period 2020/21 was 2.2 per 1,000 population and statistically better than England average of 2.8.
The trend for the rate of Children entering the youth justice system (10-17 yrs) in Bury has seen an overall decline with some fluctuations. After remaining stable at 6.9 in both 2013/14 and 2014/15, the rates sharply increased to their peak of 10.9 in 2015/16. There was a significant decline to 5.6 in 2016/17, followed by a consistent downward trend. The rate continued to decrease, reaching its lowest point of 2.2 in 2020/21. England has seen a consistent decline from 7.9 in 2013/14 to 2.8 in 2020/21. No recent trend for Bury can be calculated based on the five most recent data points.
Comparing Bury with England, the rates have remained statistically similar or better than England average, with the exception of the period 2014/15, where the rate in Bury of 10.9 was statistically higher than England average of 6.4.
Figure 6: Trend in Children entering the youth justice system (10-17 yrs) expressed as crude per 1000 population from the period 2013/14 to 2020/21
Bury has the 4th highest rate of Children entering the youth justice system (10-17 yrs) in its group of 6 statistical children service neighbours with the highest rate in Calderdale at 4.1 and the lowest rate in Lancashire at 1.8 for the period 2020/21 (Child and Maternal Health, 2021).
There are no data on inequalities for Bury and England (Child and Maternal Health, 2021).
Homelessness
Homelessness is linked to extreme poverty and serves as a social determinant of health. It often results from a complex interplay of factors, including relationship breakdowns, financial debt, adverse childhood experiences, and ill health.
Homelessness is associated with poor health, education and social outcomes. Young people experiencing homelessness face multiple and complex challenges, often lacking essential life skills, support systems, and access to services. They are more likely to have experienced trauma, abuse, and other adverse events, and as a result, may struggle with mental health issues, self-harm, and substance abuse. Educational attainment is also affected, with higher rates of school absenteeism, exclusion, and disengagement from education, employment, or training opportunities.
Homeless young people are vulnerable to exploitation, abuse, and involvement in criminal activities and/or gangs. They are also at an increased risk of sexually transmitted infections and unwanted pregnancies, facing pressure to exchange sex for food, shelter, drugs, or money (LGA, 2017).
Homelessness - households owed a duty under the Homelessness Reduction Act (main applicant 16-24 yrs)
This indicator is defined as Households owed a prevention or relief duty under the Homelessness Reduction Act, where the main applicant is aged 16-24 years, crude rate per 1,000 estimated households. A household is defined as one person living alone or a group of people (not necessarily related) living at the same address who share cooking facilities and share a living room or sitting room or dining area. This includes sheltered accommodation units in an establishment where 50% or more have their own kitchens (irrespective of whether there are other communal facilities) and all people living in caravans on any type of site that is their usual residence; this will include anyone who has no other usual residence elsewhere in the UK.
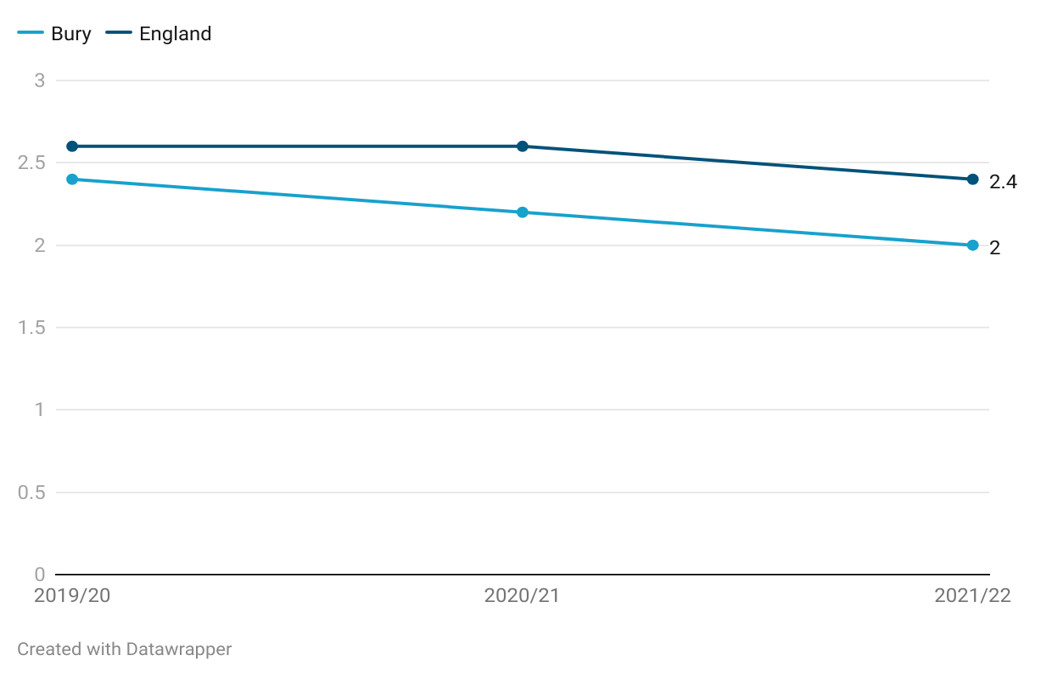
The crude rate of households owed a duty under the Homelessness Reduction Act (main applicant 16-24 yrs) in Bury for the period 2021/22 was 2 per 1,000 estimated households, statistically similar to England average of 2.4 per 1,000 estimated households.
The trend for the rate of households owed a duty under the Homelessness Reduction Act in Bury has seen a slight decline with rates declining from 2.4 in 2019/20 to 2.2 in 2020/21 and 2 in 2021/22. Rates in England for 2019/20 and 2020/21 were stable at 2.6, followed by a slight decline to 2.4 in 2021/22 (Figure 7).
Comparing Bury with England, the rates remained statistically similar to England average during the period 2019/20 and 2021/22 and statistically better compared with England average in the period 2020/21.
Figure 7: Trend in Homelessness - households owed a duty under the Homelessness Reduction Act (main applicant 16-24 yrs) expressed as crude rate per 1,000 estimated households during the period 2019/20 to 2021/22
Bury has the 3rd highest rate of homelessness (households owed a duty under the Homelessness Reduction Act with main applicant 16-24 years) in its group of 6 statistical children service neighbours with the highest rate in Stockton-on-Tees at 6.2 and the lowest rate in Sefton at 1.2 for the period 2021/22 (Child and Maternal Health, 2022).
There are no data on inequalities for Bury (Child and Maternal Health, 2022). Data for England are available by deprivation only. Fourth more deprived (3.5) and most deprived deciles (3.4) in England have the highest rate of homelessness and the least deprived decile has the lowest rate (1.3). The five more deprived deciles in England have homelessness rates above England average and the five lesser deprived deciles have homelessness rates below England average (Child and Maternal Health, 2022).
Education
Educational attainment is influenced by the quality of education children receive and their family's socioeconomic circumstances, as well as their care situation.
Average Attainment 8 Score among children eligible for Free School Meals (FSM)
Academic achievement of students at the end of Key Stage 4 is measured as the Average Attainment 8 score. The Attainment 8 score is calculated by assigning point values to a student's performance in a set of specified subjects, including English (both literature and language), mathematics, sciences, humanities, and additional optional subjects. Each subject is assigned a point value based on the student's attainment level, with higher scores awarded for higher grades. The points achieved across all subjects are then added up to calculate the Attainment 8 score.
Being on FSM is considered to be a good indicator of socio-economic disadvantage in the UK. Children and young people in the UK are usually eligible for free school meals (FSM) if their parents or carers are on a low income or in receipt of certain benefits. Children on FSM perform relatively poorly compared to counterparts without FSM.
This indicator shows attainment for children eligible for free school meals. Attainment is measured via the Average Attainment 8 measure which is calculated by adding together a student’s highest scores across eight government approved qualifications (including GCSEs and EBacc). Pupils are at the end of Key Stage 4 (KS4) aged 15-16 and attending state-funded schools in England.
Most recent data from 2020/21 suggests that the Average Attainment 8 score of children on FSM in Bury is in the 2nd worst quintile in England at 37.9, with the England average at 39.1 (Child and Maternal Health, 2021).
No trend data are available for Bury and England.
No inequalities data are present for Bury and England. However, this indicator should be compared to the general Average Attainment 8 Score. As pupils eligible for FSM fall under the definition of disadvantage, it can be useful to see the difference in average scores and whether local and national policy interventions are having an impact (Figure 8).
Average Attainment 8 score- Children in care
This indicator presents Key stage 4 Average Attainment 8 score of children looked after continuously for at least twelve months at the end of March (excluding children in respite care). Only children who have been matched to key stage 4 data are included. This is the amended version of key stage 4 data. Includes entries and achievements for these pupils in previous academic years.
Most recent data from 2021/22 suggests that the Average Attainment 8 score of children in care in Bury is in the 2nd worst quintile in England at 22.2, with the England average at 23.2 (Child and Maternal Health, 2022).
Please note that Trend chart is not displayed as the way GCSE grades were awarded changed during the Covid-19 pandemic. 2020 and 2021 data should not be directly compared to attainment data from previous years for the purposes of measuring changes in student performance.
Bury has the 3rd lowest Average Attainment 8 score in its group of 6 statistical children service neighbours with the highest score in Stockton-on-Tees at 25.5 and lowest in Sefton at 19.2 (Child and Maternal Health, 2022).
Mental Health
Understanding and addressing mental health in children is crucial for their overall well-being. Various risk factors, including adverse childhood experiences, family dynamics, socioeconomic factors, and access to mental health services, can impact children's mental well-being.
Hospital admissions as a result of self-harm (10-24 years)
Analysing data on hospital admissions for self-harm in young people is of utmost importance in this regard. By closely examining this data, valuable insights are gained into the prevalence, patterns, and severity of self-harm behaviours among young people. Hospital admissions for self-harm in young people have increased in recent years, with admissions for young women being much higher than admissions for young men. With links to other mental health conditions such as depression, the emotional causes of self-harm may require psychological assessment and treatment. This information helps identify high-risk groups, tailor interventions, and provide timely support and prevention strategies. Accurate and comprehensive data on hospital admissions for self-harm in children is essential for shaping effective mental health policies, improving service provision, and promoting the mental well-being of young people.
Data for this indicator are presented as directly standardised rate of finished admission episodes for self-harm per 100,000 population aged 10-24 years. Hospital admissions rate as a result of self-harm for Bury during the period 2021/22 was 408.3 per 100,000 population aged 10-24 years, statistically similar to England average of 427.3. There are no trend data comparing these hospital admissions for both Bury and England (Child and Maternal Health, 2022).
In comparison to its six neighbouring statistical children services, Bury has the 3rd highest rate of hospital admissions within this age range. The highest rate among Bury neighbours is observed in Sefton, with a rate of 695.5 per 100,000 population 10-24 years of age, while the lowest rate is in Calderdale, at 282.4 per 100,000 population (Child and Maternal Health, 2022).
Data on inequalities in Bury are present by sex only. The indicates significantly higher rates of hospital admissions in females (statistically significant), with a rate of 738.9 per 100,000. On the other hand, males in Bury have a rate of 103.9 per 100,000, which is statistically lower than the England average (Child and Maternal Health, 2022).
Data for England by Sex suggests a similar pattern with higher (statistically significant) hospital admissions rates in females of 711.4 per 100,000 compared to males who have a rate of 153.8 per 100,000 (Child and Maternal Health, 2022).
Generally, higher rates of hospital admissions related to self-harm among females reflects complex emotional and societal realities. Females often find themselves navigating a path that can lead to feelings of intense pressure or distress, sometimes culminating in acts of self-harm. Influences such as societal expectations around appearance and traditional roles can intensify this journey. It's worth noting that females also tend to experience certain mental health challenges, like anxiety and depression, at a higher rate. These conditions are known to increase vulnerability to self-harming behaviours. However, these numbers solely represent hospital admissions and don't necessarily encompass the full spectrum of individuals who self-harm. In fact, males might not always reach out for or receive the help they need as readily.
Examining the data based on levels of deprivation, the lowest rates of admission are in the most deprived decile (391.6) and the highest rate of admissions are in the 5th most deprived (508.7), the third less deprived (479.2) and the least deprived decile (462.4) (Child and Maternal Health, 2022).
Hospital admissions as a result of self-harm (10-14 years)
This indicator is presented as crude rate of finished admission episodes for self-harm per 100,000 population. Hospital admissions rate as a result of self-harm in 10-14 years for Bury for the period 2021/22 is 233.8 per 100,000 similar (statistically significant) to England average of 307.1 (Child and Maternal Health, 2022). There are no trend data for Bury and England as the trend data are being reviewed by ONS.
Bury has the 4th highest rate for admission episodes of self-harm in its group of 6 statistical children service neighbours with the highest rate in Sefton at 619.7 and lowest in Stockton-on-Tees at 153.1 (Child and Maternal Health, 2022).
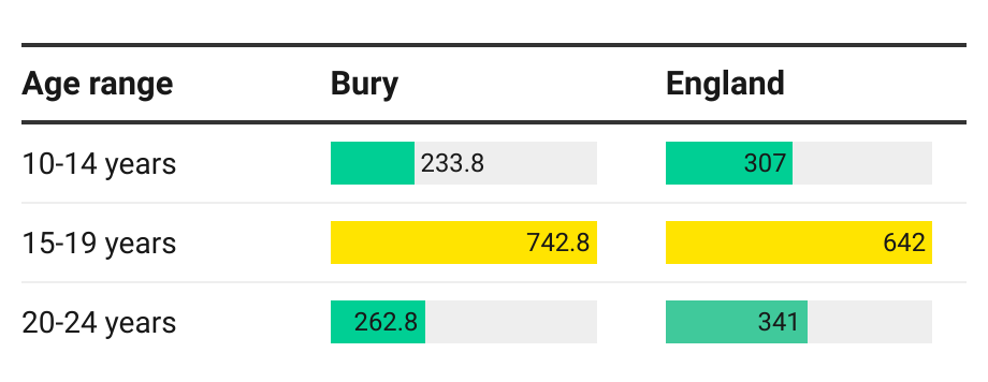
Data on inequalities for Bury are available by age, with lower rates in 10–14 year olds (233.8) and 20-24 year olds (262.8) and average rates (742.8) for 15-19 year olds. Examining data on inequalities for England, a similar pattern is seen by age with lower rates in 10-14 year olds (307) and 20-24 year olds (341) and average rates (642) in 15-19 year olds (Figure 8).
Figure 8: Inequalities in crude rates of finished admission episodes for self-harm per 100,000 population by age in Bury and England
Examining data by deprivation for England shows lower rates of self-harm in the most deprived deciles compared with the least deprived decile. The highest rate is in the fifth more deprived decile (364.6) followed by the fourth less (350.8) and third less (340.4) deprived decile and the lowest rate (270.9) is in the third most deprived decile for 2021/22 (Child and Maternal Health, 2022).
Hospital admissions as a result of self-harm (15-19 years)
This measure is presented as the crude rate of completed admissions for incidents of self-harm per 100,000 individuals in the population. The rate of hospital admissions resulting from self-inflicted harm among individuals aged 15-19 years in Bury during the period 2021/22 stands at 742.8 per 100,000 statistically similar to the average rate of 642 in England (Child and Maternal Health, 2022). Presently, there are lack of available data on trends for both Bury and England, as the data on trends is currently undergoing evaluation by the Office for National Statistics (ONS). Bury has the 2nd highest rate of admission episodes for self-harm in its group of 6 statistical children service neighbours with the highest rate in Sefton at 879.1 and lowest in Calderdale at 423 (Child and Maternal Health, 2022).
Data on inequalities for Bury are available by age and sex. For inequalities by age, please see Figure 9. Data by sex suggests a higher rate (statistically significant) of self-harm in females aged 15-19 years (1386.1) in Bury compared with males (165.8). Examining data on inequalities for England, a similar pattern is seen by sex with significantly higher rates in females (1088.3) compared with males (215.2) (Child and Maternal Health, 2022).
Examining data by deprivation for England shows increasing rates of self-harm by decreasing levels of deprivation overall. However, the highest rate is in the fifth more deprived decile (775.2) followed by the least deprived decile (749.6) and the lowest rate (562.9) is in in the most deprived decile for 2021/22 (Child and Maternal Health, 2022).