Births
Births
Births
-
 Births: this section provides information on trends, fertility, and variations in Bury.
Birth Trends
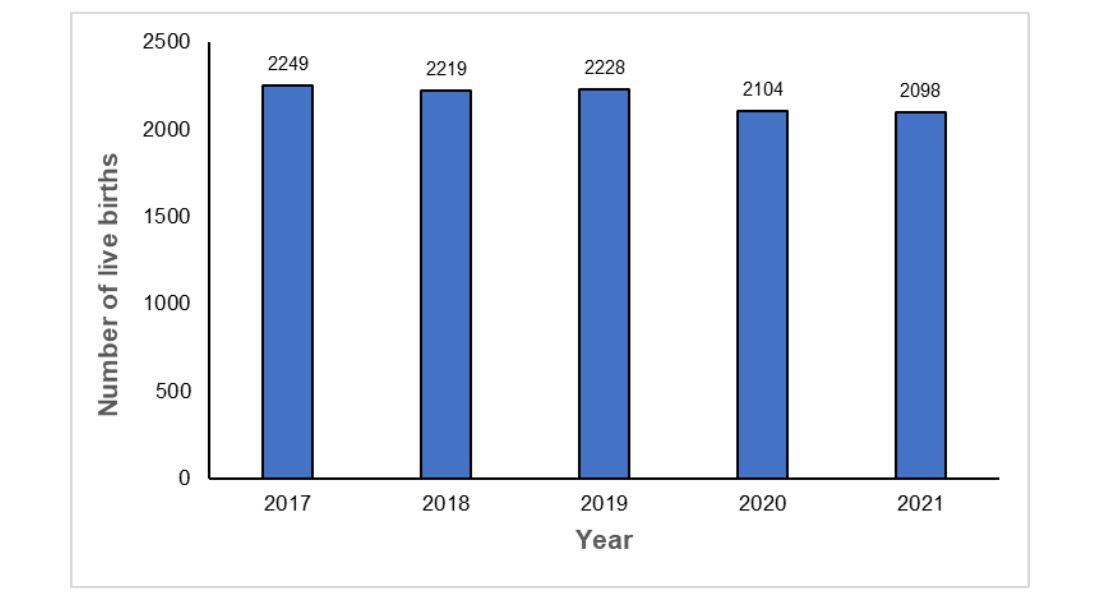
Between the years 2017 and 2021, Bury saw an average of 2,180 live births per year. There appears to be a slight decline in number of live births in Bury to 2104 live births in 2020 and 2098 live births in 2021 (see Figure 1 below).
Figure 1: Number of live births by area of usual residence, Bury 2017-2021.
-
 To download a copy of this chart, please left click the button below or use the 'Related Files' section located at the bottom of the page.
Fertility
The Office for National Statistics (ONS) calculates several measures of fertility, but we will focus on crude birth rate, general fertility rate and total fertility rate.
Crude Birth Rate
This is the simplest measure of fertility and is defined as the proportion of live births per 1,000 population (all ages) based on the ONS mid-year estimate for that calendar year. The crude birth rate is a useful starting point for understanding fertility patterns, but it does not consider the age structure of the population or changes in fertility over time.
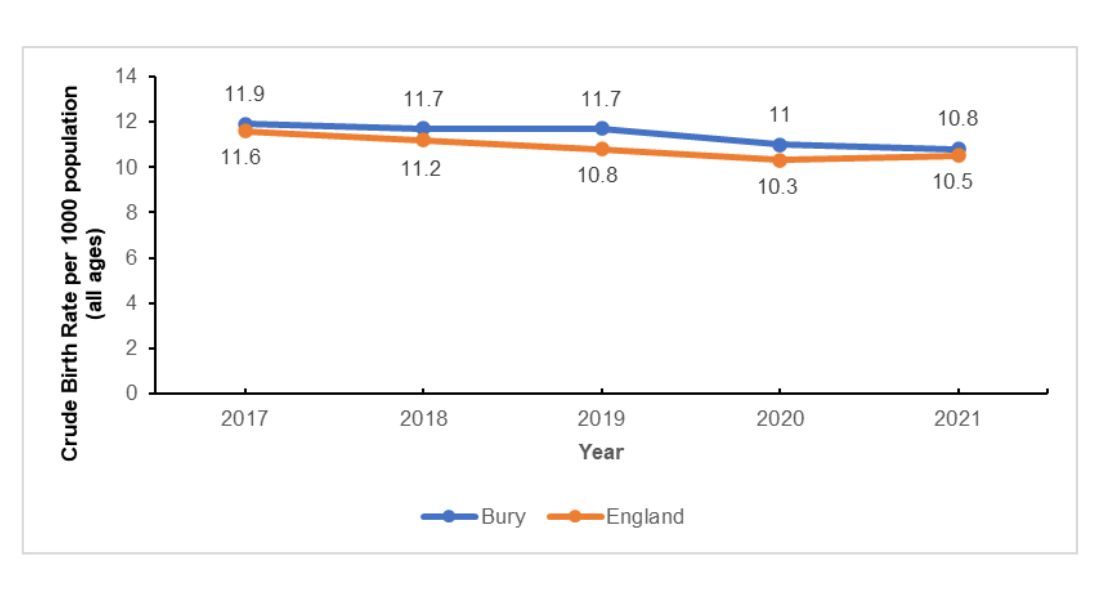
Crude birth rates in Bury remained relatively stable between 2017 to 2019 with 11.9 live births per 1000 population in 2017 to 11.7 per 1000 population in 2018 and 2019. This was followed by a slight decline during the COVID-19 pandemic to 11 live births per 1000 population in 2020 and 10.8 live births per 1000 population in 2021. Data on crude birth rates prior to 2016 for Bury are not available. Data for England suggests that the rate steadily decreased from 11.6 in 2017 to 10.3 in 2020 before slightly increasing to 10.5 live births per 1000 people in 2021 (Figure 2).
Figure 2: Comparison of crude live birth rates by usual area of residence for the years 2017 to 2021 for Bury and England
-
 To download a copy of this chart, please left click the button below or use the 'Related Files' section located at the bottom of the page.
General Fertility Rate (GFR)
The GFR is the number of live births in a given year per 1,000 women aged 15 to 44 years. It is a more refined measure of fertility than the crude birth rate as it considers the age distribution of women in their reproductive years. The GFR is useful for tracking changes in fertility over time and provides a general indication of the level of childbearing in a population.
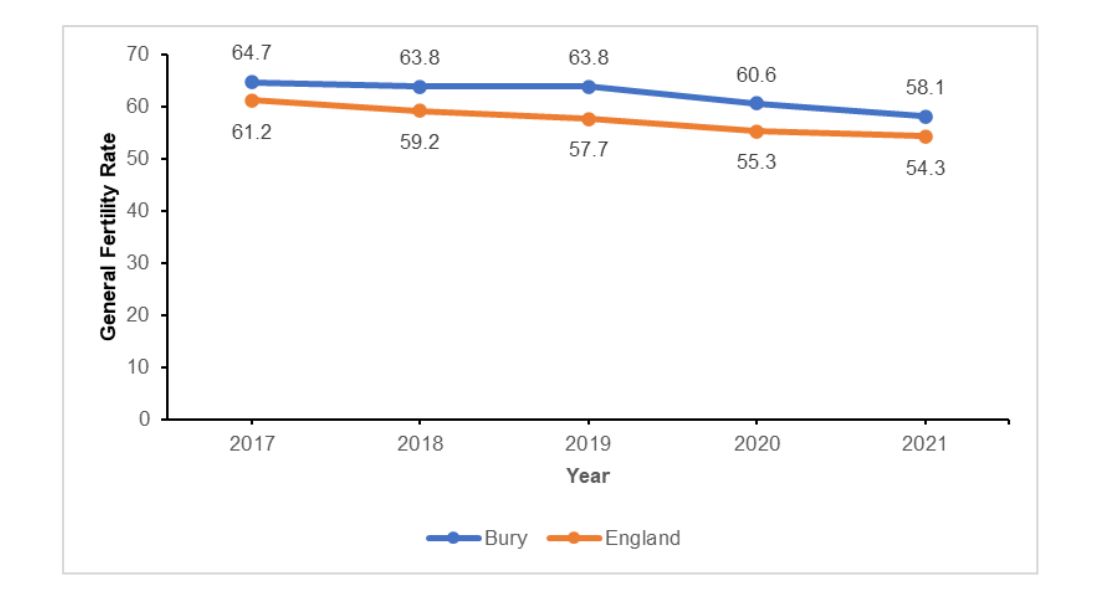
Similar to crude birth rates, general fertility rates in Bury remained relatively stable between 2017 to 2019 with 64.7 live births per 1000 women aged 15-44 years in 2017 to 63.8 per 1000 women aged 15-44 years in 2018 and 2019. This was followed by a decline during the COVID-19 pandemic to 60.6 in 2020 and 58.1 in 2021. Data on general fertility rates prior to 2016 for Bury are not available. In England, there was continuous decline in GFR from 61.2 live births per 1000 women aged 15-44 years in 2017 to 54.3 in 2021. (Figure 3).
Figure 3: Comparison of GFR by usual area of residence for the years 2017 to 2021 for Bury and England
-
 To download a copy of this chart, please left click the button below or use the 'Related Files' section located at the bottom of the page.
The general fertility rate in Bury has remained above England average over the period 2017-2021. This may be due to several factors:
Demographic factors: The age distribution and ethnic composition of a local population can influence the GFR. For example, if a local authority has a higher proportion of women of childbearing age, this can increase the number of live births and raise the GFR. This does not appear to be the case for Bury, where 18% of the population is of childbearing age compared with 19.5% in England.
Socioeconomic factors: Education levels, employment status, and income can also play a role in determining the GFR. Higher levels of education and income are often associated with lower fertility rates, while areas with higher levels of unemployment and poverty may have higher fertility rates.
Cultural factors: Attitudes towards family size and childbearing can vary between regions and communities. For example, some cultural or religious groups may place a strong emphasis on having large families, which can raise the GFR in those areas.
Healthcare access: Access to family planning services and healthcare can also impact the GFR. Areas with better access to reproductive health services and education are likely to have lower GFRs compared to areas with limited access.
It's important to note that the GFR can fluctuate over time and may be influenced by short-term events or changes in policy or initiatives. A higher GFR compared to the national level does not necessarily indicate a better or worse standard of living.
Total Fertility Rate
The total fertility rate (TFR) is the average number of children a woman would have if she experienced the current age-specific fertility rates. It offers a more comprehensive measure of fertility and is helpful for population projections and demographic analysis.
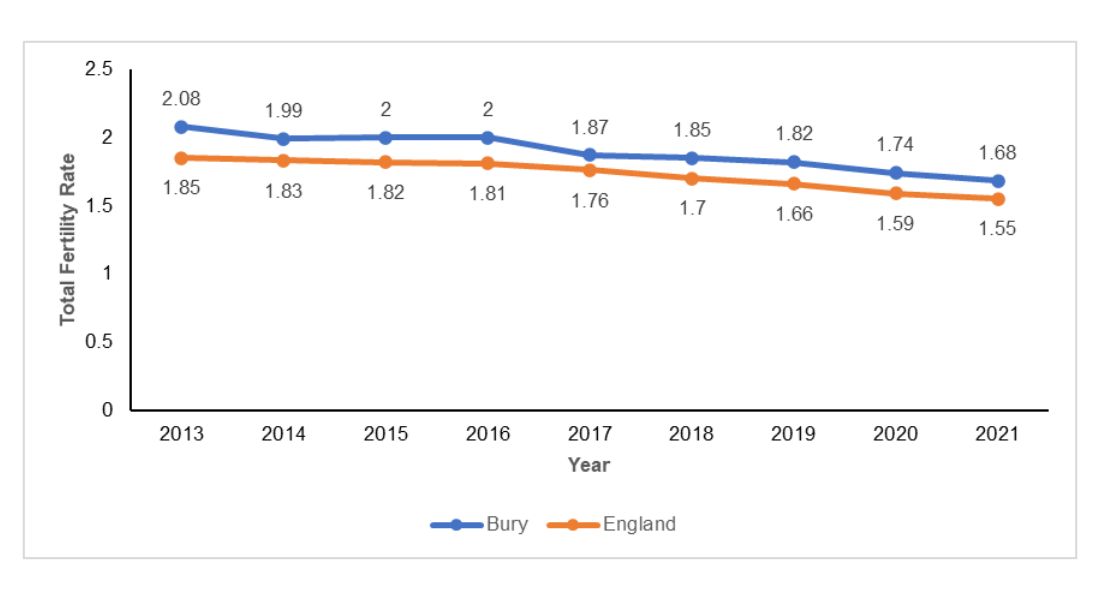
Total fertility rates in Bury remained relatively stable between 2013 to 2016 with 2.08 children per women in 2013 to 2 children per women in 2016. This was followed by a slight decline to 1.87 in 2017 with rates remaining stable at 1.85 and 1.82 in 2018 and 2019 respectively. Another slight decline was seen during the COVID-19 pandemic and this decline has continued from 1.82 in 2019 to 1.68 in 2021. Similar to Bury, TFR remained relatively stable in England from 1.85 in 2013 to 1.81 in 2016. From the year 2016 there has a gradual decline to 1.55 in 2021.
Figure 4: Comparison of TFR by usual area of residence for the years 2017 to 2021 for Bury and England
-
 To download a copy of this diagram, please left click the button below or use the 'Related Files' section located at the bottom of the page.
The continued decline in fertility rates during the COVID-19 pandemic can be attributed to a multitude of factors, including economic insecurity, disruptions to healthcare services, fear of contracting the virus during pregnancy, increased stress levels, changes in daily routines, and uncertainty about the future. The fear of COVID-19 and its unknown impact on maternal and foetal health may have caused some couples to delay or avoid pregnancy. The pandemic has also led to increased stress levels and altered behaviours and priorities, which can negatively impact fertility. It is worth noting that these factors may not be permanent and fertility rates may rise as we emerge from the pandemic.
Fertility rates by Geography
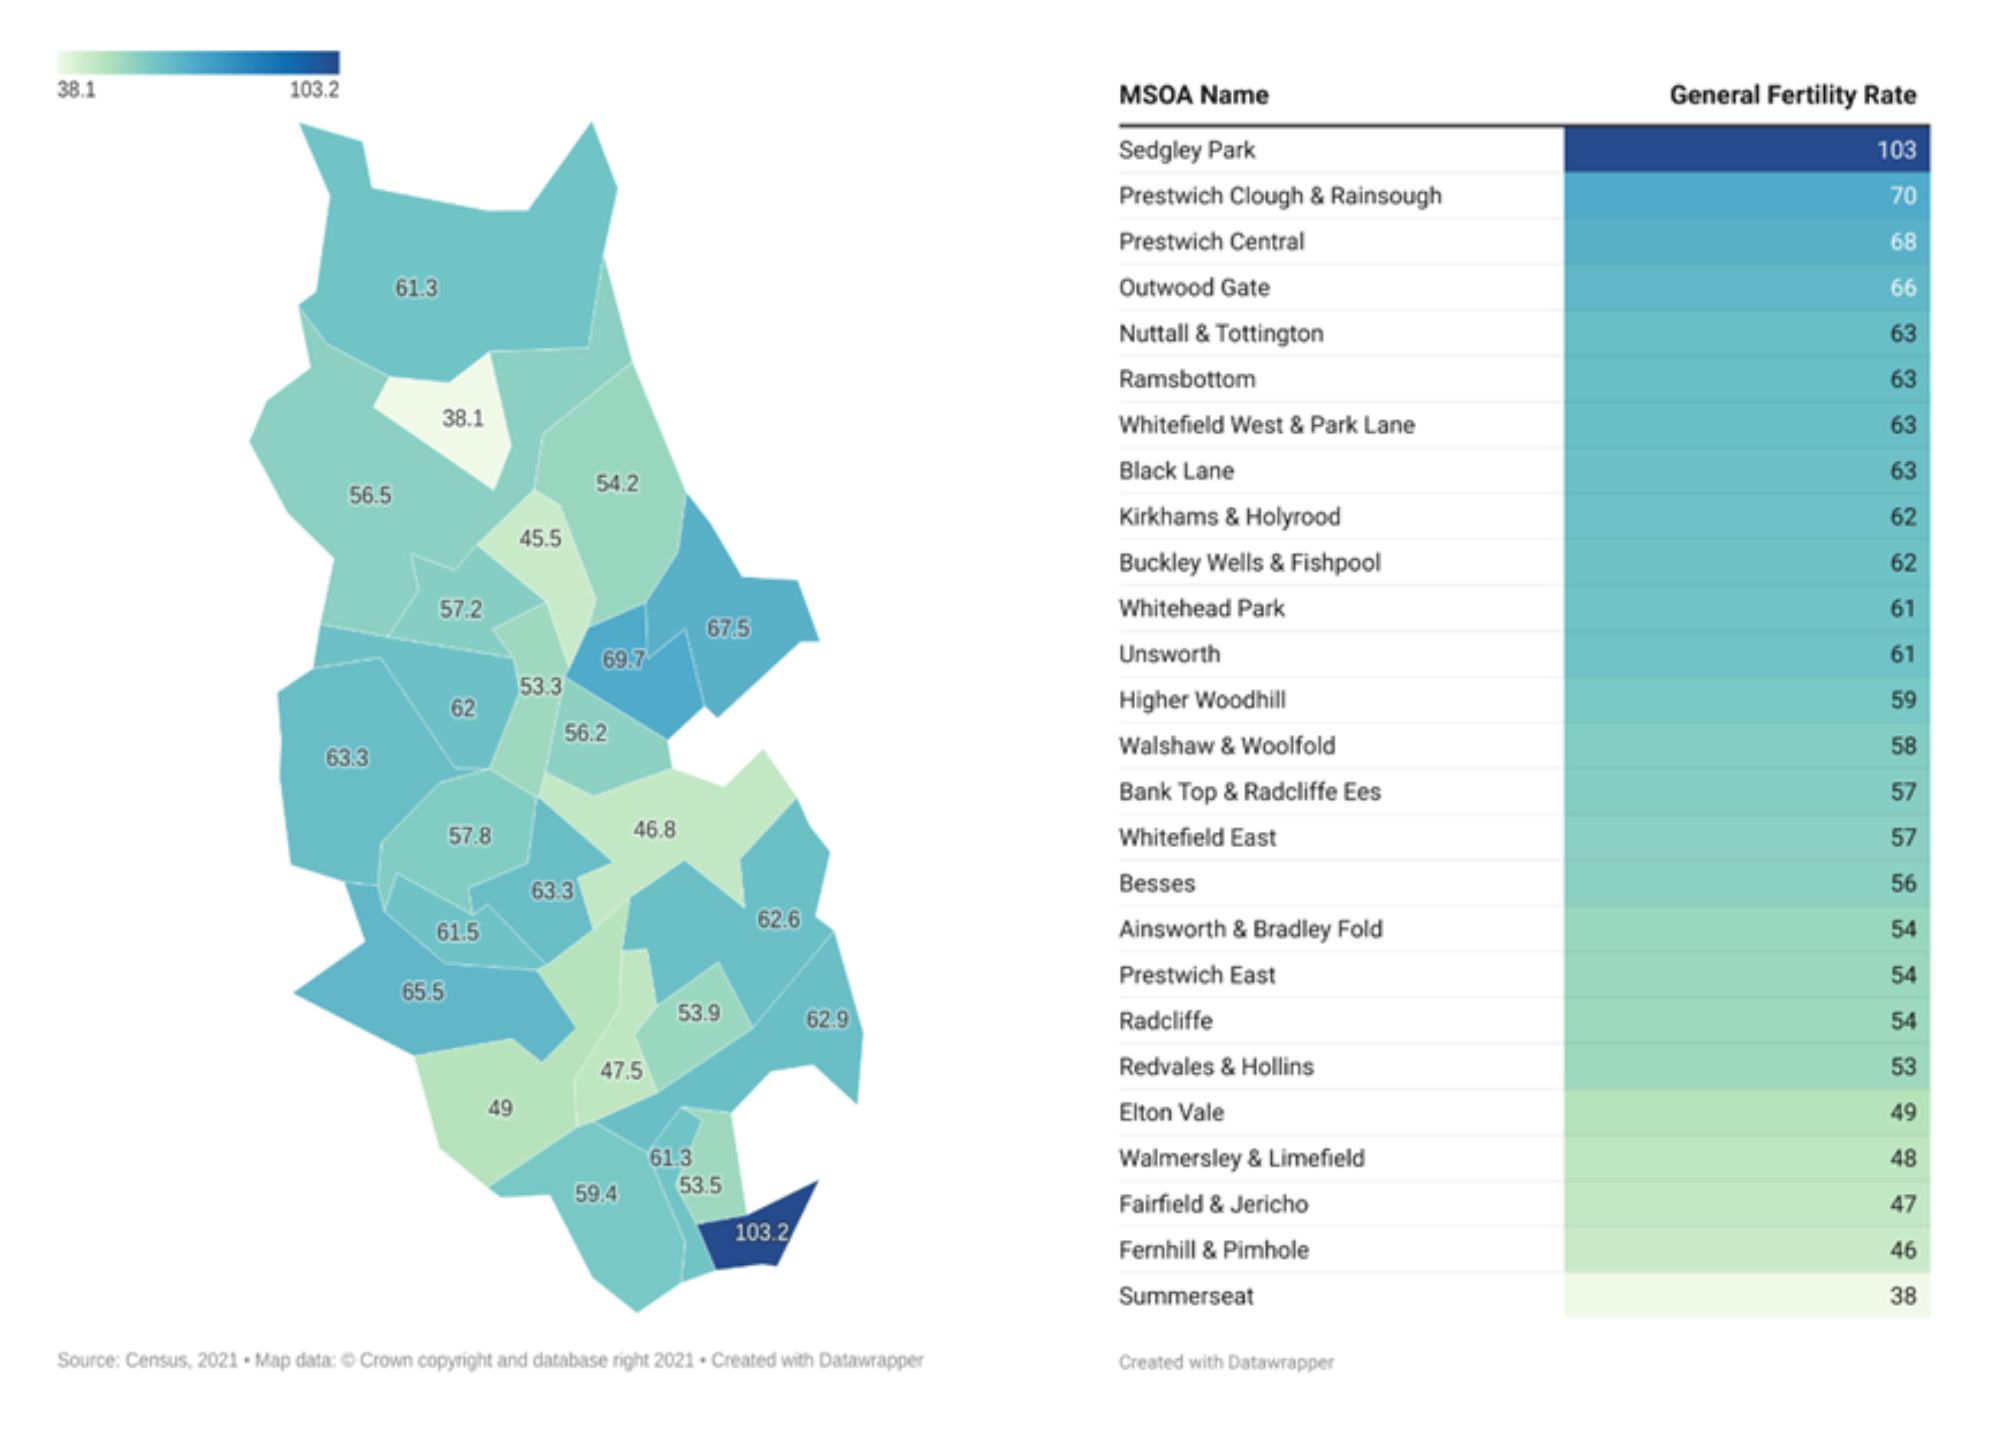
Data on general fertility rates for Middle Super Output Areas (MSOAs) or wards levels were not available for Bury. GFR was calculated for MSOAs based on live births data at usual place of residence from Census 2021 and females aged 15-44 years in the MSOAs from ONS 2020 MSOA data on Sex by single year of age.
The general fertility rates by MSOAs in Bury range from 38.1 in Summerseat to 103.2 in Sedgley Park with average for Bury at 54.3 per 1000 females aged 15-44 years. The areas with the highest fertility rates are Prestwich Clough & Rainsough (69.7), Outwood Gate (65.5), and Sedgley Park (103.2). On the other hand, the areas with the lowest fertility rates are Summerseat (38.1), Fernhill & Pimhole (45.5), and Fairfield & Jericho (46.8).
The outliers in the data, Sedgley Park and Summerseat, could be due to several factors such as differences in socio-economic status, access to healthcare and family planning services, cultural attitudes towards childbearing, and migration patterns. Further research would be necessary to determine the exact causes of these outliers.
There are several factors that can contribute to the variations in fertility rates observed in different areas. These factors have been described earlier in the text.
-
 To download a copy of this diagram, please left click the button below or use the 'Related Files' section located at the bottom of the page.