Deaths
Deaths
Deaths
-
 Deaths: information on mortality indicators from the Office for National Statistics (ONS) and Public Health Profiles
Deaths
This section offers information on mortality indicators from the Office for National Statistics (ONS) and public health profiles to assist local decision-makers in assessing outcomes across a variety of causes of death in Bury.
Mortality statistics in England are based on the details collected when deaths are certified and registered. Statistics on deaths are used by a number of public and private sector organisations such as the UK Health Security Agency (UKHSA) to inform policy decisions, monitor population health or measure progress against goals such as reducing stillbirth (ONS, 2023).
At the local authority level, ONS mortality data can be used in a variety of ways to inform local policies and decision-making. Examples across different functions include the following:
Public health: Identifying the main causes of death in communities and determining the most effective interventions to address them. By examining trends in mortality rates age, sex and causes of death, public health planners can develop targeted interventions and strategies to improve the health of local communities. Additionally, they can monitor health inequalities within their populations and create targeted interventions to reduce them. For instance, using data on cardiovascular disease related deaths in their local population, local authorities can implement targeted public health interventions to reduce smoking rates or increase levels of physical activity.
Adult social care: Identifying vulnerable groups in the community including older adults, individuals with chronic health conditions, or deprived population groups to develop programmes and services that meet the specific needs of these groups.
Environmental Health: Mortality data can be used to identify environmental factors that may be contributing to poor health outcomes in the community. For example, high mortality rates for respiratory diseases may indicate poor air quality in certain areas. This information can be used to prioritise environmental health initiatives and to target resources to the areas that need them most.
Emergency Management: Emergency management teams (EMTs) can use mortality data to examine trends in mortality rates during crisis like natural disasters or disease outbreaks. A recent example of using mortality data is the COVID-19 pandemic. Data on deaths from COVID-19 were the subject of intense scrutiny globally from the outset of the pandemic, and were important in situational awareness, particularly when testing was more limited, and in understanding the severity of disease in different groups.
Please note: At the time of writing OHID updated the mortality profiles based on population from Census 2021 and removed trend data from previous years. Following indicators have been affected: Premature mortality (all causes) and by sex, Premature mortality considered preventable and by sex. OHID will revise the official population estimates for mid-2012 to mid-2020 to incorporate the data now available from Census 2021. As such, some indicators are currently only presenting data for 2021. Once revised populations for mid-2012 to mid-2020 are published, the back series for this indicator will be published. We will update the data in due course once all updates have come in.
Total Deaths:
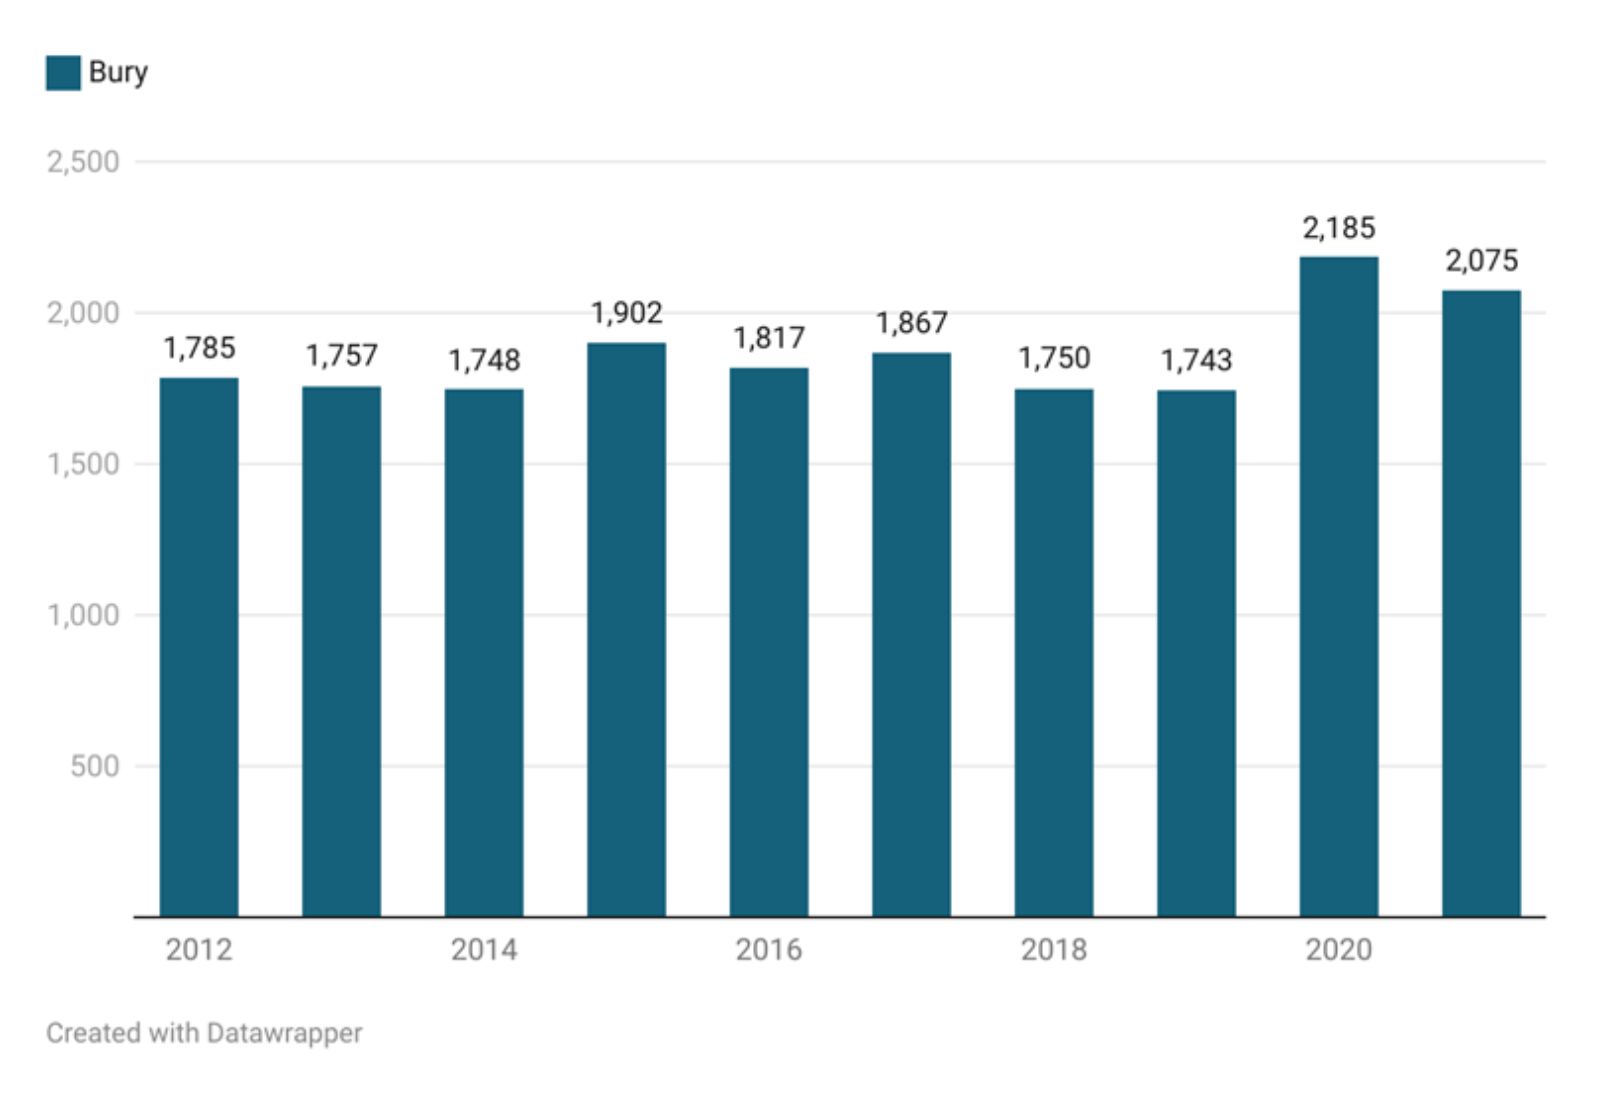
In Bury, there are approximately 1800 deaths annually from all causes and at all ages (the ten-year average from 2012-2021 is 1862 deaths). The number of deaths increased in 2015, 2020 and 2021 in Bury with highest number of deaths (2185) in the year 2020 (Figure 1).
Figure 1: Number of annual deaths from all causes and all ages in Bury for the years 2012 to 2021
-
 To download a copy of this chart, please left click the button below or use the 'Related Files' section located at the bottom of the page.
The number of deaths increase from 45 years and over with a sharper increase after 75 years of age (Figure 2). This can be due to a combination of factors related to aging and increased vulnerability to various health conditions due to age. A number of observations can be made when examining the number of deaths from all causes in all age from the years 2015 to 2021:
There were higher number of deaths in over 75s in 2015. This is likely due to the number of excess winter deaths in 2014/15 due to influenza A(H3N2) that was particularly virulent in elderly people, an already at-risk group, and resulted in numerous care home outbreaks (ONS, 2015).
A spike in the number of deaths was seen in the year 2017 for over 75 years of age. For this year, the number of excess winter deaths in England and Wales were the highest recorded since winter 1975 to 1976 and one third of the deaths were from respiratory disease (ONS, 2018).
Another spike was seen in the year 2020 and 2021 for those aged 75 years and over. The COVID-19 pandemic was largely responsible for the increase in deaths among people over 75 years of age in 2020 and 2021. Age is a significant risk factor for severe outcomes from COVID-19 and compared to people under 40 years old, the chances of dying from COVID-19 are 70 times higher for those aged over 80 and 50 times higher among those aged 70-79. This is likely due to older people being more likely than younger people to have underlying health problems (LGA, 2021).
Figure 2: Number of annual deaths from all causes by age categories in Bury for the years 2015 to 2021
-
.jpg) To download a copy of this chart, please left click the button below or use the 'Related Files' section located at the bottom of the page.
To download a copy of this chart, please left click the button below or use the 'Related Files' section located at the bottom of the page.
Looking across detailed ethnic categories in Bury, 78.2% of the total population in 2021 identified as "English, Welsh, Scottish, Northern Irish or British," indicating a decrease from 85.3% in 2011. This figure is relatively higher than the corresponding national figures, as only 73.5% of the total population in England identified their ethnic group as "White: English, Welsh, Scottish, Northern Irish or British" in 2021, compared with 79.8% in 2011.
Asian, Asian British, or Asian Welsh: Pakistani ethnic category in Bury has risen from 4.9% in 2011 to 7.8% in 2021, making it the second-highest detailed ethnic category in Bury. This number exceeds the corresponding percentage in England, where 2.8% of the population in 2021 (up from 2.1% in 2011), identified as Asian, Asian British, or Asian Welsh: Pakistani. It is noteworthy that Bury differs from England's second-highest detailed ethnic category, "White: Other White," which saw a population increase from 4.6% in 2011 to 6.3% in 2021 (Table 2)
Infant mortality
Infant mortality is an indicator of the general health of population reflecting both the availability and quality of healthcare services as well as broader social and economic and environmental factors. It is measured as number of deaths of infants under one year of age per 1,000 live births. Infant mortality rate can be split by neonatal deaths (under 28 days) and post-neonatal deaths (between 28 days and 1 year). Over the past 40 years, infant mortality rates have significantly declined across the UK countries. However, compared to other European countries, development has slowed over the past twenty years.
Some infant deaths can be prevented by targeting interventions to reduce the modifiable risk factors that occur in around a third of infant deaths. These factors have a multiplier effect where greater number of these factors can make the infant more vulnerable. The most common modifiable risk factors are smoking in pregnancy, obesity in pregnancy and household smoking. In addition to these, there are protective factors that can reduce infant mortality and include vaccinations (including flu vaccination for pregnant women), breastfeeding, and safe-sleeping practices.
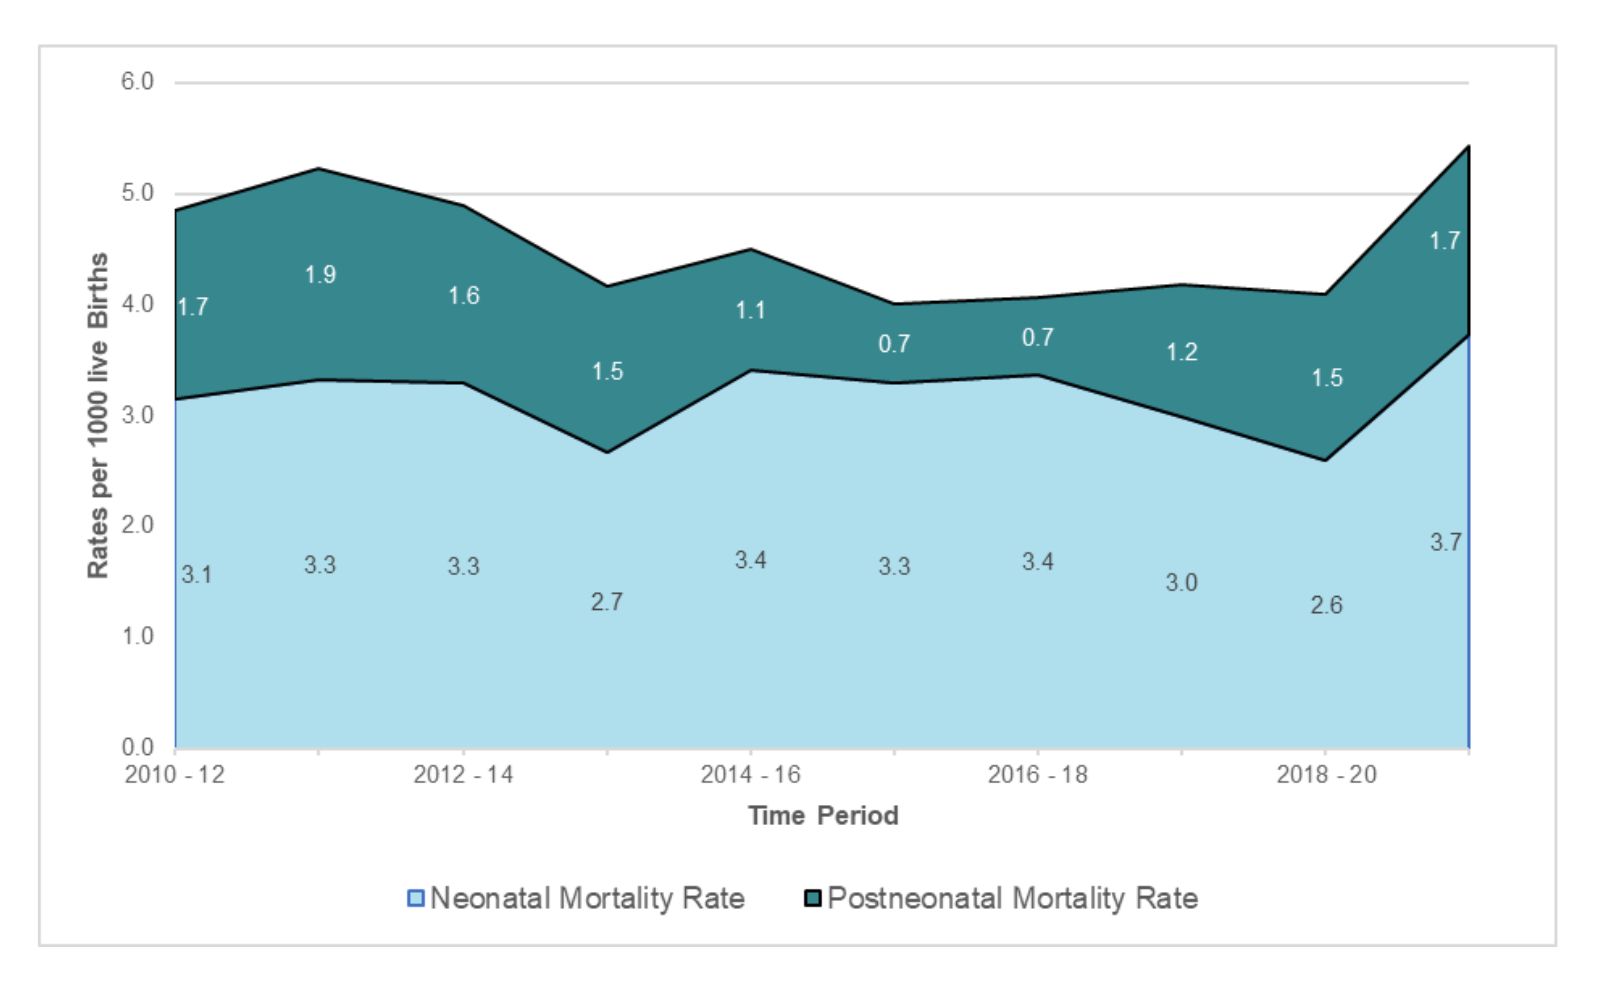
The infant mortality rate for Bury is 4.1 per 1000 live births and is statistically similar to England average of 3.9 per 1000 live births (Child and Maternal Health Profile, 2020). Neonatal mortality (deaths under 28 days per 1000 live births) is 3.7 for Bury somewhat higher England average of 2.8 per 1000 live births (Child and Maternal Health Profile, 2021), but due to the small numbers of deaths involved, this could be caused by normal year-to-year fluctuations rather than some underlying problem. Likewise, post neonatal mortality rate for Bury is 1.7 per 1000 live births is higher than to England average of 1.1 (Child and Maternal Health Profile, 2021) but again this could be due to random year-to-year fluctuations. Figure 3 below presents the trend in infant mortality by neonatal and post-neonatal mortality in Bury and we can see that deaths under 28 days make the highest contribution to the infant mortality rates in Bury.
Figure 3: Trend in infant mortality by neonatal and post-neonatal mortality in Bury from the period 2010-12 to 2018-20
-
 To download a copy of this chart, please left click the button below or use the 'Related Files' section located at the bottom of the page.
There is currently no national target for the infant mortality rate in England but the government has a national ambition in England to achieve 50% reductions in neonatal mortality by 2025. The lack of data at local level means it is not possible to examine inequalities with the exception of sex for neonatal mortality but data for England suggests local inequalities by deprivation and ethnicity, where deprived areas, black ethnic groups and Asian ethnic groups see higher infant mortality rates (Nuffield Trust, 2022). Data for Bury by sex suggests higher neonatal mortality rates for males (4.5 per 1000 live births) compared with females. Although neonatal mortality is generally 20% higher in boys than girls due to biological phenomena, research suggests that socioeconomic factors such as income and education are associated with these differences in neonatal mortality rates between males and females (Kramer et al, 2002).
Premature mortality (Deaths under 75 years of age):
Premature mortality or deaths under 75 years of age are measured using the directly age-standardised mortality rate (DASMR), which is typically reported separately for males and females. This measure corrects for variations in age distribution between populations. The DASMR for all under-75-year-old deaths offers a way to compare mortality rates across populations while taking age structure differences into account. This is crucial because premature mortality, or deaths that take place before the age of 75, can be a key sign of a population's general health. Public health officials and policymakers can pinpoint areas where interventions may be required to improve health outcomes and decrease premature mortality by monitoring changes in DASMR over time and across different population groups. These rates are usually calculated as three-year rolling rates to account for random fluctuations in mortality rates due to small sample sizes or short-term events such as disease outbreaks.
Premature mortality from all causes in Bury has been falling from 489.5 per 100,000 population in 2001-2003 to 382.6 per 100,000 population in 2018-2020. Similar decline has been seen in England where the rates declined from 452.2 per 100,000 population in 2001-2003 to 336.5 per 100,000 population. This constant downward trend in mortality rates continued for both Bury and England until 2018-2020, where the rates rose slightly. This rise is likely due to the impact of COVID-19. During this time period, premature mortality rates in Bury have continued to remain above (statistically significant) the average for England (Figure 4). Premature mortality from specific causes will be discussed later in the section.
Figure 4: Under 75 mortality rates from all causes (Persons, 3 year range expressed per 100,000 population) for Bury and England from the period 2001-2003 to 2018-2020
-
-for-Bury-and-England-from-the-period-2001-2003-to-2018-2020--(1).jpg) To download a copy of this chart, please left click the button below or use the 'Related Files' section located at the bottom of the page.
To download a copy of this chart, please left click the button below or use the 'Related Files' section located at the bottom of the page.
Inequalities
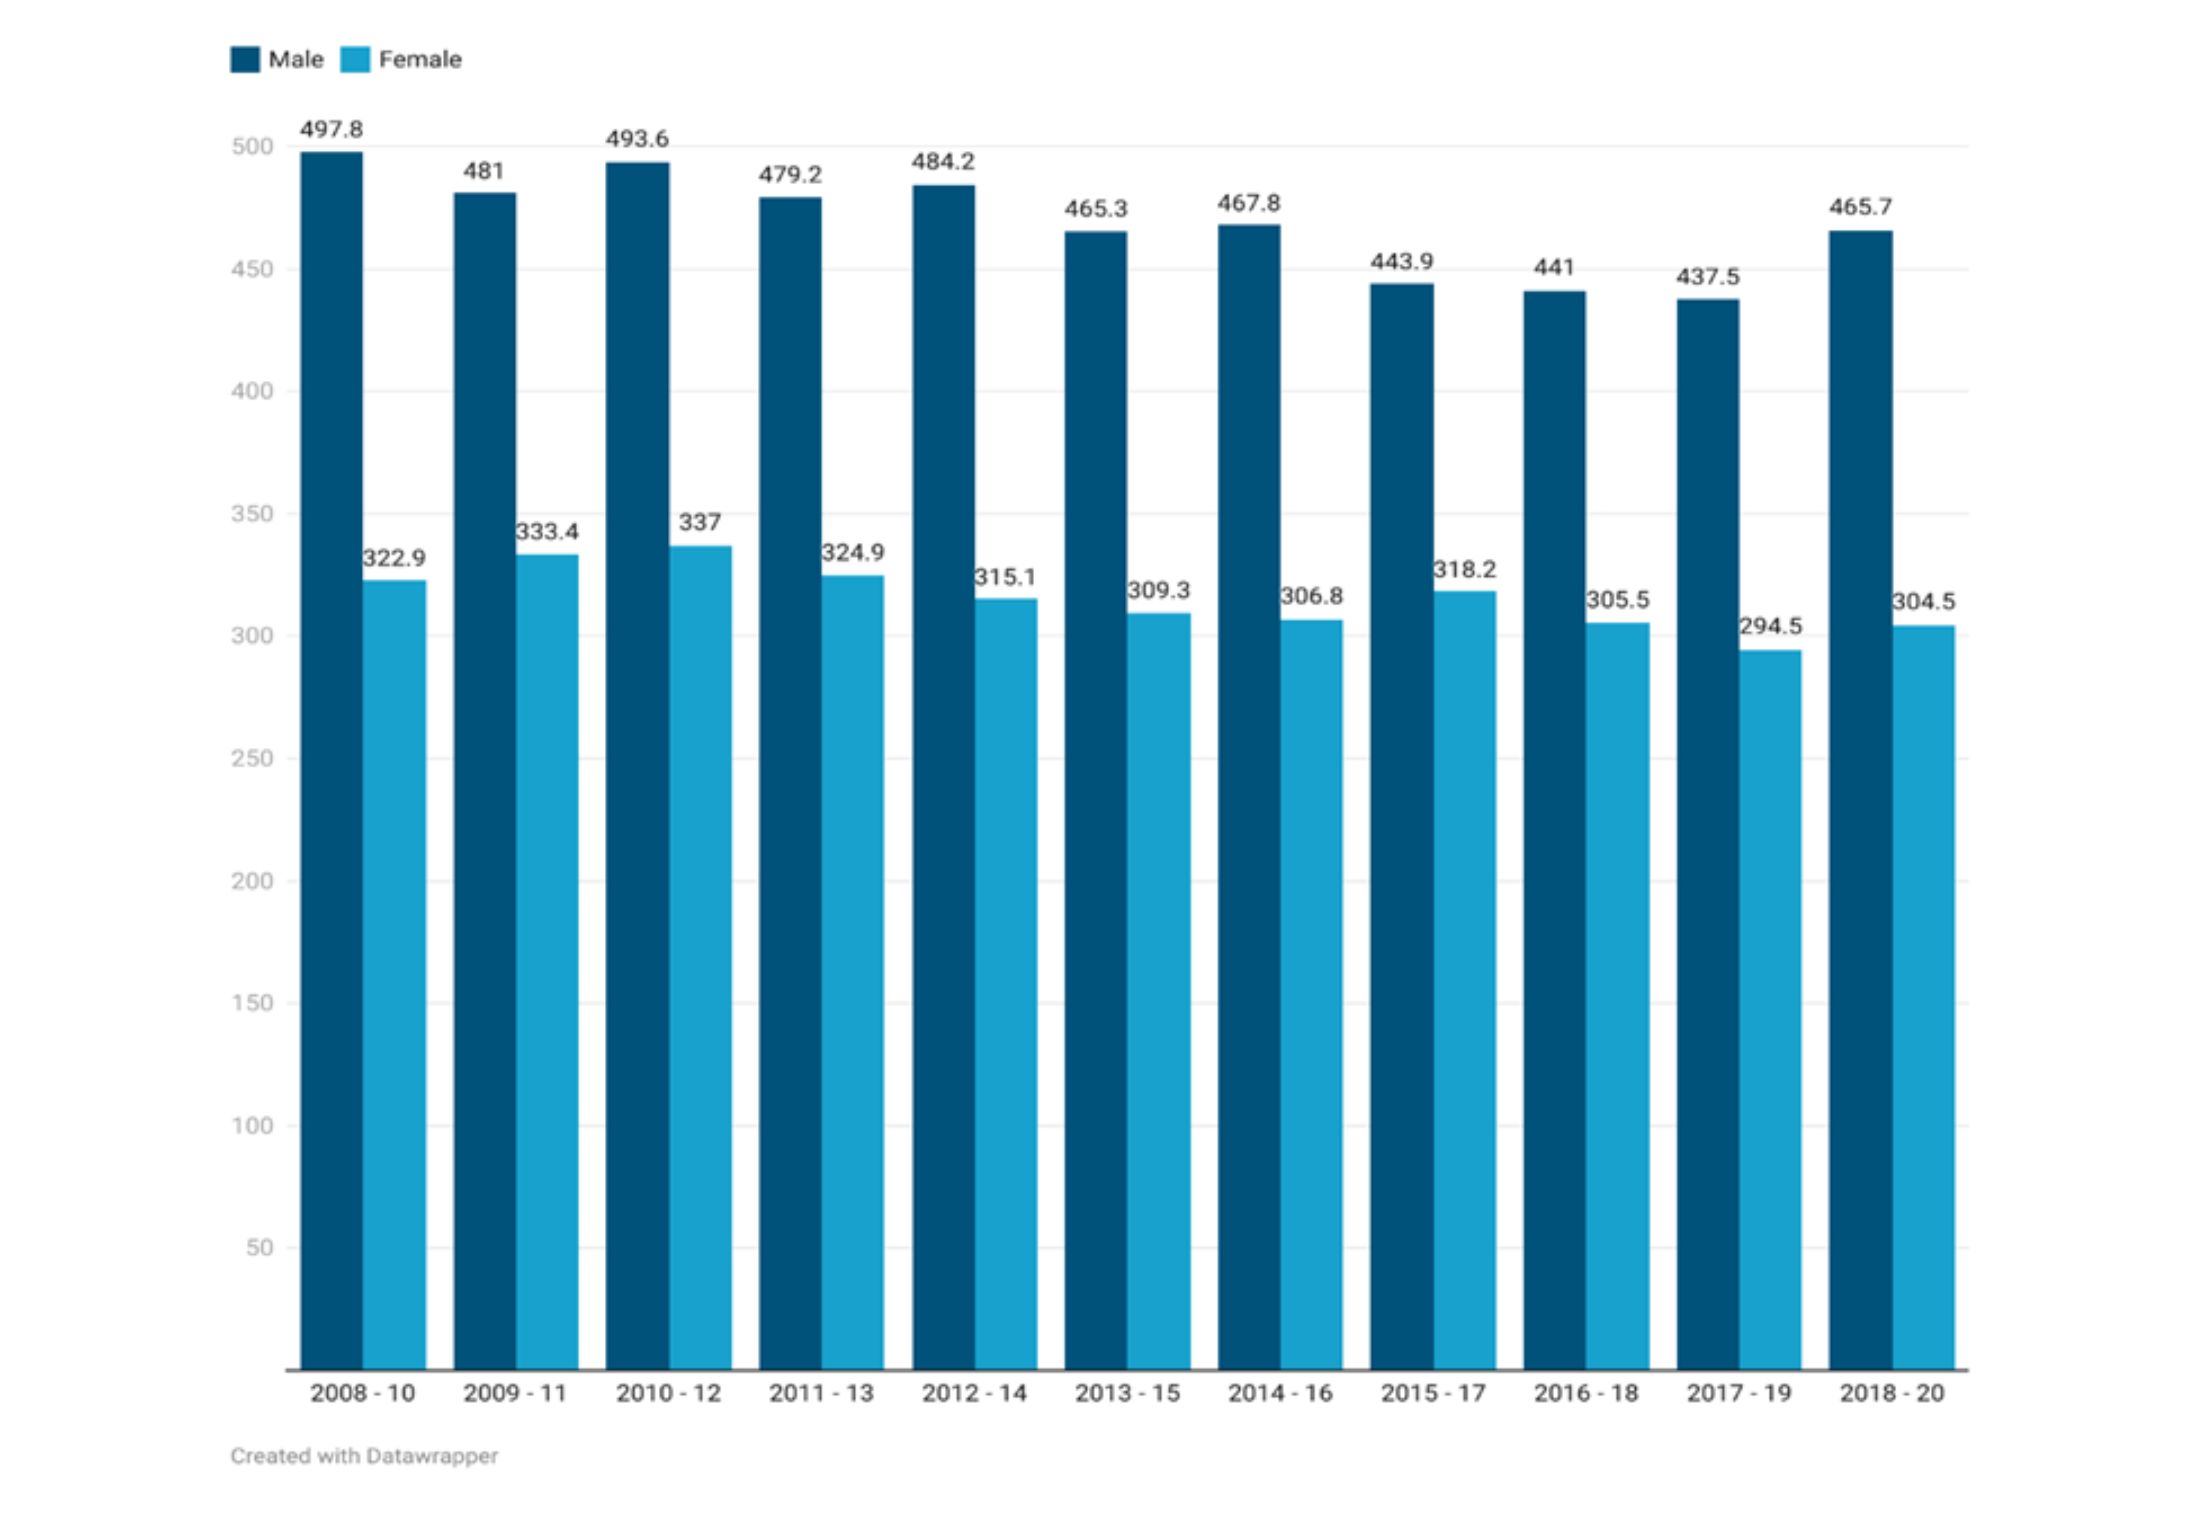
We lack the necessary data at local levels to examine inequalities apart from inequalities by sex. Premature mortality rates from all causes remained higher for males compared with females. The rates decreased for males under 75 from 497.8 in 2001–2003 to 465.7 in 2018–2020, and for female it decreased from 322.9 to 304.5 during the same time period. There was a slight increase in both male and female premature mortality rates from 2016-18 to 2018-20. Overall, the trend shows a decreasing premature mortality rate from all causes for males, whereas the decline in premature mortality rate for females has been minimal.
Premature mortality rates from all causes for England followed a similar overall pattern with decline in rates for males from 455.1 in 2008-10 to 411.7 in 2018-2020, and for females the rates declined from 290.6 in 2008-2010 to 264.8 in 2018-2020 (Figure 5). Compared to the average for England, the rates in Bury remained above the average (statistically significant) for males and females throughout the observed time period.
Figure 5: Under 75 mortality rates for male from all causes for Males and females (3 years range expressed per 100,000 population) for Bury from the period 2001-2003 to 2018-2020
-
 To download a copy of this chart, please left click the button below or use the 'Related Files' section located at the bottom of the page.
Data by deprivation levels for premature mortality rates are not available at Bury level. However, data for England shows increasing rates of premature mortality as the levels of deprivation increases. The rate of premature mortality is almost twice as high (509.6 per 100,000 population) in the most deprived areas of England compared to the least deprived areas (275.3 per 100,000 population).
Premature mortality (Deaths under 75 years of age) from causes considered preventable
Public health frameworks define preventable deaths under 75 years of age that could have been avoided through timely and effective public health interventions. These include a wide range of causes of death such as suicide and self-inflicted injuries and homicide/assault; ischaemic heart disease (IHD), some cancers, alcohol related diseases, illicit drug use disorders. The Public Health Outcomes Framework (PHOF) presents premature mortality rates for all cause (preventable), cancer, cardiovascular disease, liver disease and respiratory disease. Deaths from all cause considered preventable will be discussed below and for the specific causes in the later sections.
Figure 6 presents age standardised under 75 mortality rates from causes considered preventable (2019 definition) (Persons, 3 year range) from 2001-2003 to 2017-19 for Bury and England. The rates are presented per 100,000 population. Bury has seen a decline in preventable deaths rates from 2001-03 to 2017-19, however the rates in Bury have continued to remain above England’s average throughout this time period. England has seen a steady decline from 192.3 per 100,000 population in 2001-03 to 142.2 per 100,000 in 2017-19. Examining the trend in Bury, the death rates in Bury declined from 221.6 per 100,000 population in 2001-03 to 183 in 2007-09, and remained relatively stable until 2014-16, where the rates were 180.8, followed by a sharp decline to 159.4 in 2017-19. The gap between the premature preventable deaths between England was highest in 2014-2016 (difference of 34.1) and lowest in 2017-19 (gap of 17.2).
Figure 6: Age standardised under 75 mortality rates from causes considered preventable (2019 definition) (Persons, 3 year range) from 2001-2003 to 2017-19 for Bury and England
-
-(Persons,-3-year-range)-from-2001-2003-to-2017-19-for-Bury-and-England--(1).jpg) To download a copy of this chart, please left click the button below or use the 'Related Files' section located at the bottom of the page.
To download a copy of this chart, please left click the button below or use the 'Related Files' section located at the bottom of the page.
Inequalities
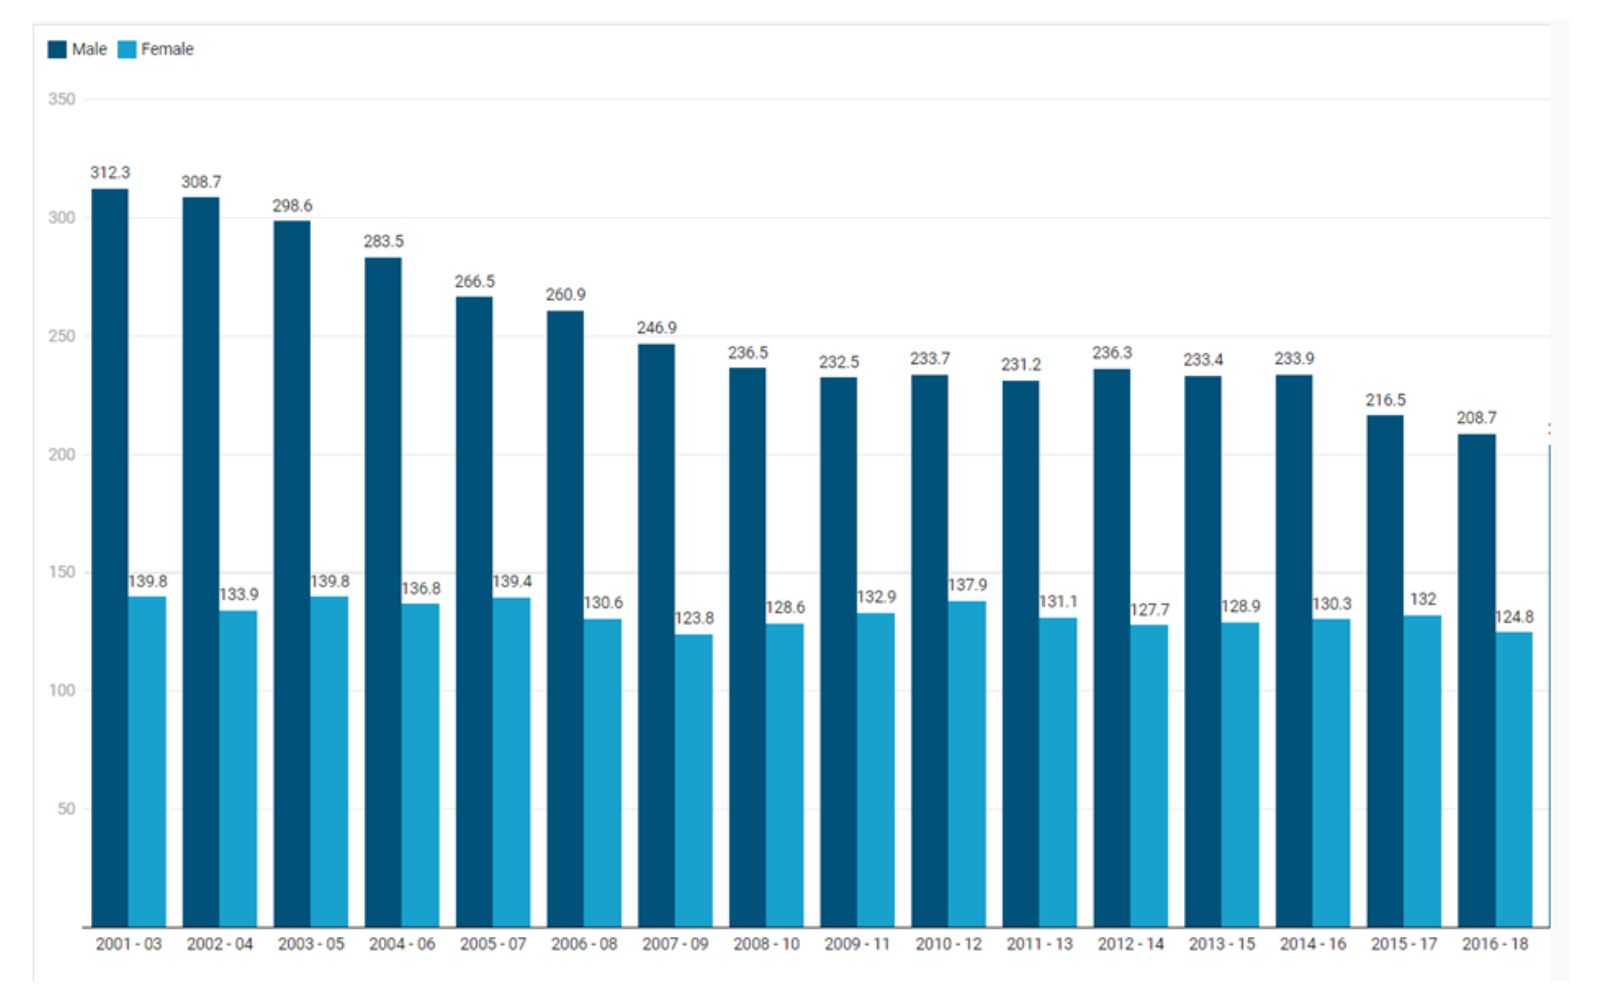
Data on inequalities at the local level are available by sex only. Age standardised under 75 mortality rates from causes considered preventable remained higher for males compared with females throughout the period 2001-03 to 2017-19. The rates have been decreasing over the years for both males and females. The decrease in rates are higher for males compared with females, with rates for males decreasing from 312.3 in 2001–03 to 204.3 in 2017–19, and for females from 139.8 to 124.8 during the same time period. There appears to be a slight increase in the rates for both males and females between 2009-11 and 2010-12, but this is followed by a decline in subsequent years.
Premature preventable mortality rates for England followed a similar overall pattern with decline in rates for males from 266.8 in 2001-03 to 188.6 in 2017-19, and for females the rates declined from 123.2 in 2001-03 to 97.9 in 2017–19 (Figure 4).Compared to the average for England, the rates in Bury remained above the average (statistically significant) for females throughout the observed time period and for males the rates remained above England average from 2001-03 to 2015-17 and then were statistically similar to England average in the most recent time periods. Data at both England and Bury level suggests minimal improvement in the premature death rates from preventable causes for females.
Figure 7: Age standardised under 75 mortality rates from causes considered preventable for males and females (3 years range expressed per 100,000 population) for Bury from the period 2001-2003 to 2018-2020
-
 To download a copy of this chart, please left click the button below or use the 'Related Files' section located at the bottom of the page.
Data by deprivation levels for under 75 mortality rates from causes considered preventable are not available at Bury level. However, data for England shows increasing rates of premature mortality from causes considered preventable as the levels of deprivation increase. The mortality rate is almost twice as high (274.4 per 100,000 population) in the most deprived areas of England compared to the least deprived areas (128.8 per 100,000 population).
Leading causes of death
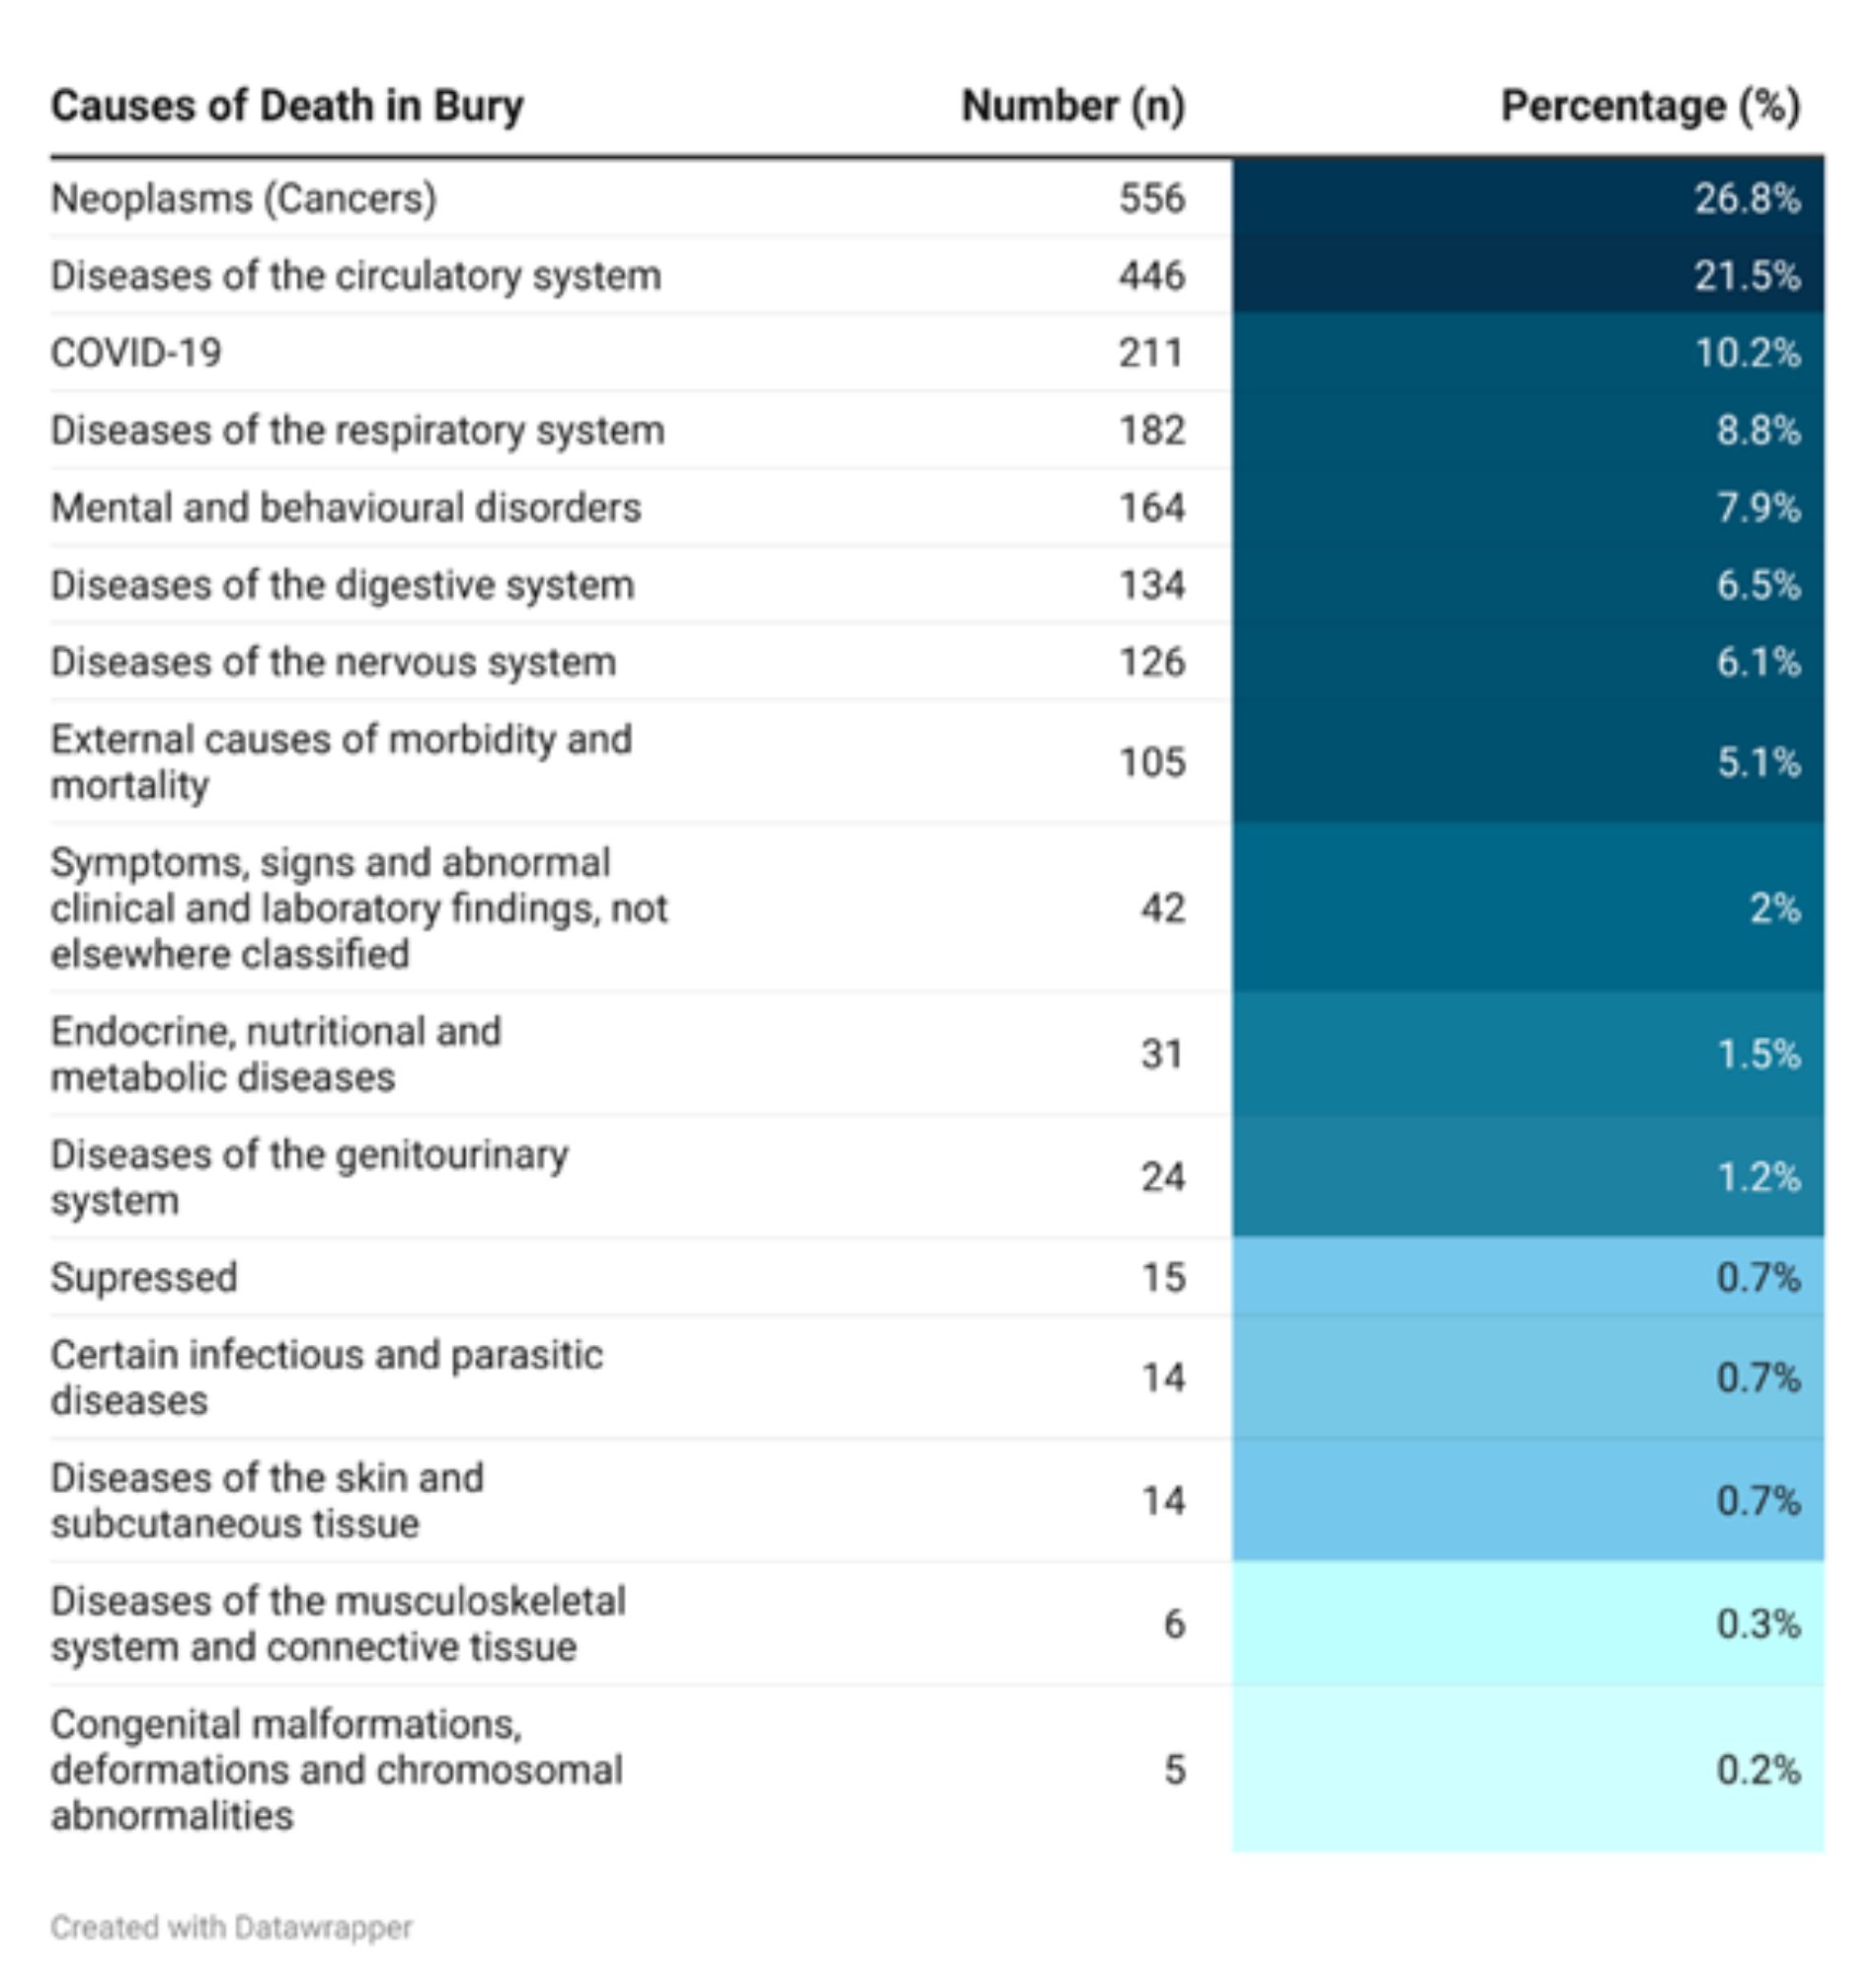
There were 2071 deaths in Bury in the year 2021. The three leading causes of mortality across all ages in Bury for the year 2021 are cancers, cardiovascular diseases and COVID-19. This is a change from previous years prior to the pandemic where cancers, cardiovascular diseases and respiratory diseases have been the three leading causes of deaths in Bury. In the year 2021, Cancer was the main cause of death accounting for 26.8% of the total deaths. Circulatory system disorders like heart disease and stroke were the second most common cause of death, accounting for 21.5% of the total deaths. By accounting for 10.2% of deaths in Bury, COVID-19 was the third most common cause of death. COVID-19 has significantly increased mortality across the globe and although COVID-19 is the third leading cause of mortality in Bury, it is important to note that since the data was last updated, the numbers may have changed, and other causes of mortality may have become more or less significant. Table 1 below presents the number and percentage of deaths in 2021 by causes based on ICD-10 classification (ONS, 2021). 15 causes of deaths were supressed due to small numbers.
Table 1: Number and percentage of deaths in 2021 by causes based on ICD-10 classification in Bury
-
 To download a copy of this table, please left click the button below or use the 'Related Files' section located at the bottom of the page.
Leading causes of death by Sex
Figure 6 below presents the leading cause of mortality for males aged 40 years and over in Bury for each year from 2013 to 2021 (ONS, 2021). There are several trends that can be observed from the data below. Neoplasms are the most common cause of death for men in all age groups followed by circulatory diseases (primarily Ischaemic heart diseases). Please note, due to small numbers in younger age group specific causes of mortality cannot be presented. External causes of morbidity and mortality (such as accidents and intentional injuries) are the leading cause of mortality for males aged 40-44 and 45-49 across majority of the years. Neoplasms (cancer) are the leading cause of mortality for males aged 50 and over for most years until 80-84 years. The most common cancers across these age groups contributing to mortality are lung and bowel cancers. Circulatory diseases, specifically ischaemic heart diseases, are the primary cause of death for most years in males aged 85 to 89, and respiratory and circulatory diseases are the primary causes of death for most years in people aged 90 and over. COVID-19 emerged as a leading cause of mortality for males aged 80-89 years in 2020. This highlights the impact of the COVID-19 pandemic on mortality rates in vulnerable population groups.
Figure 8: Leading cause of mortality for males aged 40 years and over by five-year age bands in Bury from the year 2013 to 2021
-
 To download a copy of this table, please left click the button below or use the 'Related Files' section located at the bottom of the page.
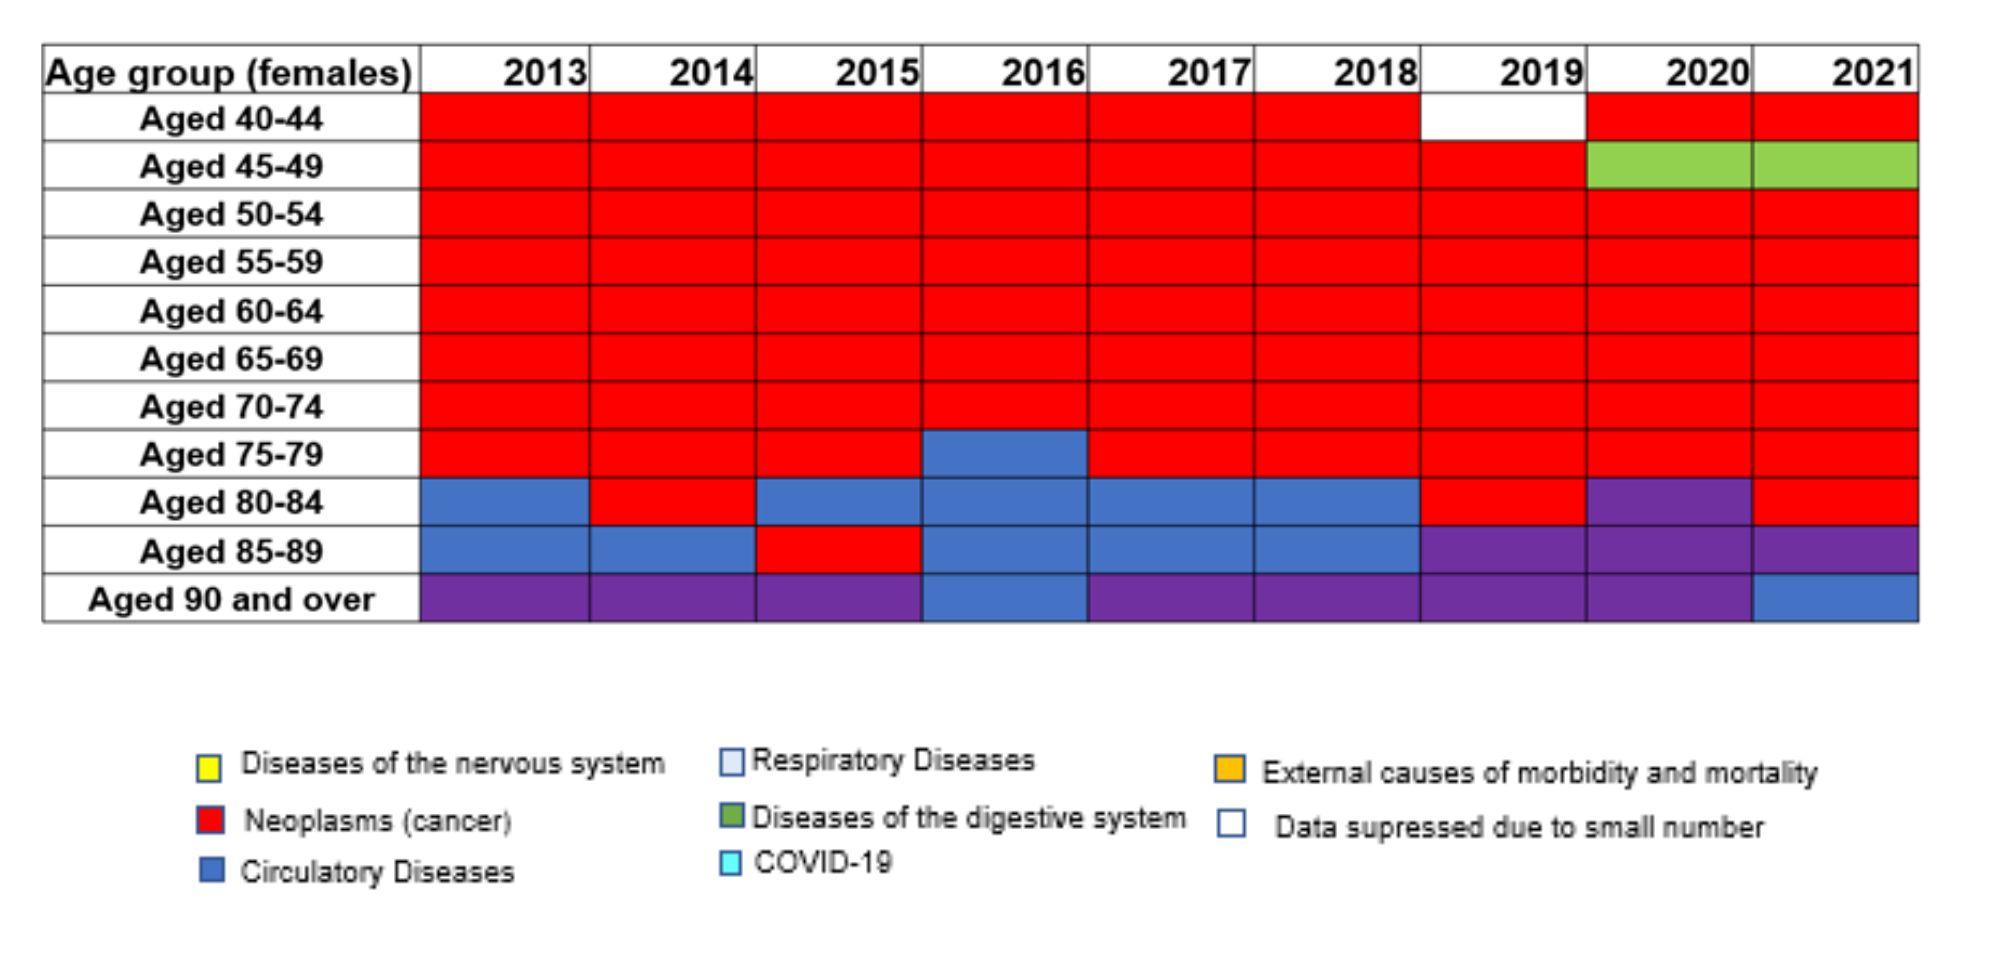
Examining the data for females in Bury (Figure 7), except for the 40–45 years age group in 2019 and 2020, where digestive system diseases were the leading cause, and the 75–79 years age group in 2016, where circulatory diseases were the leading cause, cancers are consistently the leading cause of mortality for females aged 40–80 years. The most common cancers across these age groups are lungs, bowel and breast cancers.
Mental and behavioural disorders are a significant cause of mortality in females aged 85 and over, becoming the leading cause of mortality in the 85-89 years age group from 2019-2021 and the leading cause of mortality in the 90 and over age group. For females aged 85-89 years, mental and behavioural disorders (dementia) have replaced circulatory diseases as the leading cause of death.
Figure 9: Leading cause of mortality for females aged 40 years and over by five-year age bands in Bury from the year 2013 to 2021
-
.jpg) To download a copy of this table, please left click the button below or use the 'Related Files' section located at the bottom of the page.
To download a copy of this table, please left click the button below or use the 'Related Files' section located at the bottom of the page.
Mortality - Behavioural risk factors
In this section, we will present publicly available data on mortality rates from smoking and alcohol.
Alcohol:
Alcohol use is a significant public health issue in England and is closely related to mortality rates. Excessive alcohol use can result in a variety of health issues, such as liver disease, cancer, and heart disease, all of which can lead to premature deaths. Alcohol and mortality have a complex relationship that is largely influenced by the amount and frequency of alcohol consumption, a person's age and health status, and the presence of additional risk factors like smoking and obesity (OHID, 2021). Studies have shown that even moderate alcohol use can increase the risk of developing certain diseases like liver disease and some types of cancer including liver, bowel and breast cancers. However, higher consumption levels significantly increase the risk, especially for heavy drinkers (Oxford Population Health, 2022).
Alcohol misuse is estimated to cost the NHS about £3.5 billion per year and the impact on the society is even higher at £21 billion annually (Home office, 2012). The government has set out the alcohol strategy to reducing the harmful use of alcohol and the data presented below will support the strategy by presenting data to promote measurable, evidence-based prevention activities at a local level.
Alcohol-related mortality:
Alcohol related mortality is defined as deaths from conditions which are wholly or partially caused by alcohol (OHID, 2022). Fingertips has recently introduced a new indicator to measure alcohol-related mortality. Data from 2021 suggests that Deaths from alcohol-related conditions, all ages, directly age-standardised rate per 100,000 population in Bury (49.7 per 100,000 population) are higher than England average (38.5 per 100,000 population). Since only data for the year 2021 are available, trends cannot be presented.
Data on inequalities in the alcohol-related mortality rates in Bury are only available by sex, where alcohol-related mortality is over twice as high in males (73.2 per 100,000) compared with females (29.3 per 100,000) in Bury. Compared with England, alcohol related mortality for both males and females are similar to England averages of 58.3 per 100,000 for males and 21.3 per 100,000 for females. Data by deprivation are available for England only and shows a deprivation gradient where individuals in the most deprived decile (50.5 per 100,000) have almost twice as high rates compared with the least deprived decile (30.4 per 100,000).
Alcohol-specific mortality:
Alcohol-specific mortality is defined as deaths from conditions wholly caused by alcohol. This definition is also used by the Office of National Statistics in their annual UK data release. Alcohol-specific mortality (3 year range) for Bury in 2017-19 (12.9 per 100,000 population) is similar to England average (10.9 per 100,000) during the same time period. Examining trends for England and Bury, Alcohol-specific mortality rates have remained relatively stable for England with mortality rates remaining 10.9 per 100,000 in the period 2006-2008 and 2017-2019. The alcohol-specific mortality rates in Bury have fluctuated over the years (Figure 10). The rates were similar to England average and remained relatively stable between 2006-08 and 2009-11, ranging from 12.7 to 12.2 per 100,000 population. There was a noticeable increase in alcohol-specific mortality rates in Bury between 2010-12 to 2014-16, with the highest rate of 18.9 per 100,000 population in 2014-16. The rates remained higher than England average during this time period. This was followed by a decline from 17.3 per 100,000 in 2015-17 to 12.9 per 100,000 in 2017-19.
Figure 10: Directly-standardised Alcohol-specific mortality rates (3 year range) from 2006-08 to 2017-19 for Bury and England
-
-from-2006-08-to-2017-19-for-Bury-and-England-.jpg) To download a copy of this chart, please left click the button below or use the 'Related Files' section located at the bottom of the page.
To download a copy of this chart, please left click the button below or use the 'Related Files' section located at the bottom of the page.
Data on inequalities in the alcohol-specific mortality rates in Bury are only available by sex, where alcohol-specific mortality is over twice as high in males (17.8 per 100,000) compared with females (8.4 per 100,000). Data by deprivation are available for England only and shows a deprivation gradient where individuals in the most deprived decile (16.3 per 100,000) have over twice as high mortality rates compared with the least deprived decile (7.4 per 100,000).
Smoking:
Smoking is a major cause of preventable illnesses and premature deaths in the UK. Smoking can lead to a wide range of disease including lung cancer, chronic obstructive pulmonary disease (COPD), heart disease, stroke, and many other serious health conditions. In addition to impact on an individual, smoking has significant economic implications. The cost of treating smoking-related illnesses, as well as productivity loss from smoking-related illnesses and premature death, is estimated to £17.04 billion annually (ASH, 2022).
Smoking has a significant impact on the inequalities as smoking rates in the UK are higher in deprived population groups, who are already more likely to experience poor health outcomes.
Smoking attributable mortality:
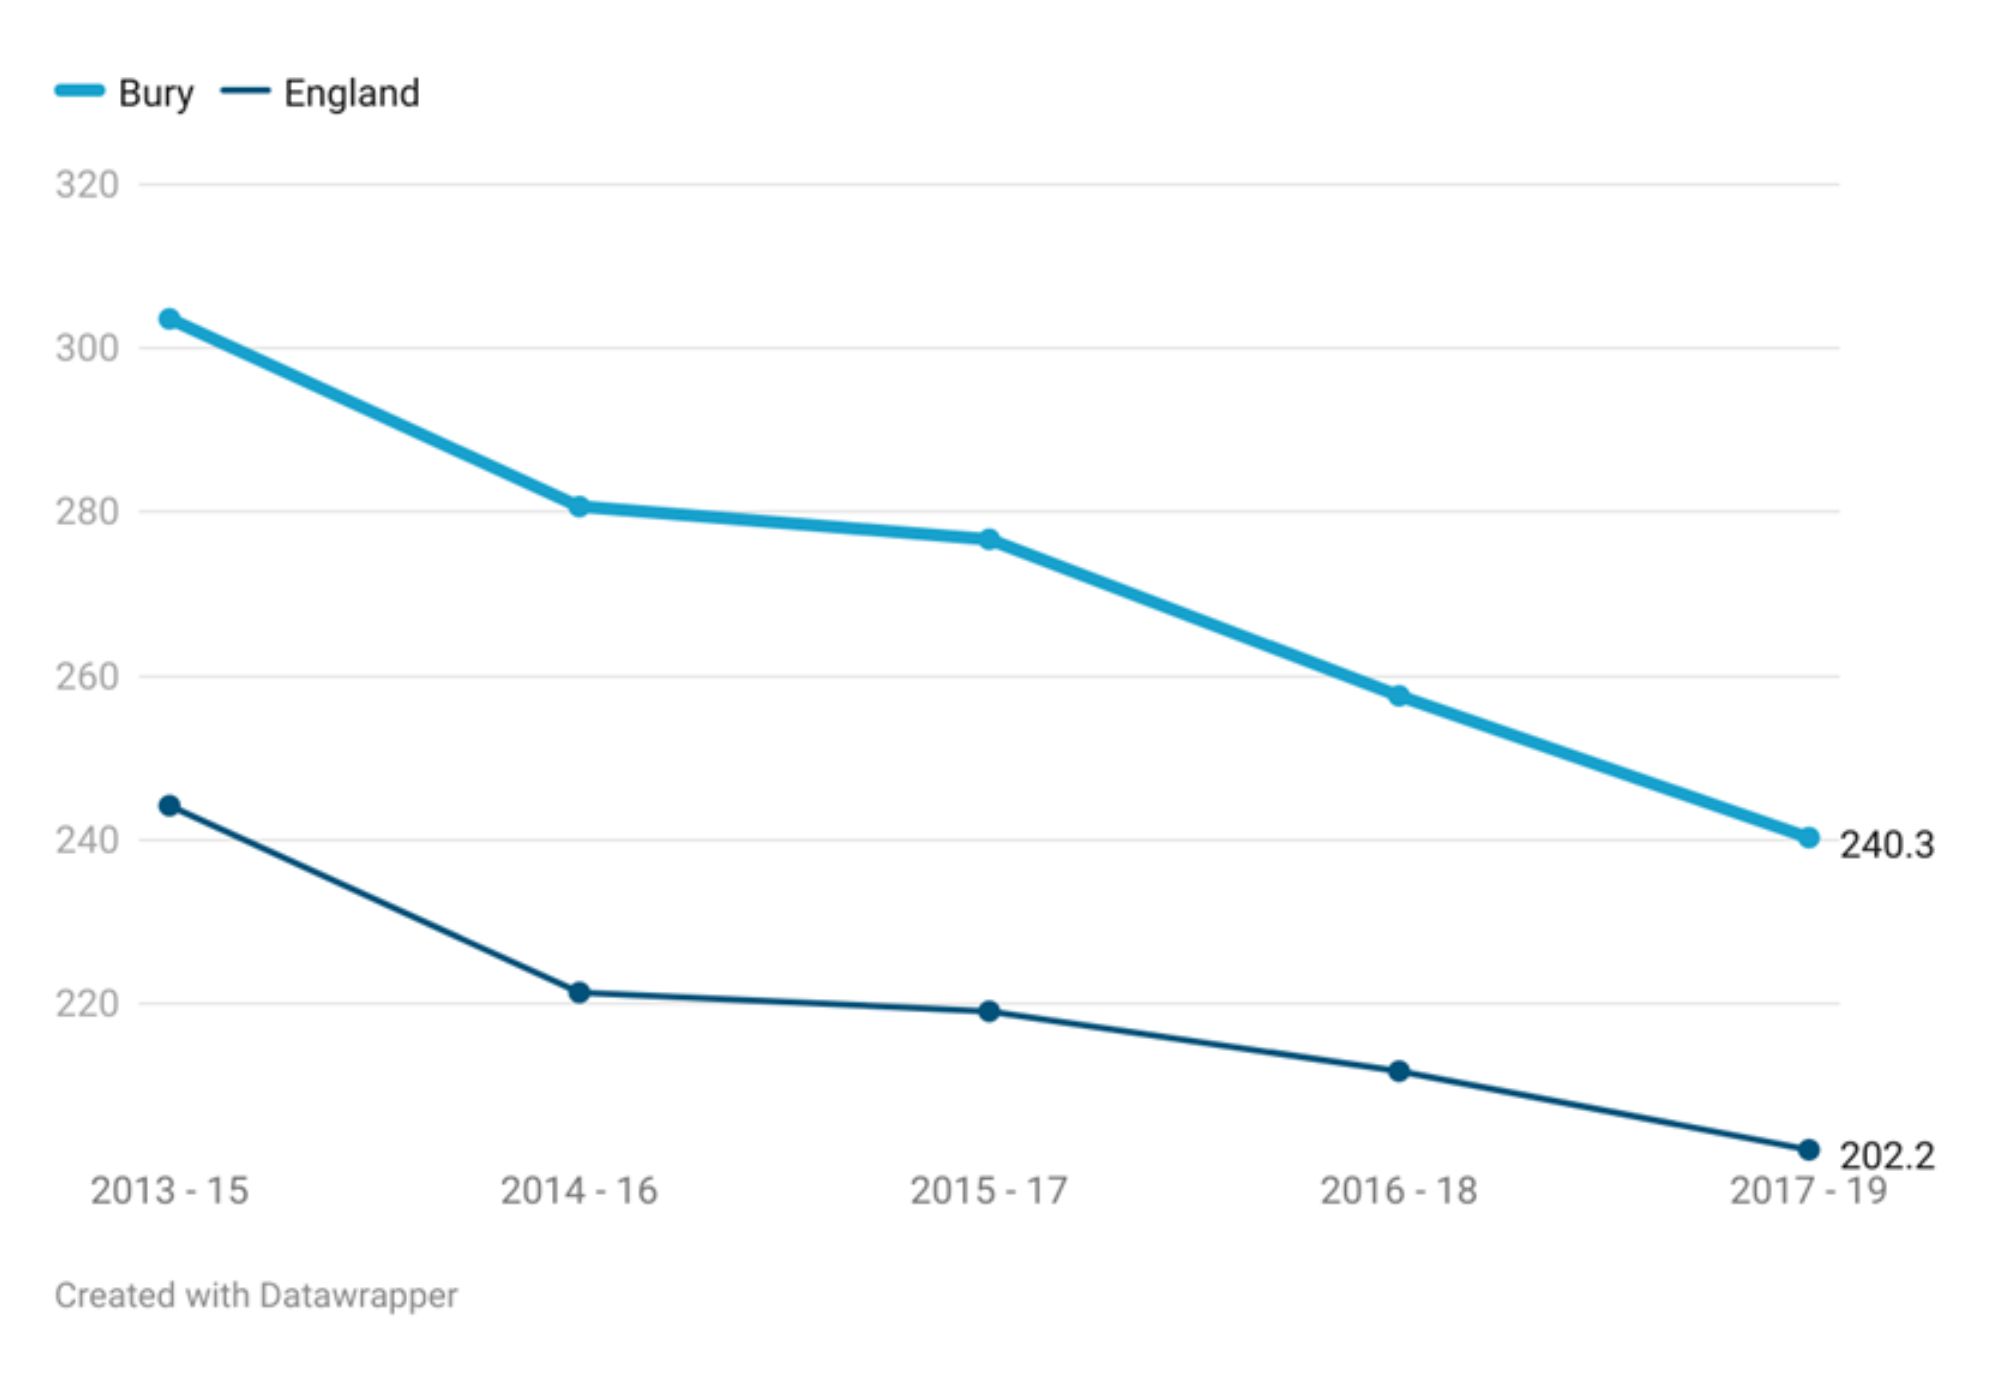
Smoking attributable mortality is defined as the number of deaths in a population that are caused by smoking and presented as directly age standardised rate for persons aged 35 years and over. Smoking attributable mortality rate for Bury in 2017-19 is 240.3 per 100,000 population, higher than England average of 202.2 per 100,000 during the same time period. The overall trend suggests a decline in smoking attributable mortality rates for both Bury and England, however the rates in Bury have remained higher than the average for England between the period 2013-15 to 2017-19.
Smoking attributable mortality rates in Bury have declined from 303.6 per 100,000 in 2013-15 to 240.3 per 100,000 population in 2017-19. Similar decline was seen in England, where the rates declined from 244.2 per 100,000 in 2013-15 to 202.2 per 100,000 in 2017-19 (Figure 11).
Figure 11: Directly age-standardised smoking attributable mortality rates for Bury and England from 2013-15 to 2017-19
-
 To download a copy of this chart, please left click the button below or use the 'Related Files' section located at the bottom of the page.
There is a lack of local data on inequalities in Smoking attributable mortality rates, with data available only by deprivation at England level. The data on deprivation a gradient by deprivation where individuals in the most deprived decile (302.9 per 100,000) have over twice as high mortality rates compared with the least deprived decile (142.7 per 100,000).
Mortality – Specific conditions
In this section, we will present publicly available data on mortality rates from cancer, cardiovascular, respiratory, and liver diseases.
Cancer
In the UK, 367,000 people are diagnosed with cancer annually. Around 40% of those cancers are caused by behavioural risk factor including smoking and alcohol (CRUK, 2020) and overweight and obesity. Annual NHS costs for cancer services are £5 billion, but the cost to society as a whole – including costs for loss of productivity – is £18.3 billion (HM Government, 2015).
Under 75 years of age mortality from cancer (Persons) in Bury (156.9 per 100,000 population in those aged under 75 years) is higher than England (121.5 per 100,000) and Northwest averages (136 per 100,000). Amongst Bury’s statistical neighbours, Bury has the highest premature mortality rate from cancer, with the lowest rate in Calderdale (117.6).
Data in inequalities are only available by sex for Bury with slightly lower premature mortality from cancer in males (154.1 per 100,000) compared with females (154.1 per 100,000). Data on deprivation is only available at England level, where a social gradient is observed with higher mortality (149.4 per 100,000) in decile 1 compared with decile 10 (104.9 per 100,000).
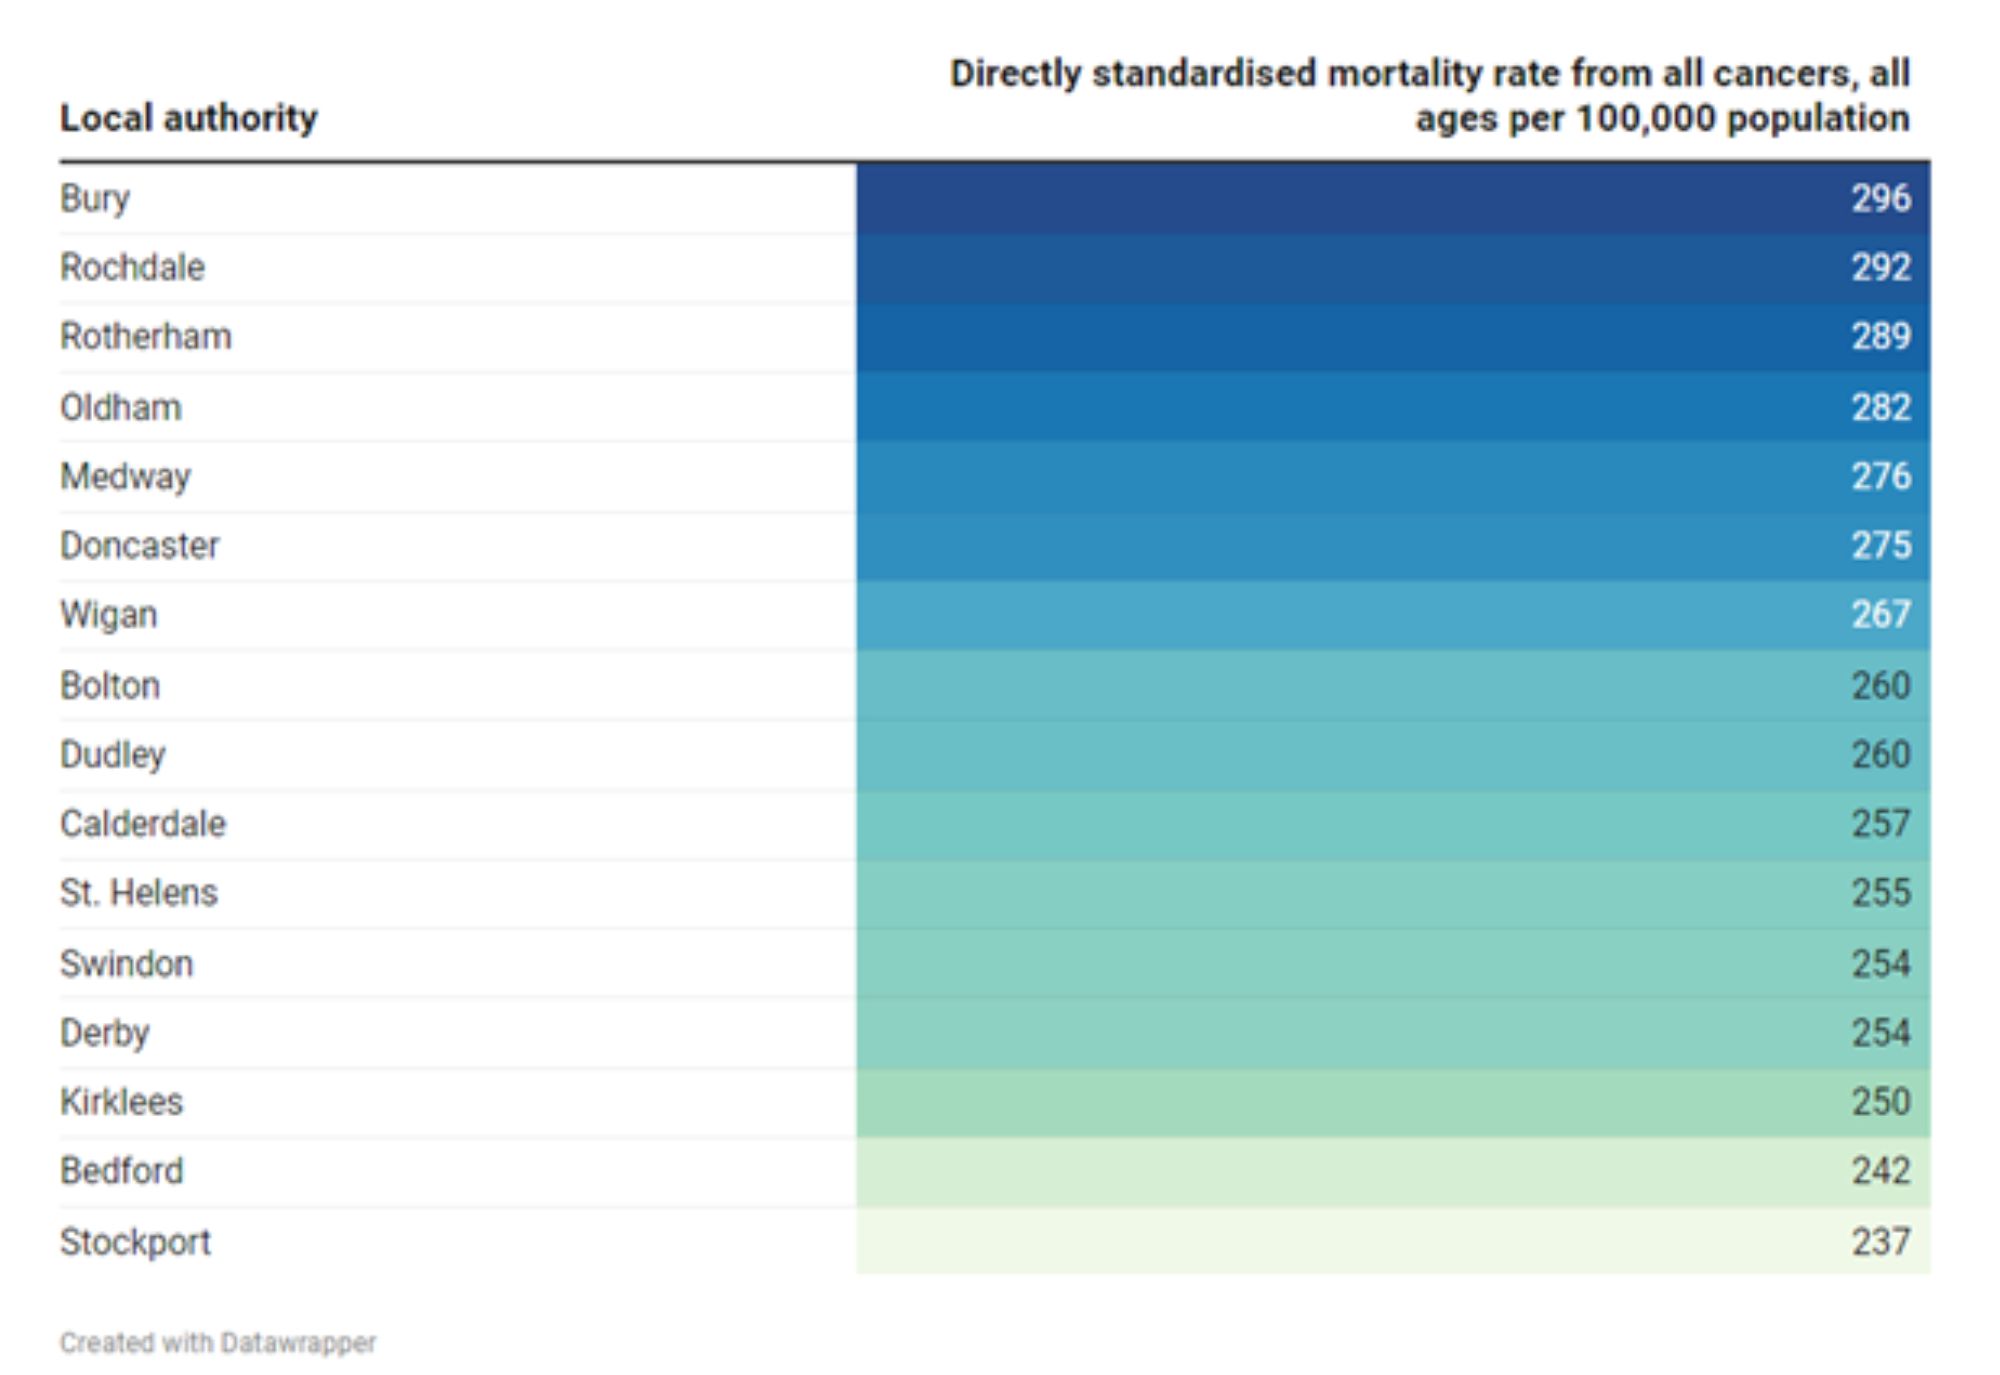
The directly standardised mortality rate from all cancers, all ages in Bury is 296 per 100,000 population for the year 2021, higher than Northwest average of 269 per 100,000 and England average of 248.3 per 100,000 (Mortality Profile, 2021). Bury has the highest all cancer mortality rate in its group of 16 statistical neighbours, with the lowest rate in Stockport of 237.4 per 100,000 (Figure 12).
Figure 12: Directly standardised mortality rate from all cancers, all ages for Bury and its statistical neighbours per 100,000 population
-
 To download a copy of this table, please left click the button below or use the 'Related Files' section located at the bottom of the page.
Data on inequalities in mortality rates from all cancers, all ages in Bury are only available by sex, where cancer mortality in males in 2021 is higher (321.5 per 100,000) compared with females (281.4 per 100,000). Mortality rates for males are similar to the England average of 298.3 per 100,000, whereas for females it is higher than England average of 211.5 per 100,000 and highest amongst Bury group of similar local authorities. Data by deprivation are available for England only and shows a deprivation gradient where individuals in the most deprived decile (288.3 per 100,000) have higher cancer mortality rates compared with the least deprived decile (222 per 100,000) (Mortality Profile, 2021).
Lung Cancer:
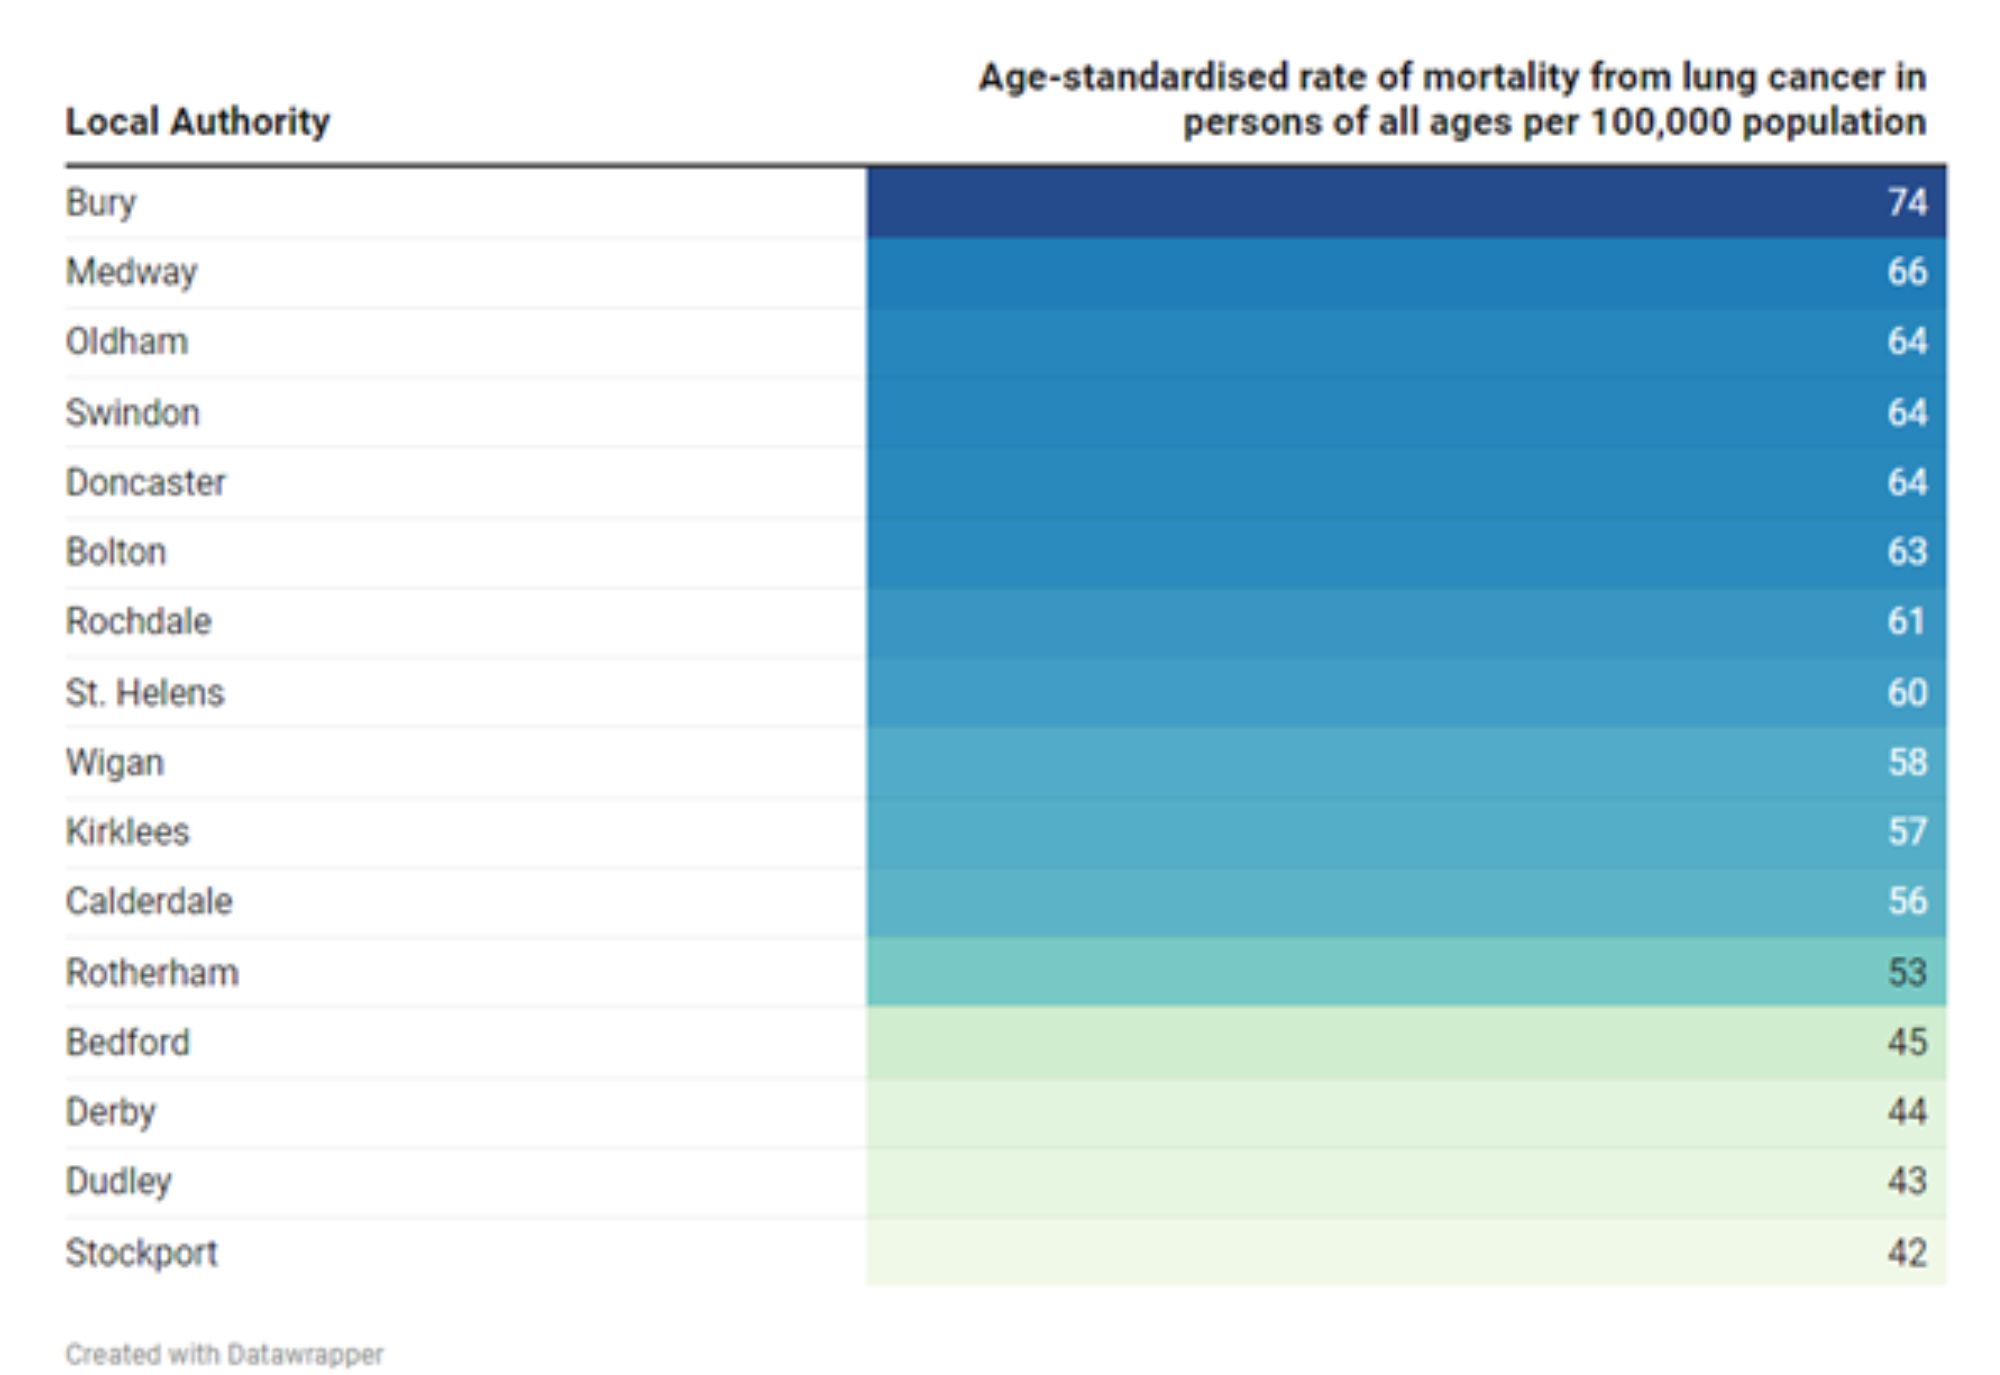
The mortality rate from lung cancer, all ages (Persons) per 100,000 population for the year 2021 in Bury (74.2 per 100,000) is higher than Northwest (59 per 100,000) and England averages (48.5 per 100,000). Bury has the highest mortality from lung cancer in its group of statistical neighbours with the lowest mortality in Stockport of 42.2 per 100,000 (Figure 13).
Figure 13: Aged-standardised mortality rate from lung cancer, all ages for Bury and its statistical neighbours per 100,000 population
-
 To download a copy of this table, please left click the button below or use the 'Related Files' section located at the bottom of the page.
Data on inequalities in mortality rates from lung cancers, all ages in Bury are only available by sex, where cancer mortality in females in 2021 is higher (76.9 per 100,000) compared with males (73 per 100,000) in Bury. Compared with England, mortality rate for Males in Bury is similar to England average (56.2 per 100,000), whereas for females it is higher (statistically significant) than England average of females (42.4 per 100,000) and highest amongst its group of similar local authorities. Data by deprivation are available for England only and shows a steep deprivation gradient where individuals in the most deprived decile (70 per 100,000) have two folds higher cancer mortality rates compared with the least deprived decile (36.3 per 100,000).
Breast Cancer:
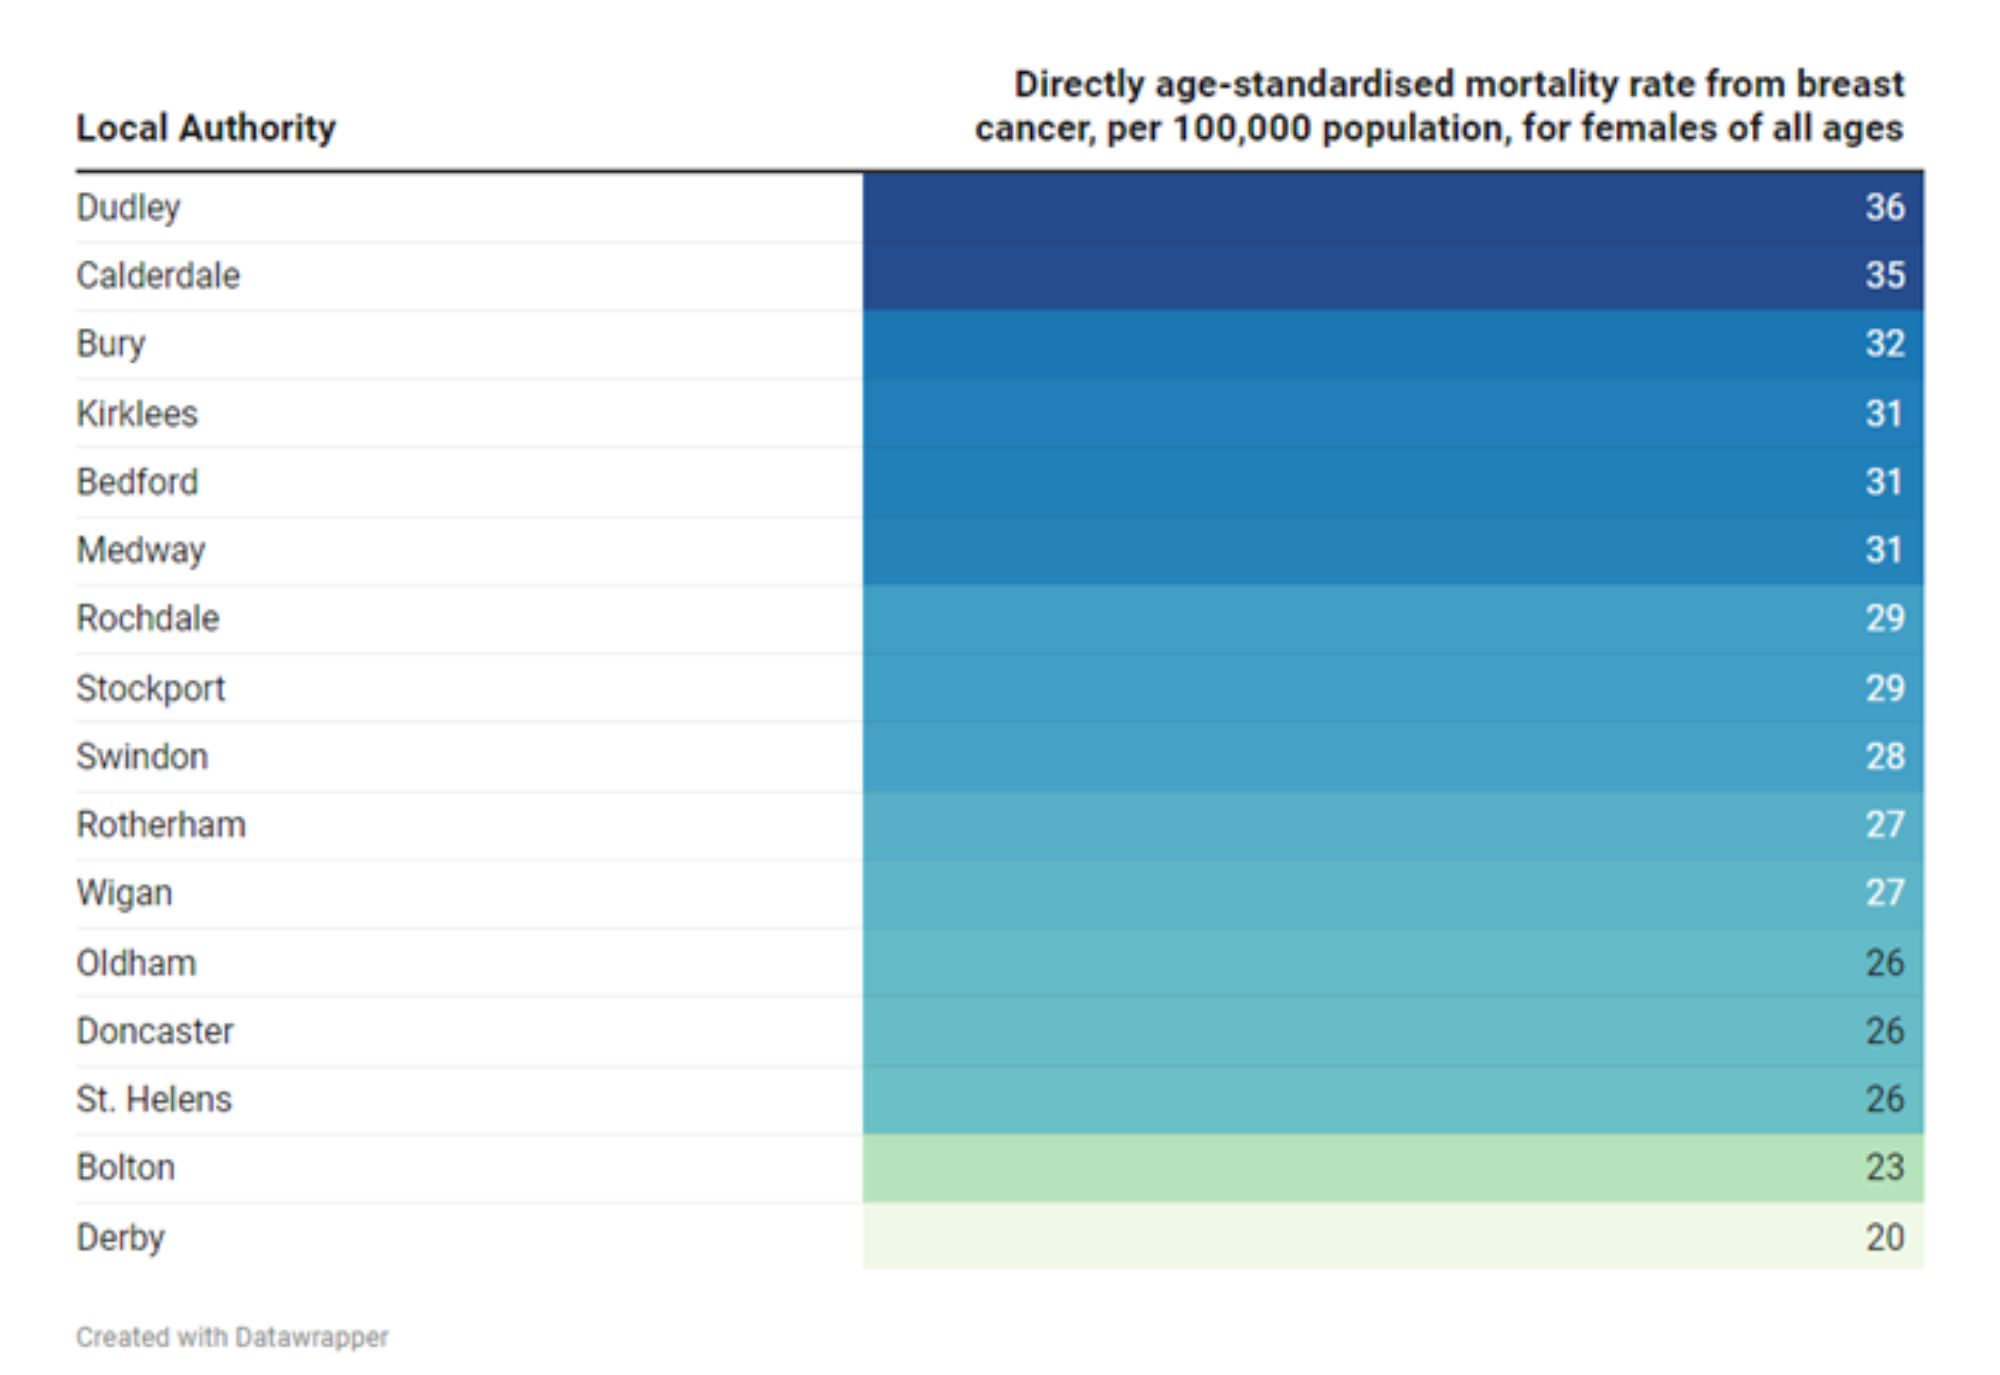
Directly age-standardised mortality rate from breast cancer, per 100,000 population, for females of all ages for the year 2021 in Bury (31.8 per 100,000) is similar (statistically significant) to Northwest (29.5 per 100,000) and England averages (30.3 per 100,000). Bury has the third highest mortality from breast cancer in females in its group of statistical neighbours with the lowest mortality in Derby of 20 per 100,000 (Figure 14).
Figure 14: Directly age-standardised mortality rate from breast cancer, per 100,000 population, for females of all ages for Bury and its statistical neighbours
-
 To download a copy of this table, please left click the button below or use the 'Related Files' section located at the bottom of the page.
Data on inequalities in mortality rates from breast cancer for females of all ages in Bury is not present. Data by deprivation are available for England only and does not show a deprivation gradient, with the exception of decile 1 (least deprived), which has lower mortality rates (26.8 per 100,000) compared with 31.5 per 100,000 in decile 10 (most deprived).
Colorectal Cancer:
Directly age-standardised mortality rate from colorectal cancer, per 100,000 population, for all ages (persons) in Bury (29.7 per 100,000) for the year 2021 is statistically similar to England average (25.4 per 100,000), slightly higher than Northwest average of 27.5 per 100,000.
Comparing Bury to its statistical neighbours, Bury has the 5th highest mortality rate with the lowest mortality rate in Swindon of 20.6 per 100,000 (Figure 15).
Figure 15: Directly age-standardised mortality rate from colorectal cancer, per 100,000 population, for all ages (persons) for Bury and its statistical neighbours
-
-for-Bury-and-its-statistical-neighbours-.jpg) To download a copy of this table, please left click the button below or use the 'Related Files' section located at the bottom of the page.
To download a copy of this table, please left click the button below or use the 'Related Files' section located at the bottom of the page.
Data on inequalities in mortality rates from colorectal cancer, all ages in Bury are only available by sex, where cancer mortality in males in 2021 is higher (35.2 per 100,000) compared with females (25.4 per 100,000). Compared with England, mortality rates for males and females in Bury are similar to England average of 31.3 per 100,000 for males and 20.8 per 100,000 for females. Data by deprivation are available for England only and shows a slight deprivation gradient where individuals in the most deprived decile (27.1 per 100,000) have higher colorectal cancer mortality rates compared with the least deprived decile (23.7 per 100,000).
Cardiovascular diseases (CVD)
Cardiovascular disease (CVD) is a group of disorders that affect the heart and blood vessels, including coronary heart disease (CHD), stroke, heart failure, many causes of dementia and peripheral arterial disease. CVD is a major cause of death and disability in the England. It affects 6 million people and accounts for a quarter of deaths in England. Annual healthcare costs in England relating to CVD are estimated at £7.4 billion, with an annual cost to the wider economy of £15.8 billion (HM Government, 2019).
Under 75 years of age mortality from CVD (Persons) in Bury (93.1 per 100,000 population in those aged under 75 years) is higher than England (76 per 100,000) average but similar to Northwest average (92.8 per 100,000).
Data in inequalities are only available by sex for Bury with twice higher premature mortality from CVD in males (130.8 per 100,000) compared with females (57.1 per 100,000). Data on deprivation is only available at England level, where a social gradient is observed with higher mortality (109.6 per 100,000) in the most deprived decile (decile 1) compared with decile 10 (54.3 per 100,000).
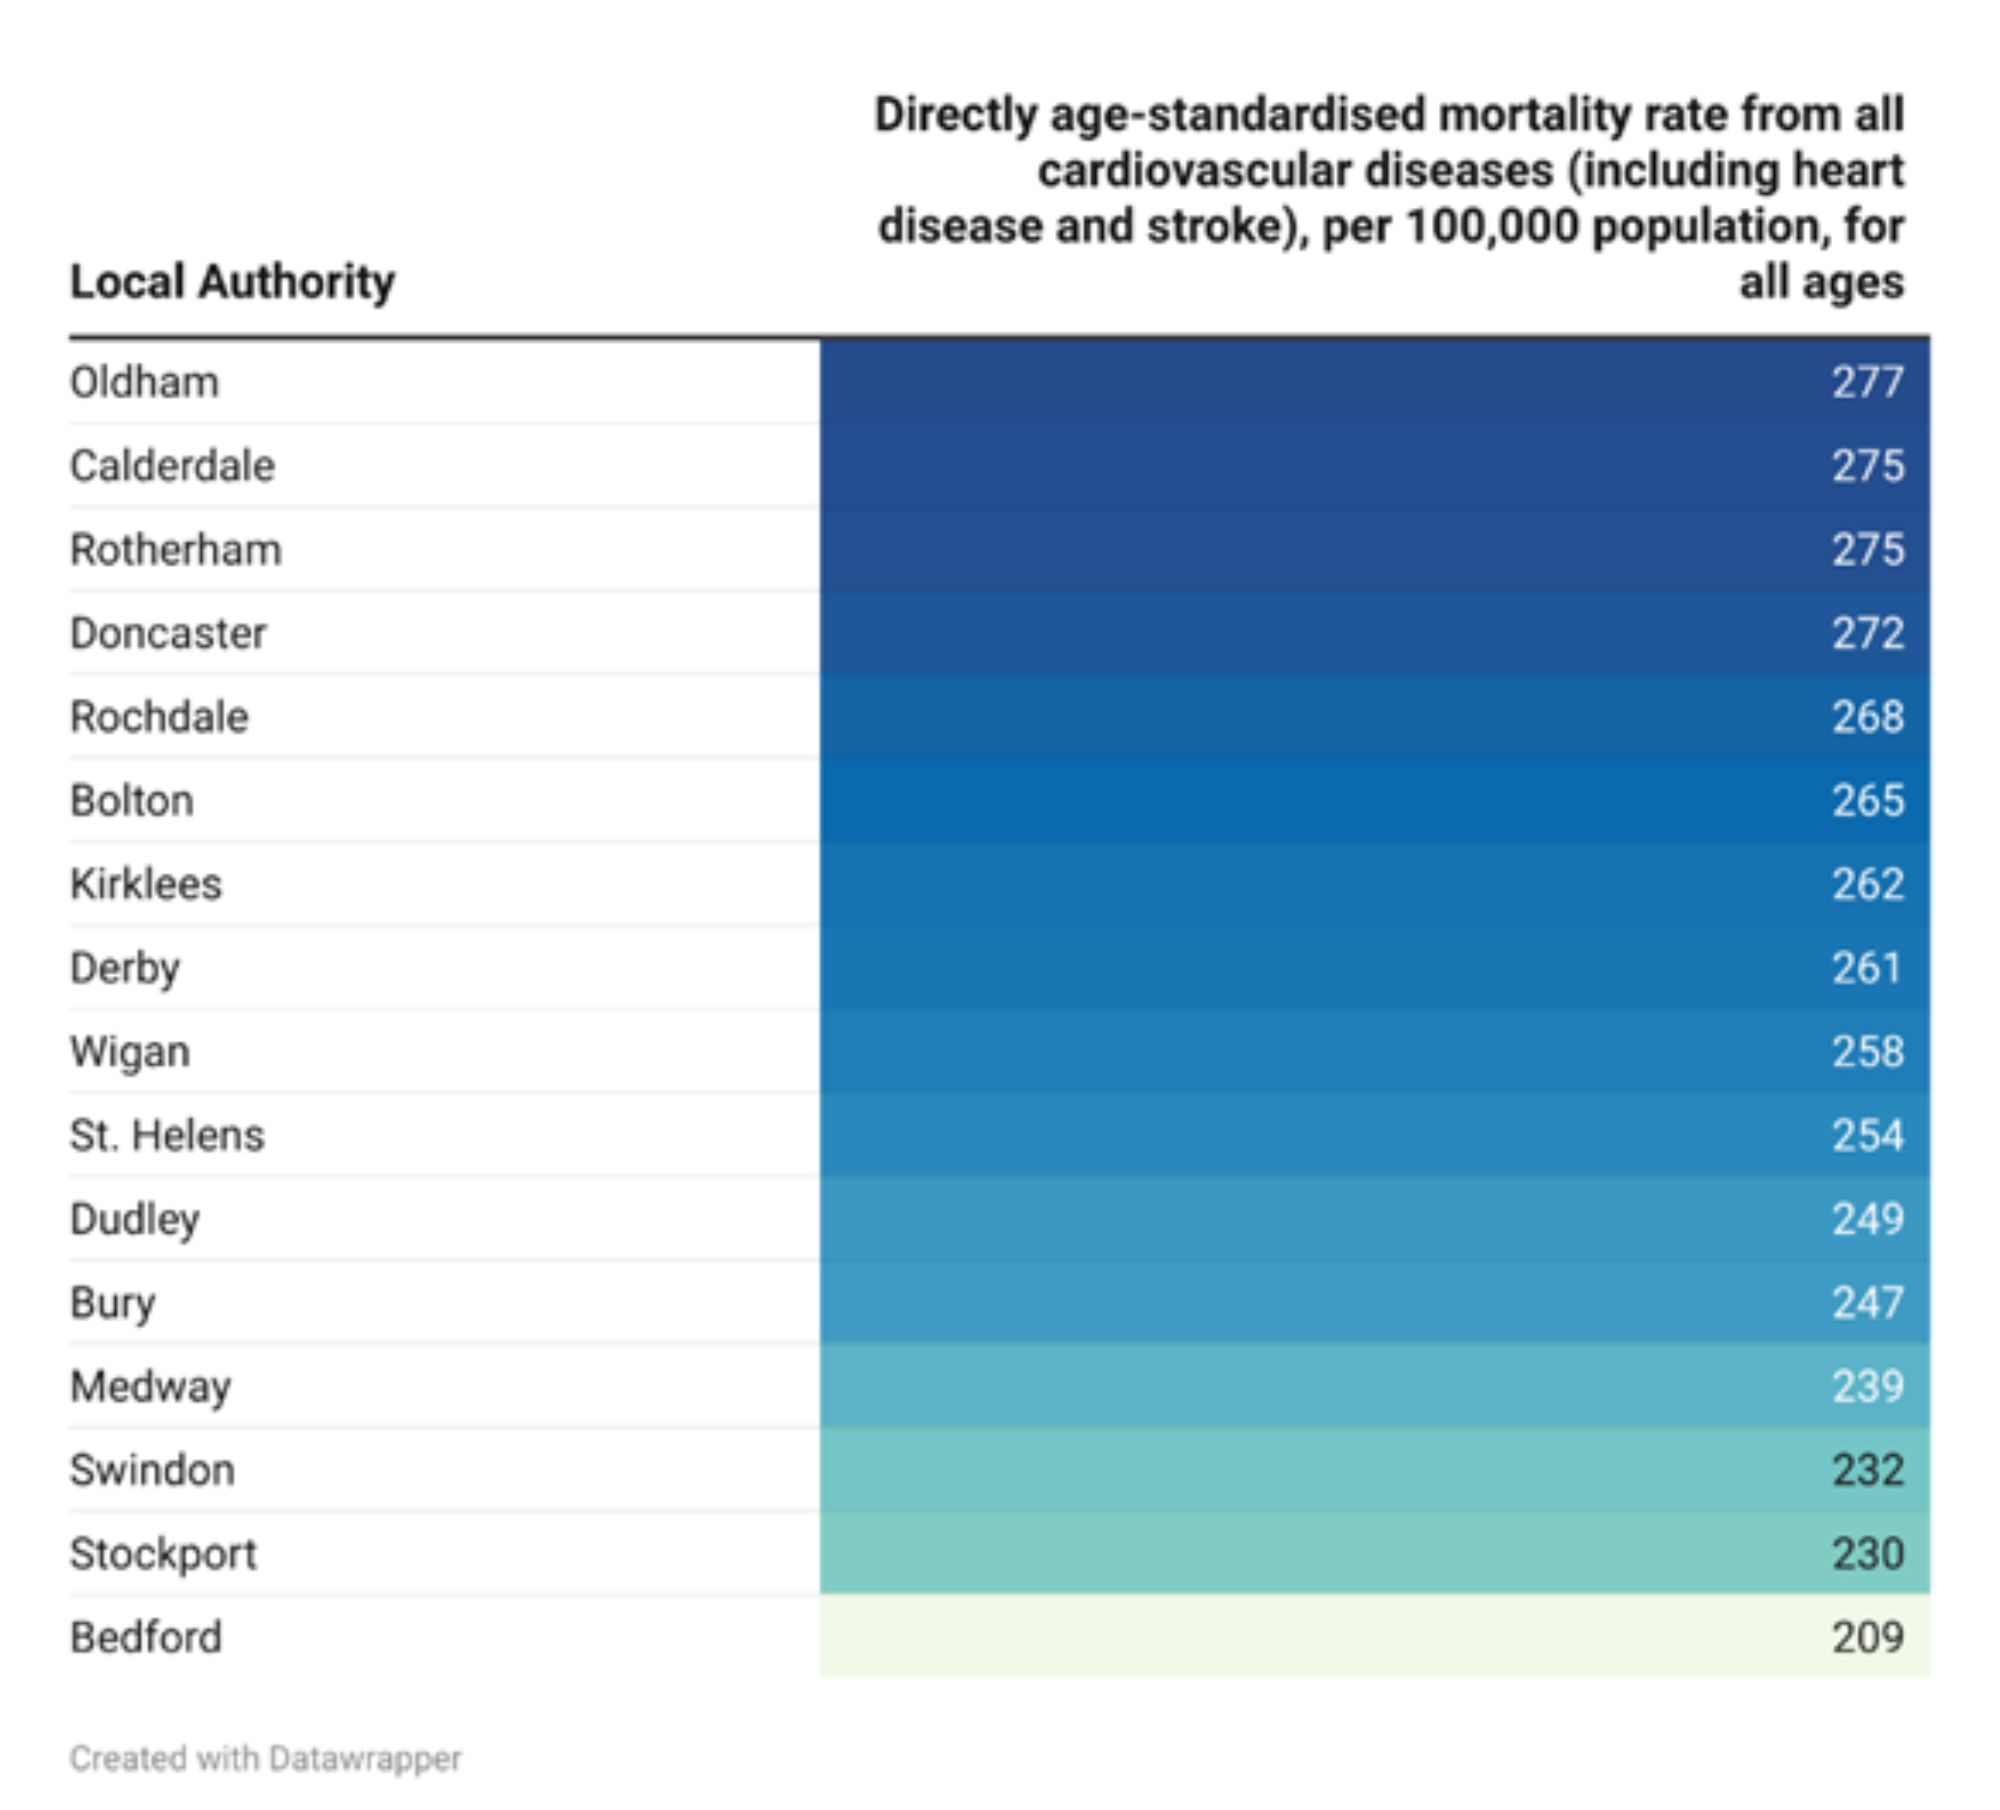
Directly age-standardised mortality rate from all cardiovascular diseases (including heart disease and stroke), per 100,000 population, for all ages in the year 2021 for Bury (247.4 per 100,000) is statistically similar to England average (230.4 per 100,000) and slightly lower than Northwest average (252.8 per 100,000). Amongst its group of similar statistical neighbours, Bury has the 5th lowest CVD mortality rate for the year 2021, with the lowest CVD mortality rate in Bedford (208.9 per 100,000) and highest in Oldham (276.5 per 100,000) (Figure 16).
Figure 16: Directly age-standardised mortality rate from all cardiovascular diseases (including heart disease and stroke), per 100,000 population, for all ages for Bury and its statistical neighbours
-
 To download a copy of this table, please left click the button below or use the 'Related Files' section located at the bottom of the page.
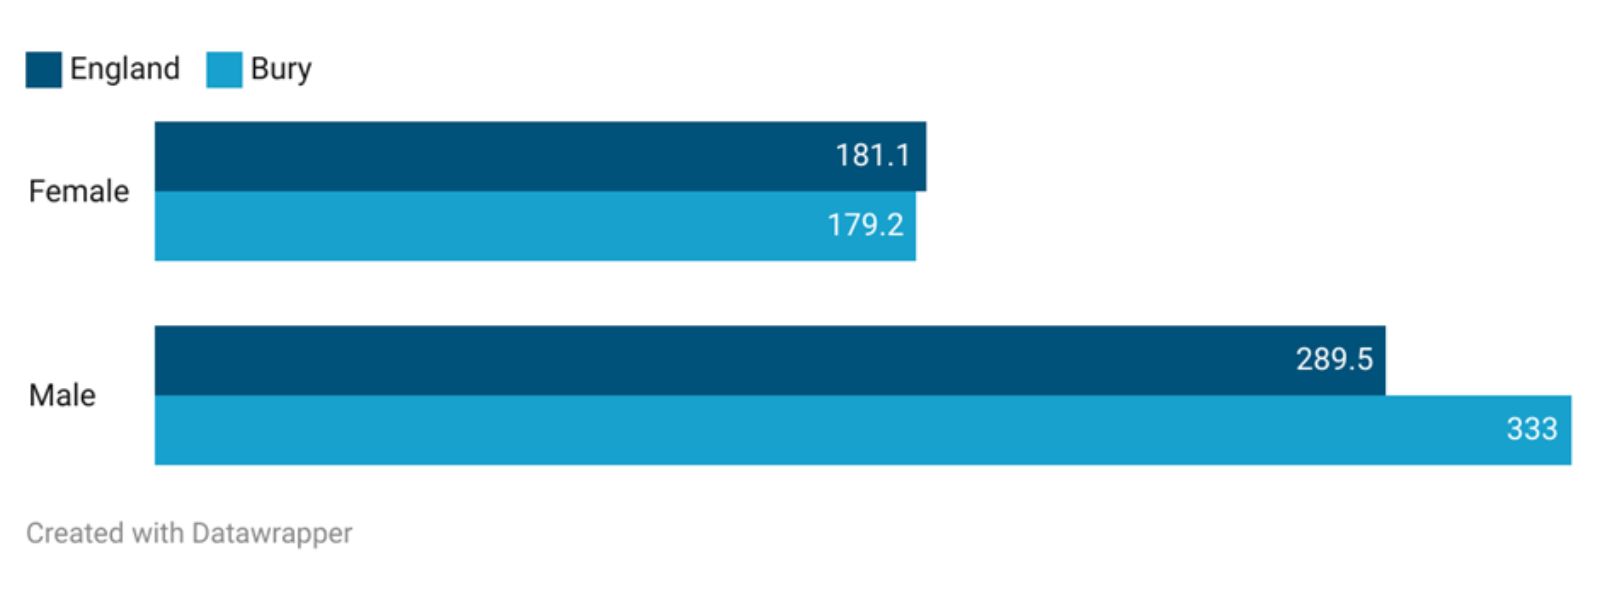
Data by inequalities are limited for Bury and are only available by sex for the year 2021 only, where males in Bury have almost twice (333 per 100,000) the mortality rate for CVD compared with females (179.2 per 100,000). Compared to England, CVD mortality rate for males in Bury is statistically higher than England average in males of 289.5 per 100,000, whereas it's similar to England average of 181.1 per 100,000 for females (Figure 17).
Figure 17: Comparison of directly age-standardised mortality rate from all cardiovascular diseases (including heart disease and stroke), per 100,000 population, for all ages by sex in Bury with England
-
 To download a copy of this table, please left click the button below or use the 'Related Files' section located at the bottom of the page.
There are no publicly available data by deprivation for Bury. Data by levels of deprivation in England suggests a social gradient where individuals in the most deprived quintile have higher CVD mortality rates (281.5 per 100,000) compared with the least deprived quintile (187.7 per 100,000).
Coronary heart diseases (CHD)
Directly age-standardised mortality rate from CHD per 100,000 population for the year 2021 in Bury (106.3 per 100,000) is similar (statistically significant) to England averages (97 per 100,000) and slightly lower than Northwest average of 114.1 per 100,000. Bury has the 6th lowest mortality from CHD in its group of statistical neighbours with the lowest mortality in Bedford of 91.9 per 100,000 and highest in Doncaster of 138.1 per 100,000 (Figure 14).
Figure 18: Directly age-standardised mortality rate from CHD per 100,000 population, for all ages (persons) for Bury and its statistical neighbours
-
-for-Bury-and-its-statistical-neighbours-.jpg) To download a copy of this table, please left click the button below or use the 'Related Files' section located at the bottom of the page.
To download a copy of this table, please left click the button below or use the 'Related Files' section located at the bottom of the page.
Data by inequalities are limited for Bury and are available by sex for the year 2021 only, where males in Bury have nearly thrice (160.2 per 100,000) the mortality rate for CHD compared with females (62.3 per 100,000). Compared to England, CHD mortality rate for males in Bury is statistically similar to England average for males of 144.1 per 100,000 and for females it's similar to England average for females of 58.8 per 100,000. There are no publicly available data by deprivation for Bury. Data by levels of deprivation in England suggests a social gradient where individuals in the most deprived quintile have higher CHD mortality rates (133.4 per 100,000) compared with the least deprived quintile (187.7 per 100,000) (Mortality Profile, 2021).
Stroke
Mortality rate from stroke, all ages (Persons) per 100,000 population for the year 2021 in Bury (62.8 per 100,000) is higher than Northwest (55.2 per 100,000) and England averages (49.8 per 100,000). Bury has the second highest mortality from stroke in its group of statistical neighbours with the highest mortality in Oldham (70.4 per 100,000) and lowest mortality in Dudley of 42.2 per 100,000 (Figure 19).
Figure 19: Directly age-standardised mortality rate from stroke per 100,000 population, for all ages (persons) for Bury and its statistical neighbours
-
-for-Bury-and-its-statistical-neighbours-.jpg) To download a copy of this table, please left click the button below or use the 'Related Files' section located at the bottom of the page.
To download a copy of this table, please left click the button below or use the 'Related Files' section located at the bottom of the page.
Data on inequalities in mortality rates from stroke, all ages in Bury are only available by sex, where mortality from stroke in males for the year 2021 is higher (80.1 per 100,000) compared with females (49.3 per 100,000). Bury has the highest stroke mortality in men amongst its group of similar local authorities. Compared with England, mortality rates for males are higher than England average of 52.4 per 100,000 and similar to England average of 47.2 per 100,000 for females. Data by deprivation are available for England only and shows a slight deprivation gradient where individuals in the most deprived decile (58.8 per 100,000) have higher stroke mortality rates compared with the least deprived decile (41.4 per 100,000).
Dementia and Alzheimer’s disease
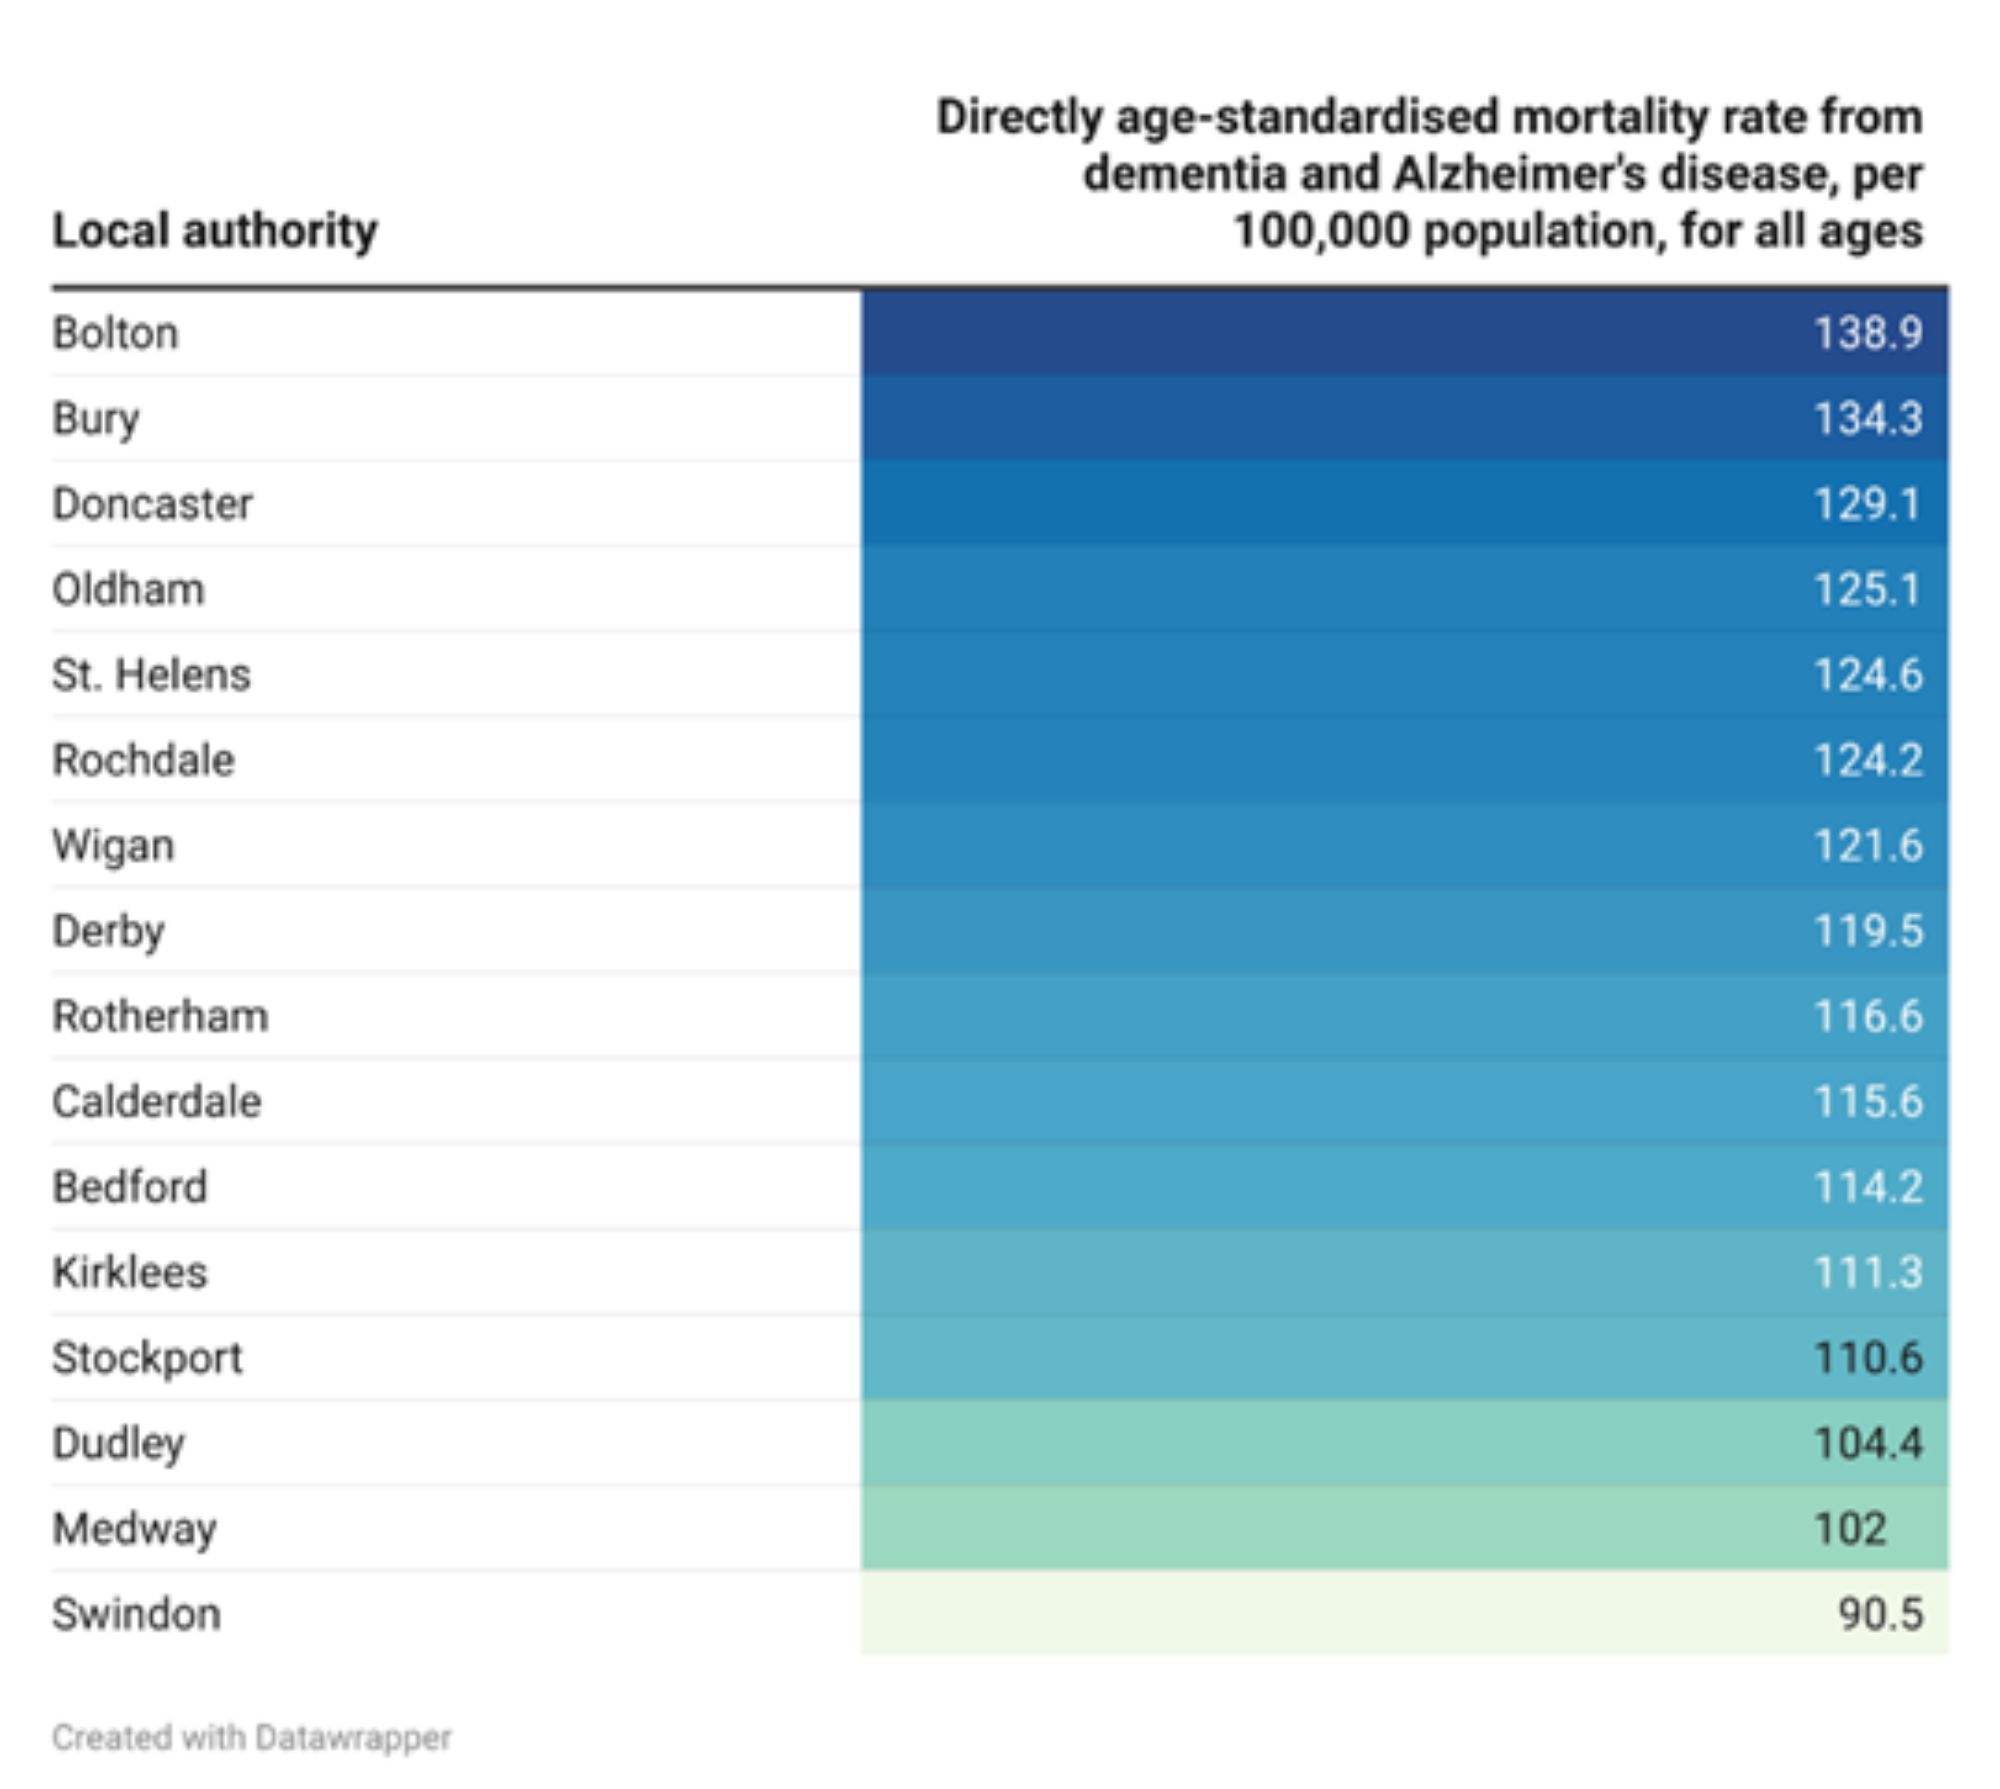
Mortality rate from Dementia and Alzheimer’s, all ages (Persons) per 100,000 population for the year 2021 in Bury (134.3 per 100,000) is higher than Northwest (118.4 per 100,000) and England averages (106.3 per 100,000). Bury has the 2nd highest mortality from Dementia and Alzheimer’s disease in its group of statistical neighbours with the highest mortality in Bolton of 138.9 per 100,000 and lowest mortality in Swindon of 90.5 per 100,000 (Figure 20). However, it is worth noting that Bury performs relatively well in diagnosing dementia, and this may contribute to its relatively high rate of dementia deaths.
Figure 20: Directly age-standardised mortality rate from Dementia and Alzheimer’s per 100,000 population, for all ages (persons) for Bury and its statistical neighbours
-
 To download a copy of this table, please left click the button below or use the 'Related Files' section located at the bottom of the page.
Data on inequalities in mortality rates from Dementia and Alzheimer’s, all ages in Bury are only available by sex, where Dementia and Alzheimer’s mortality in females in 2021 is almost double (160.5 per 100,000) compared with males (88.3 per 100,000). Mortality rates from dementia and Alzheimer’s for males in Bury are similar to England average of 92.8 per 100,000 and the third lowest in Bury's group of statistical neighbours. However, mortality rates in females are greater than the average of England (113.8 per 100,000). Amongst Bury’s group of similar local authorities, dementia and Alzhiemer’s mortality is the highest in Bury. Data by deprivation are available for England only and shows a slight deprivation gradient where individuals in the most deprived decile (122.9 per 100,000) have higher Dementia and Alzheimer’s mortality rates compared with the least deprived decile (97.5 per 100,000).
Liver disease
Liver disease is one of the leading causes of mortality in England with individuals dying early from the disease. Majority of liver diseases are preventable from public health interventions focused on reducing alcohol consumption and obesity (OHID, 2021). Around 62,000 years of working life are lost to liver disease every year and its impact on the poorest in our society is disproportionally severe, contributing to the widening of socioeconomic health inequalities in the UK (Liver research, 2017).
Under 75 years of age mortality from liver disease (Persons) in Bury is 33.8 per 100,000 population in those aged under 75 years, higher than England average of 21.2 per 100,000 and Northwest average of 29.3 per 100,000.
Data in inequalities are only available by sex for Bury with twice higher premature mortality from liver disease in males (45.3 per 100,000) compared with females (22.8 per 100,000). Data on deprivation is only available at England level, where a social gradient is observed with higher mortality (30 per 100,000) in the most deprived decile (decile 1) compared with decile 10 (15.2 per 100,000).
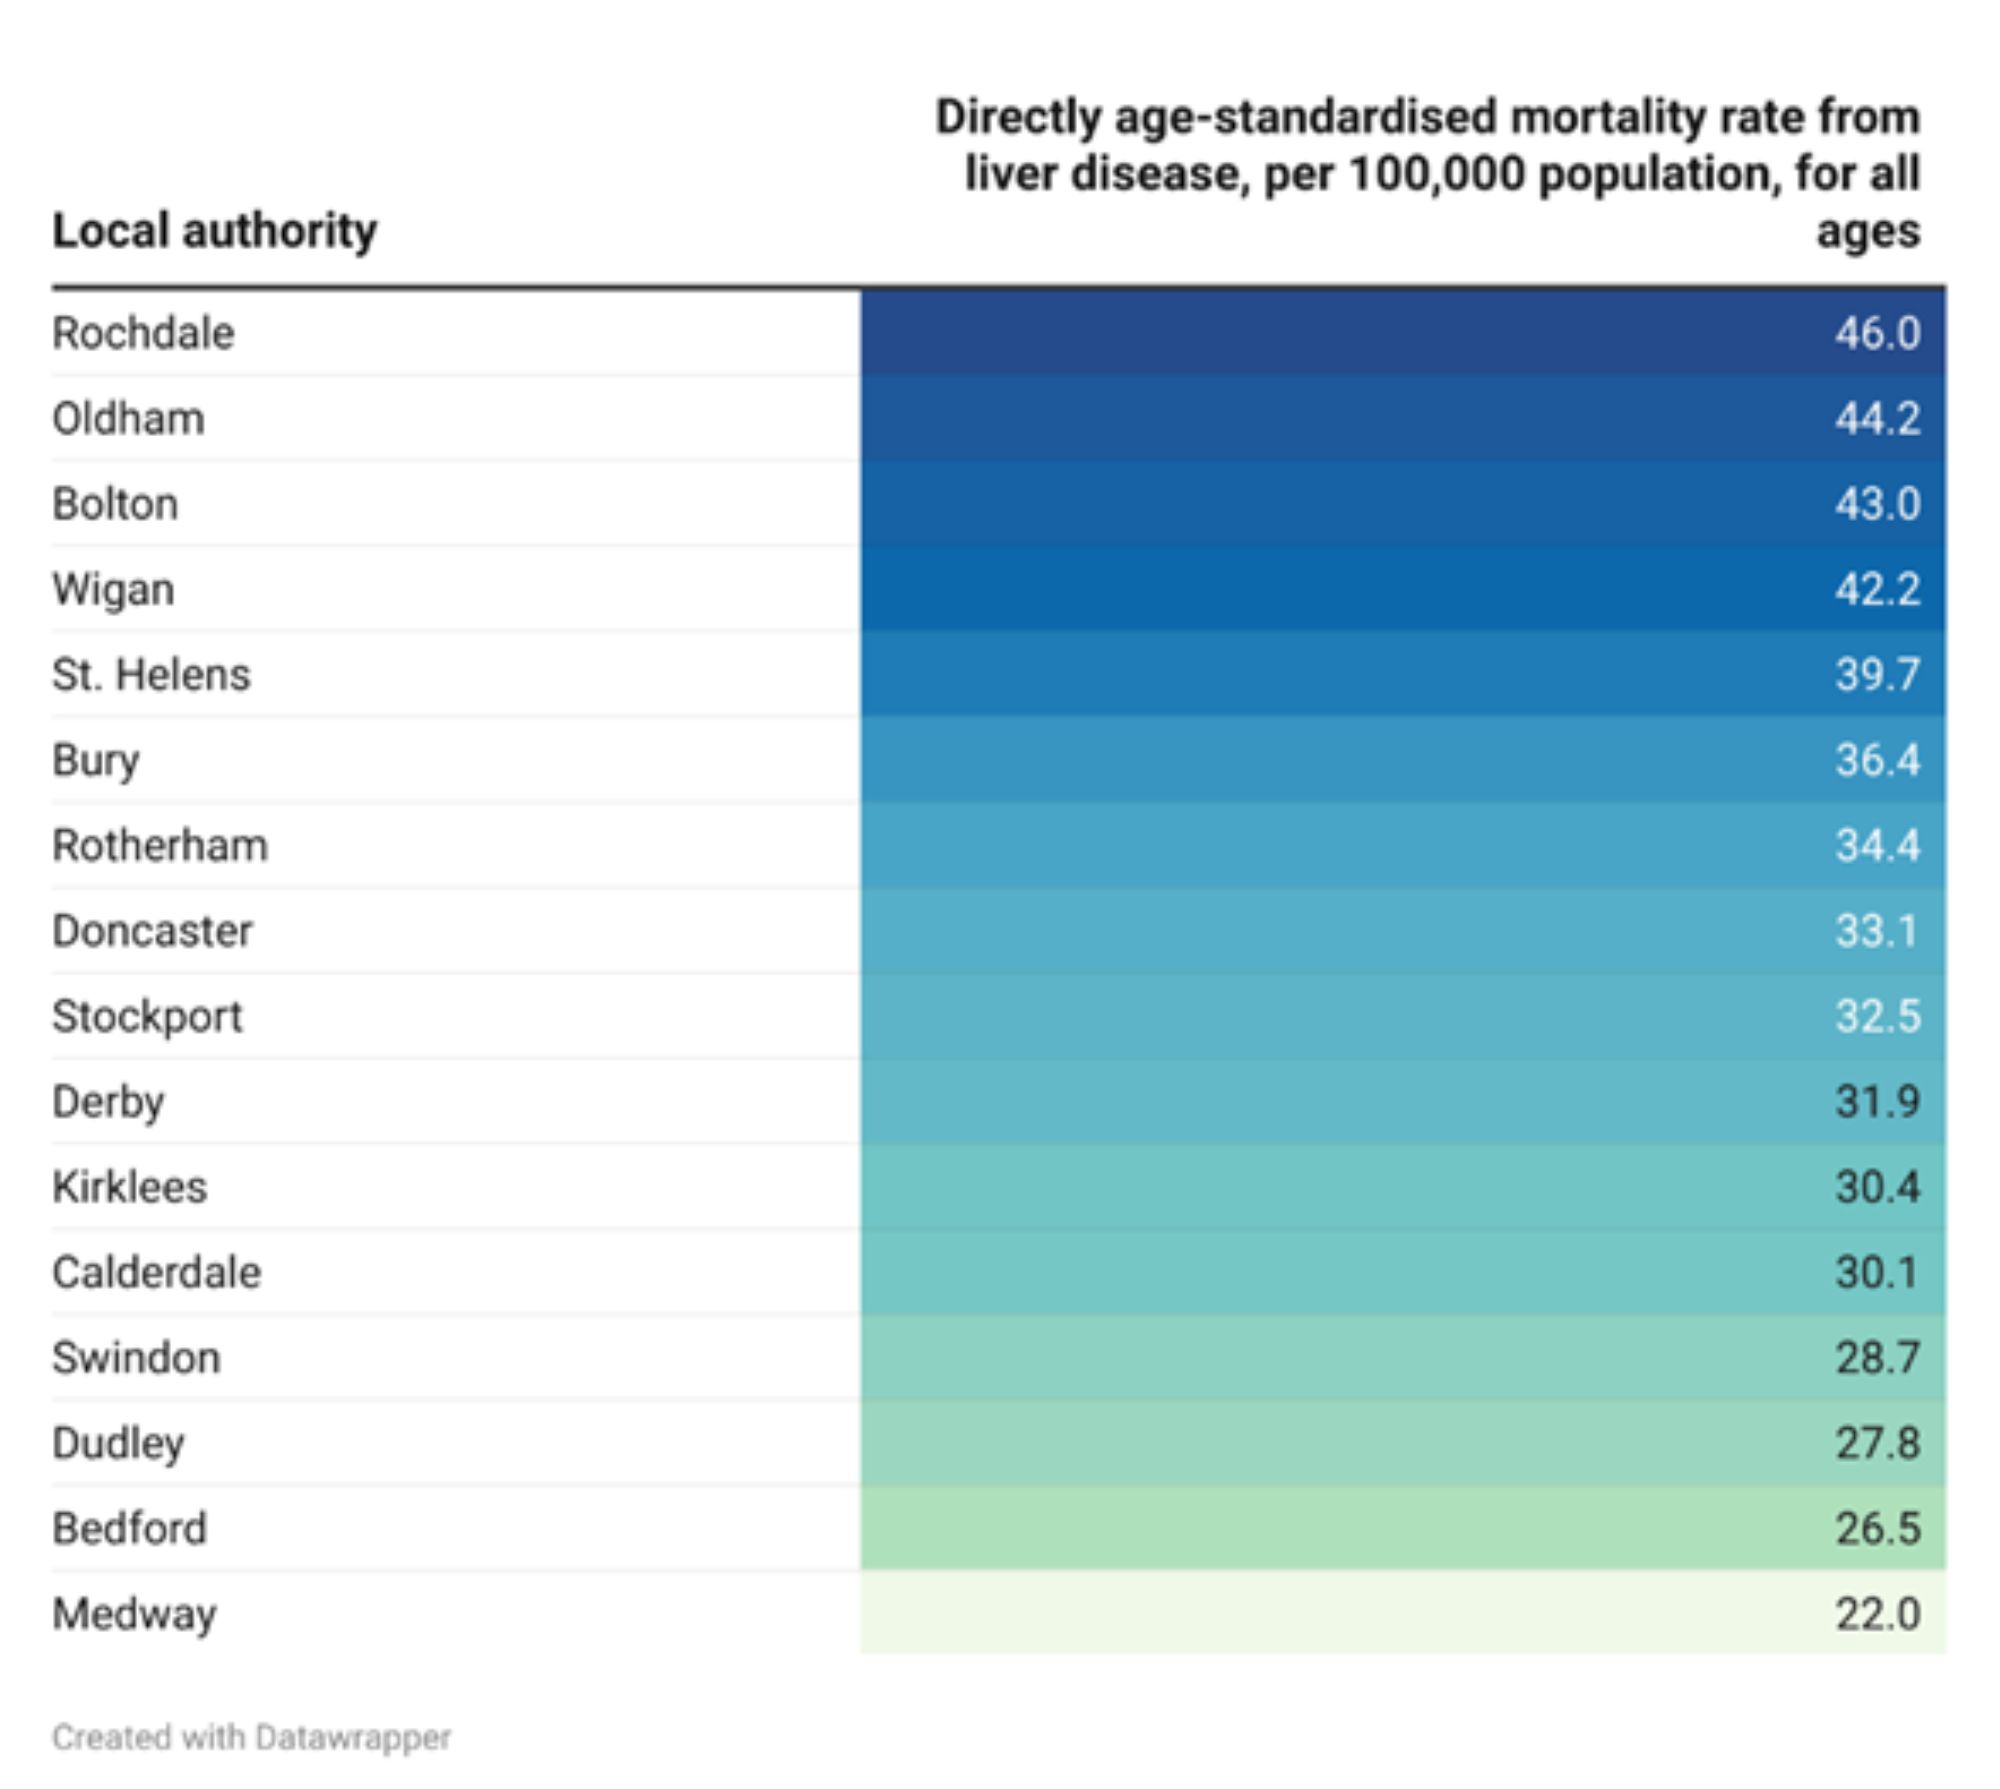
Directly age-standardised mortality rate from liver diseases per 100,000 population, for all ages (persons) in the year 2021 for Bury (36.4 per 100,000) is higher (statistically significant) than England average (27.1 per 100,000) and slightly higher than Northwest average (35.7 per 100,000). Amongst its group of similar statistical neighbours, Bury has the 6th highest mortality rate from liver diseases for the year 2021, with the lowest liver disease mortality rate in Medway (22 per 100,000) and highest in Rochdale (46 per 100,000) (Figure 21).
Figure 21: Directly age-standardised mortality rate from liver disease per 100,000 population, for all ages (persons) for Bury and its statistical neighbours
-
 To download a copy of this table, please left click the button below or use the 'Related Files' section located at the bottom of the page.
Data by inequalities are limited for Bury and are only available by sex for the year 2021 only, where males in Bury have nearly twice (47.3 per 100,000) the mortality rate for liver disease compared with females (26.4 per 100,000). Compared to England, CVD mortality rate for males in Bury is statistically similar to England average for males of 34.8 per 100,000 and for females it's similar to England average for females of 20.2 per 100,000. There are no publicly available data by deprivation for Bury. Data by levels of deprivation in England suggests a social gradient where individuals in the most deprived quintile have higher liver disease mortality rates (37.1 per 100,000) compared with the least deprived quintile (21.1 per 100,000) (Mortality Profile, 2021).
Respiratory disease
Respiratory disease is one of the top leading causes of premature mortality in England and smoking is the major cause of chronic obstructive pulmonary disease (COPD), one of the major respiratory diseases. Around 55% of these respiratory deaths are considered potentially preventable (OHID, 2021)
Under 75 years of age mortality from respiratory disease (Persons) in Bury is 28.3 per 100,000 population in those aged under 75 years, similar to England average of 26.5 per 100,000 and lower than Northwest average of 35.3 per 100,000.
Data in inequalities are only available by sex for Bury with higher premature mortality from respiratory disease in males (34.3 per 100,000) compared with females (22.6 per 100,000). Data on deprivation is only available at England level that shows a sharp deprivation gradient with higher premature mortality in most deprived decile (decile 1) of 45.3 per 100,000 compared with 16.2 per 100,000 in the least deprived decile (decile 10).
Mortality rate from respiratory disease, all ages (Persons) per 100,000 population for the year 2021 in Bury (102.2 per 100,000) is slightly higher than England average of 93.8 but lower than Northwest average of 114.4. Bury has the 5th lowest mortality from respiratory disease in its group of statistical neighbours with the highest mortality in St. Helens of 135.5 per 100,000 and lowest mortality in Stockport of 75.8 per 100,000 (Figure 22).
Figure 22: Directly age-standardised mortality rate from respiratory disease per 100,000 population, for all ages (persons) for Bury and its statistical neighbours
-
-for-Bury-and-its-statistical-neighbours-.jpg) To download a copy of this table, please left click the button below or use the 'Related Files' section located at the bottom of the page.
To download a copy of this table, please left click the button below or use the 'Related Files' section located at the bottom of the page.
Data on inequalities in mortality rates from respiratory disease, all ages in Bury are only available by sex, where respiratory disease mortality in males in 2021 is higher (126.3 per 100,000) compared with females (85.7 per 100,000). Mortality rate from respiratory disease for males in Bury is similar to England average of 115.3 per 100,000 and the 6th lowest in Bury’s group of statistical neighbours. Mortality rate from respiratory disease for females in Bury is also similar to England average of 78.7 per 100,000 and the 5th lowest in Bury’s group of statistical neighbours. Data by deprivation are available for England only and shows inequalities by levels of deprivation, where individuals in the most deprived decile (131.1 per 100,000) have higher respiratory disease mortality rates compared with the least deprived decile (76.2 per 100,000).