Income
Income
Income
Income
Income is one of the most important causes of health or illness. It affects people’s ability to access all the major building blocks of health, such as secure housing, good quality food, and social activities
Income refers to money received either for work done, goods or services, pensions or benefits. Improving the income of the poorest members of society is an important way to improving their health and reducing health inequalities (How does money influence health). Research has consistently shown that income is related to life expectancy and disability free life expectancy (Fair society, healthy lives).
Earnings
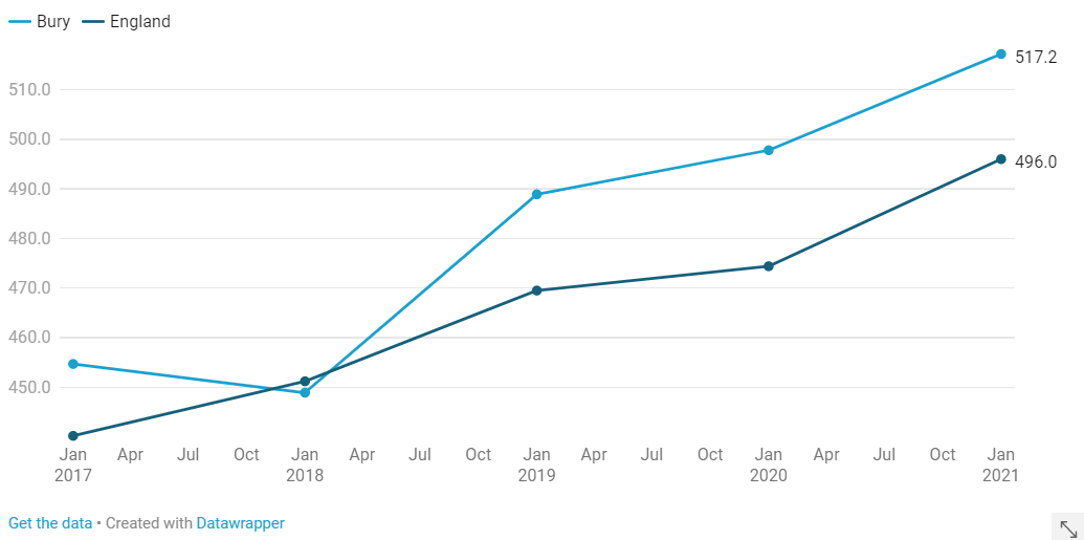
The Average Weekly Earnings of people in Bury is statistically similar to the average for England. The Average Weekly Earnings indicator is designed to show the variation of economic resources across areas and between subgroups, with earnings being the primary source of income. Figure 1 below illustrates that apart from 2018, Bury has consistently had a higher figure than England for median average weekly earnings for the last five years (Public Health Profiles).
Figure 1: Average weekly earnings, Median - £, Bury and England, 2017-2021
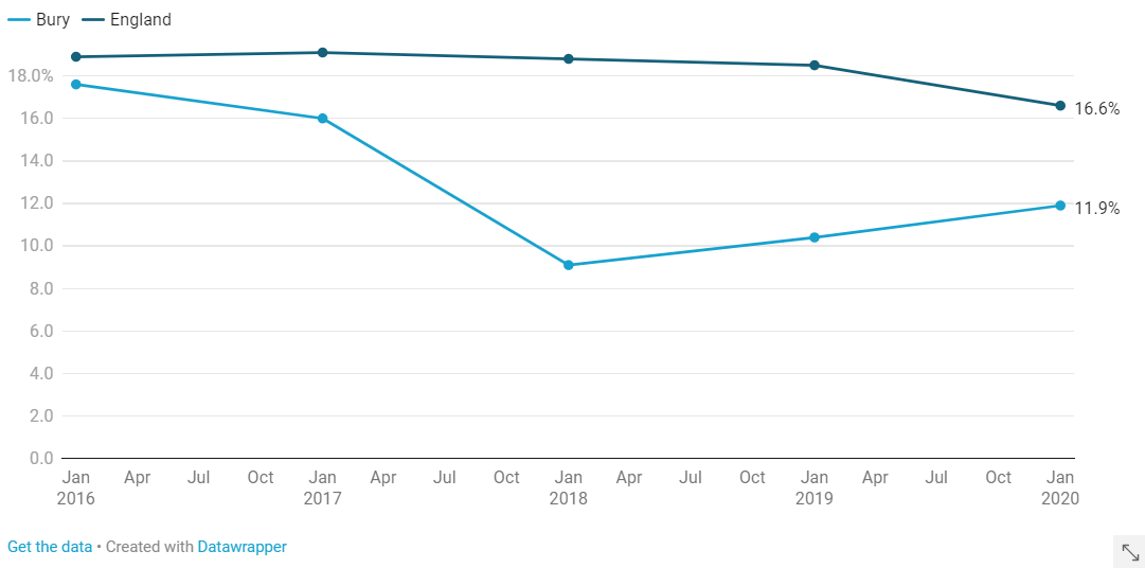
Gender pay inequality has been reducing over the past few decades, but remains substantial. This gender pay gap indicator is designed to measure the difference in pay between men and women who work in each area. The aim is to support local practitioners understanding how employment within their local area contributes to unequal financial resources between men and women. Bury has the fifth lowest gender pay gap when compared to its fifteen other statistical neighbours (Public Health Profiles). The gender pay gap is presented here by workplace location instead of resident location to provide users with a workplace-centred view of the pay gap. Figure 2 below illustrates the fluctuation in the gender pay gap in Bury and England for the last five years.
Figure 2: Gender pay gap (by workplace location), Proportion - %, Bury and England, 2016-2020
Income Deprivation
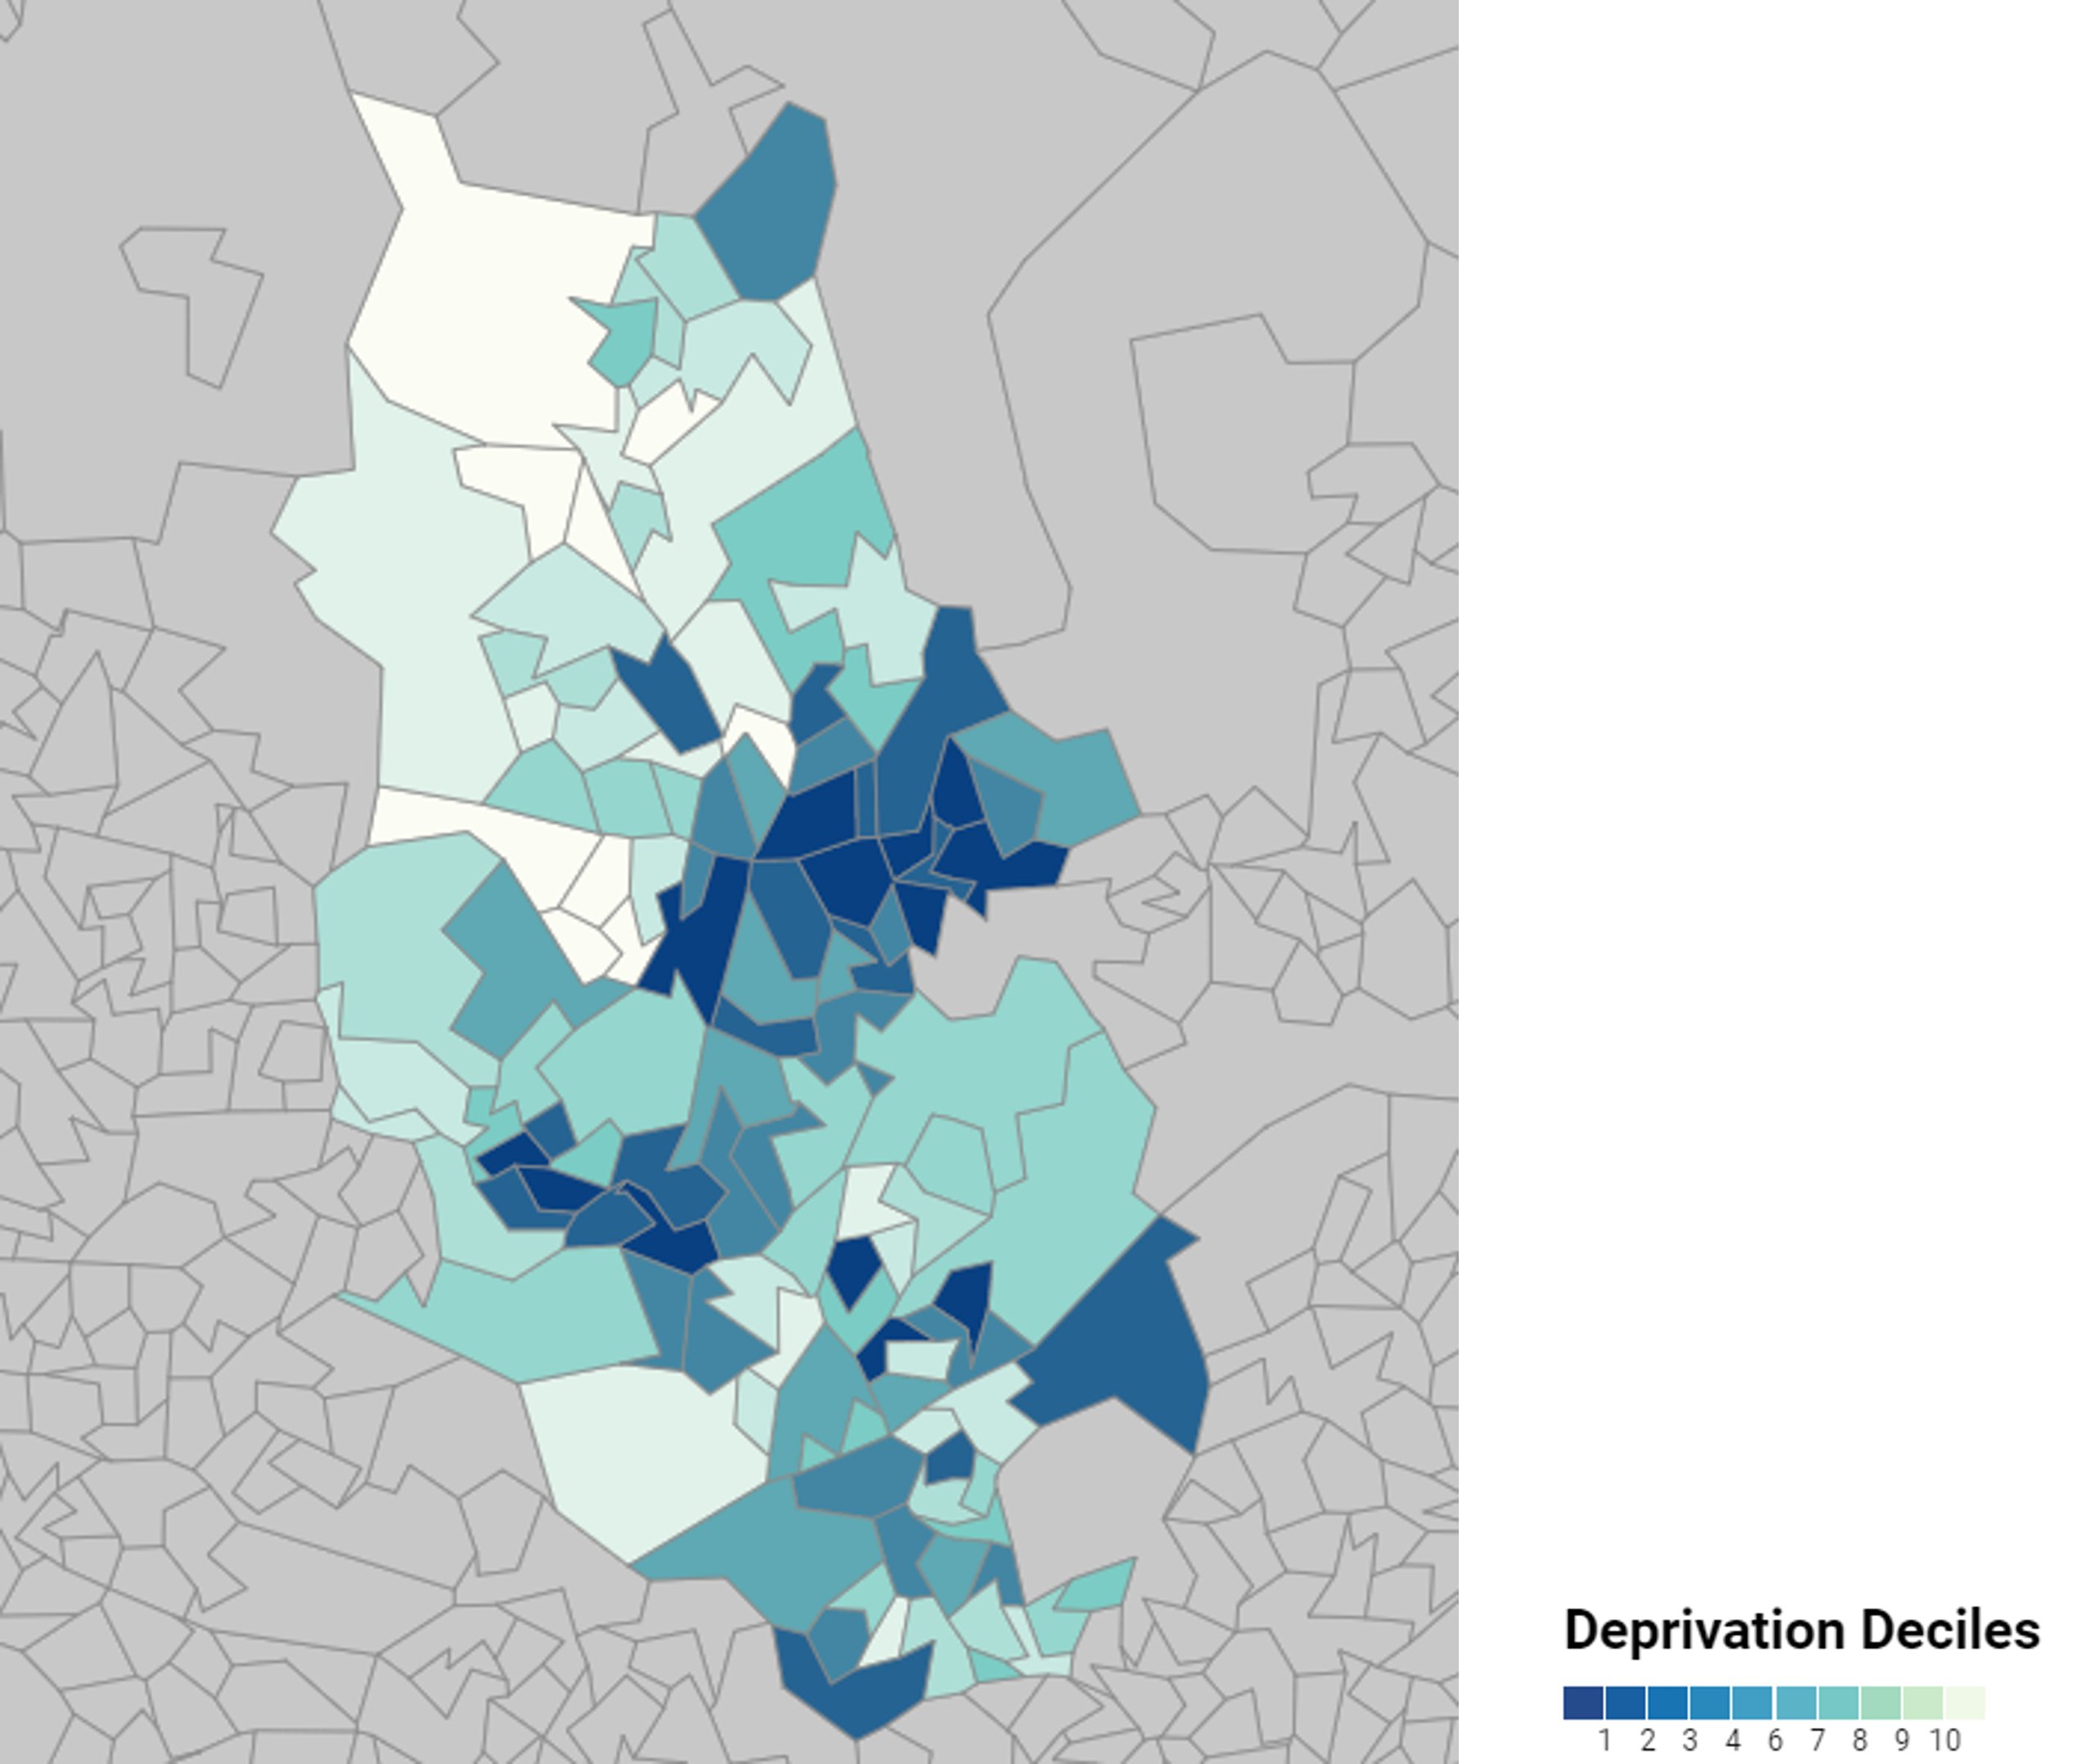
Income Deprivation measures the proportion of the population in an area experiencing deprivation relating to low income. The definition of low income used includes both those people that are out-of-work, and those that are in work but who have low earnings (and who satisfy the respective means tests). The difference in deprivation between areas is a major determinant of health inequality. According to the 2019 Indices of deprivation, 14.5% of people living in Bury are deprived. This is significantly worse than the proportion of people living in deprivation across England of 12.9%. Bury has the fourth lowest proportion of people living in deprivation when compared to its fifteen other statistical neighbours (Public Health Profiles). Bury ranks 95th out of the 317 Local Authorities in England in terms of deprivation level, where 1 is the most income deprived (IMD 2019). However, geographical variations exist within Bury. The deprivation scores are designed to be used at small-area level (Lower Super Output Area - LSOA). There are 12 LSOAs in Bury that are in the 10% most deprived in the country. These are mostly found near Bury town centre, and in the Radcliffe and Besses areas (IMD 2019). Map 1 below highlights the variations in levels of deprivation within Bury.
Map 1: LSOAs in Bury showing their national deprivation decile based on ten groups ranging from ‘10% most deprived’ (decile 1) to ‘10% least deprived’ (decile 10) in England
-
 Source: Ministry of Housing, Communities & Local Government Local Authority Dashboard (2019) https://www.lancashire.gov.uk/lancashire-insight/deprivation/indices-of-deprivation-2019/mhclg-dashboard/
Children in Deprivation
The Marmot Review (2010) suggests there is evidence that childhood poverty leads to premature mortality and poor health outcomes for adults. Reducing the numbers of children who experience poverty should improve these adult health outcomes and increase healthy life expectancy. There is also a wide variety of evidence to show that children who live in poverty are exposed to a range of risks that can have a serious impact on their mental health. The Marmot Review recommended a policy objective of giving every child the best start in life.
Bury remains significantly worse than England for the percentage of children in absolute low income families (under 16s). This refers to the percentage of children under 16 in a local area, living in absolute low income families. A family is defined as a single adult, or a married or cohabitating couple, or a Civil Partnership, and any dependent children. Absolute low income is defined as a family in low income Before Housing Costs (BHC) in the reference year in comparison with incomes in 2010/11. A family must have claimed one or more of Universal Credit, Tax Credits or Housing Benefit at any point in the year to be classed as low income in these statistics (Public Health Profiles). Figure 3 below illustrates the trend in Bury and England for this measure.
Figure 3: Children in absolute low income families (under 16s), Proportion - %, Bury and England, 2016/17 - 2020/21
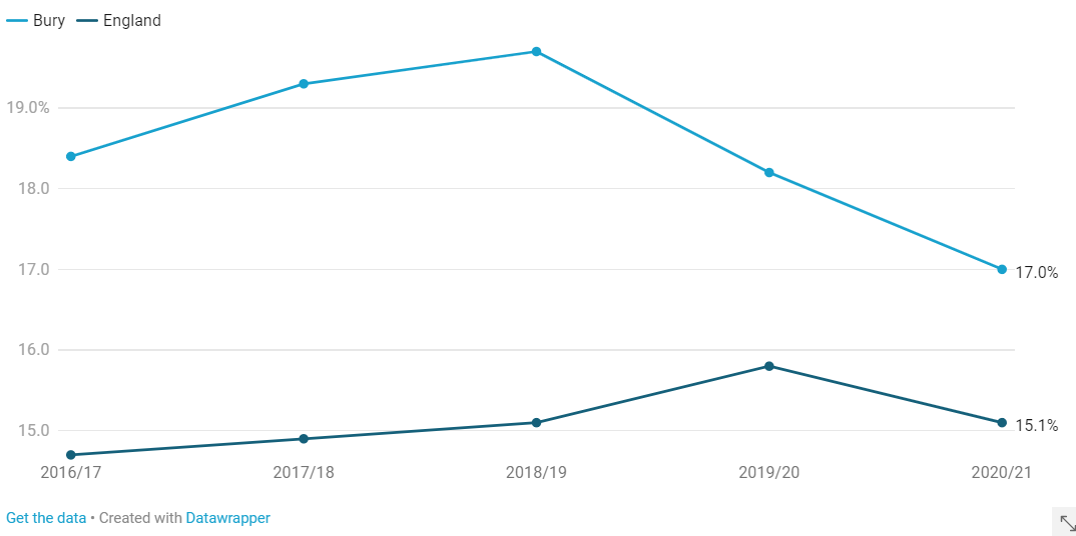
Bury is also significantly worse than England for the percentage of children aged under 16 living in relative low income families. Relative low income is defined as a family in low income Before Housing Costs (BHC) in the reference year. A family must have claimed one or more of Universal Credit, Tax Credits or Housing Benefit at any point in the year to be classed as low income in these statistics.
Relative low income sets a threshold as 60% of the UK average (median) income and moves each year as average income changes. It is used to measure the number and proportion of individuals who have income below this threshold. Despite Bury seeing a decrease in this measure since 2018/19, the percentage remains significantly higher at 21.5% for 2020/21 than the percentage in England for the same time period of 18.5% (Public Health Profiles).
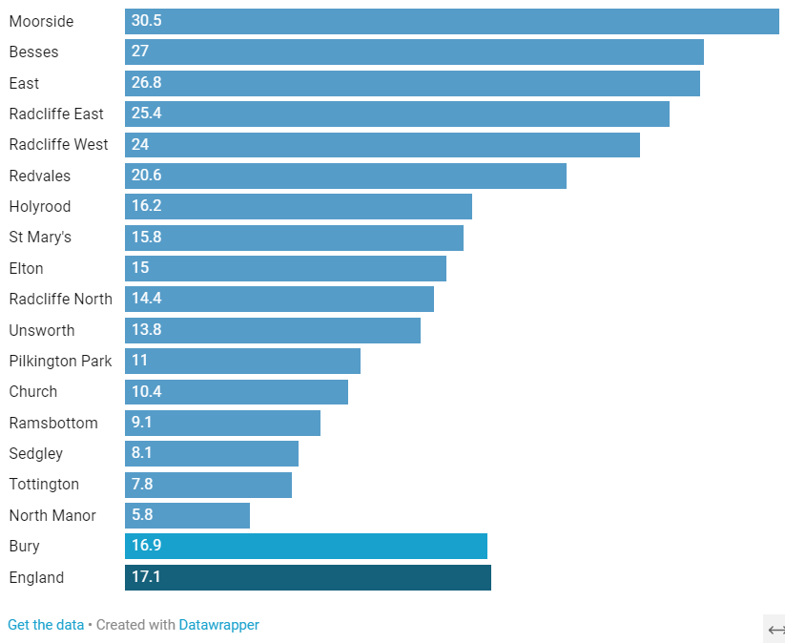
The Income Deprivation Affecting Children Index (IDACI) measures the proportion of all children aged 0 to 15 living in income deprived families. It is a subset of the Income Deprivation Domain which measures the proportion of the population in an area experiencing deprivation relating to low income. The definition of low income used includes both those people that are out-of-work, and those that are in work but who have low earnings (and who satisfy the respective means tests). Although the proportion of children in poverty in Bury (16.9%) is not significantly different to England (17.1%) in this measure for 2019, variations within Bury exist. Figure 4 below illustrates the difference across Bury for the percentage of children living in income deprived families, with Moorside ward having the highest levels of child poverty and North Manor the lowest (Public Health Profiles).
Figure 4: Child Poverty, Income deprivation affecting children index (IDACI), Proportion - %, Wards in Bury, 2019
Adults in Deprivation
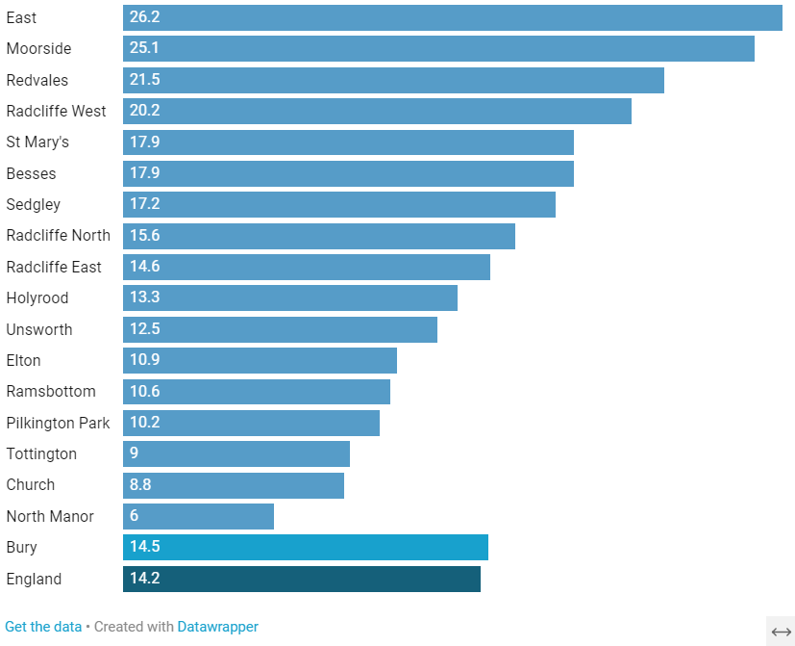
The Income Deprivation Affecting Older People Index (IDAOPI) measures the proportion of all those aged 60 or over who experience income deprivation.
It is a subset of the Income Deprivation Domain which measures the proportion of the population in an area experiencing deprivation relating to low income. The definition of low income used includes both those people that are out-of-work, and those that are in work but who have low earnings (and who satisfy the respective means tests). 14.5% of older people in Bury live in deprivation, which is significantly worse than the figure of 14.2% in England for 2019. According to these results, 6,312 people aged 60 or over living in Bury experience income deprivation. Bury has the 6th lowest percentage of older people living in deprivation when compared to its 15 other statistical neighbours. Figure 5 below highlights the variations within wards in Bury in this measure, with East ward having the highest levels of deprivation and North Manor the lowest (Public Health Profiles).