Ethnicity
Ethnicity
Ethnicity
-
 Ethnicity: an insight into ethic categories in Bury
Ethnicity
Health outcomes differ by ethnicity, although patterns of death and disease are more complex when looked at in terms of ethnicity than by deprivation. Local data on ethnicity and health are limited. National data from the Office for National Statistics (ONS) suggest that people of White and mixed ethnic backgrounds had lower life expectancy than other ethnic groups before the COVID-19 pandemic (King’s Fund, 2021). Part of the reason for this is the so-called ‘healthy migrant effect’: recent migrants tend to be healthier than average for the countries they move to (because ill people tend not to move countries).
The COVID-19 pandemic hit many ethnic minority communities harder, driving overall death rates higher in Bangladeshi and Pakistani men and women and Black Caribbean men and equalising death rates among other ethnic groups (Public Health England, 2020). This is likely due to a combination of factors, such as greater employment in work that could not be done from home and with limited sick-pay entitlements, higher levels of overcrowded housing, and of long-term illnesses.
Local data on inequalities in health by ethnicity are limited because ethnicity is not recorded on death certificates and is often poorly captured in health systems. National data from the ONS suggest that people of Christian, Jewish, and Hindu faiths are more likely to say they are satisfied with their health. Christians, Hindus, and Sikhs also report better mental health. However, Muslim respondents reported worse physical health, and people of no faith are more likely to smoke (Office for National Statistics, 2020).
Variations in health by ethnicity are intertwined with those by deprivation, as well as a complex interplay of social, economic, cultural, and environmental factors. For instance, ethnic minority groups are more likely to live in deprived areas, experience discrimination, face language barriers, and encounter cultural differences in healthcare services, which may impact their access to healthcare and health outcomes.
This section presents a detailed breakdown of the ethnicity for Bury, encompassing broad ethnic categories, detailed ethnic categories, and geographical distribution. It includes a comparison of the ethnicity data from Census 2021 and Census 2011, with a view to shedding light on the changes that have emerged over the 10-year period.
Ethnic breakdown in Bury:
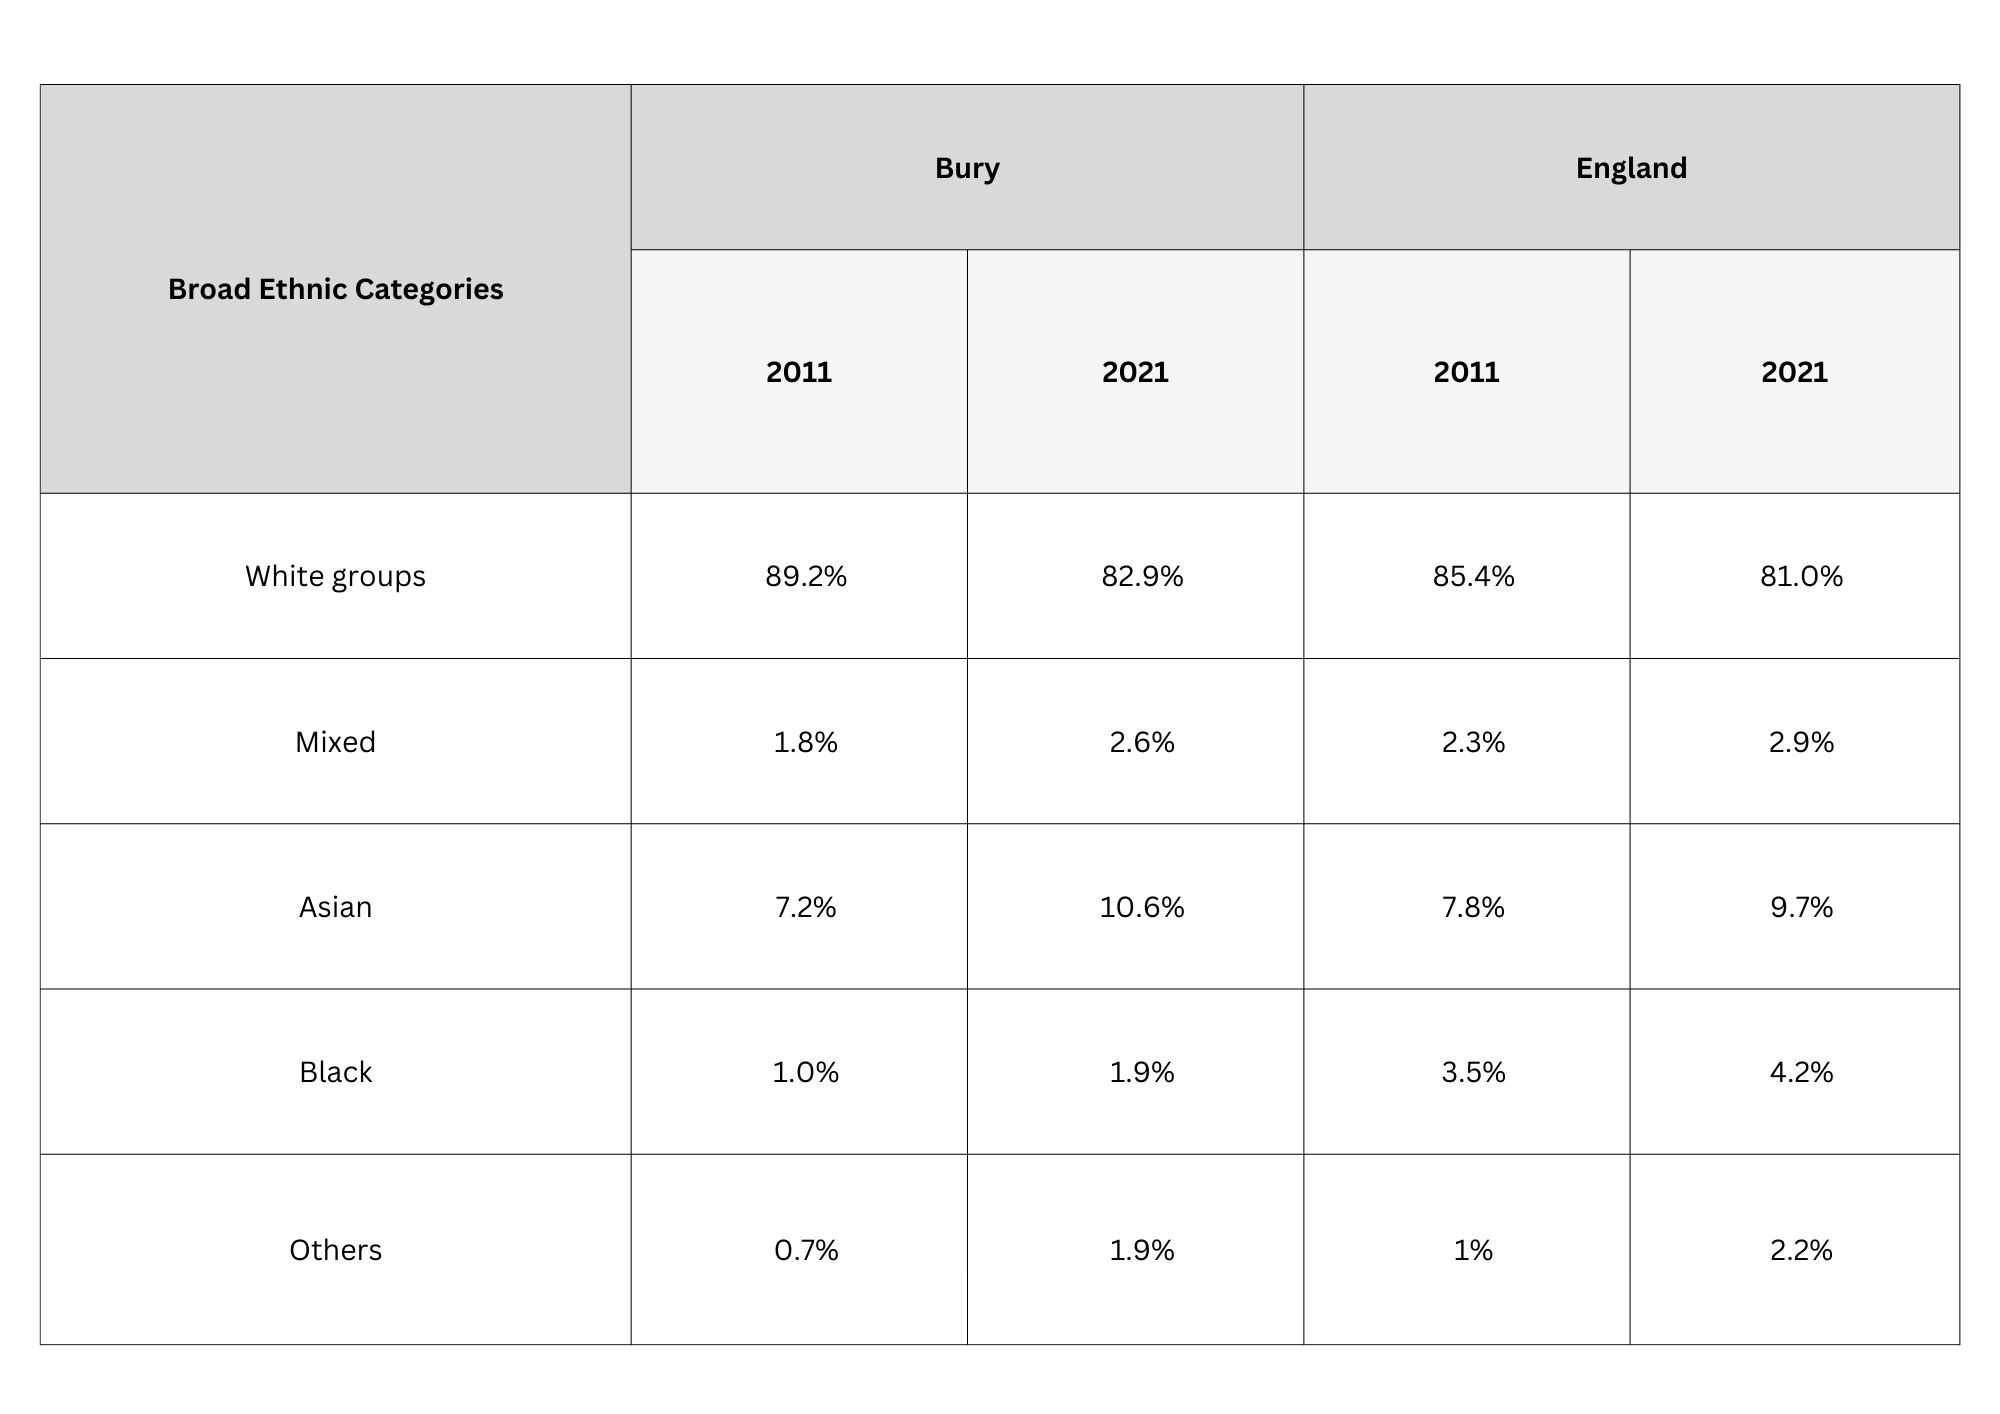
According to the 2021 census results, the majority of Bury's resident population (160,716 individuals, representing 82.9%) identified their ethnic group within the high-level “White” category, which is 1.9% higher than the national figure of 81% for England. Notably, this figure represents a significant decrease of 6.3% from the previous census conducted in 2011, when 89.2% of Bury's usual residents identified as "White." This reduction is consistent with the nationwide trend, which saw the proportion of the population identifying as "White" decrease from 85.4% in 2011 to 81% in 2021.
There have been significant changes to other ethnic groups in Bury. High-level “Asian” category constitutes the second largest ethnic group in Bury for both Census 2021 and Census 2011. “Asian” ethnic category saw the highest increase from 7.2% in 2011 to 10.6% in 2021. This change was slightly higher than England, where residents identifying within the high-level Asian category increased from 7.8% in 2011 to 9.7% in 2021 (Table 1).
Table 1: Percentage of population by Broad ethnic categories in Bury and England for Census 2011 and 2022.1.
-
 To download a copy of this table, please left click the button below or use the 'Related Files' section located at the bottom of the page.
Examining the change in numbers for broad ethnic categories, Asian population in Bury has seen the biggest increase, growing by 7,186 residents over the ten-year period between Census 2011 and 2021 (53.6% increase). On the other hand, there are 4316 fewer residents identifying as White (2.36 decrease).
Figure 1: Change in broad ethnic categories (n) between Census 2011 and Census 2021
-
-between-Census-2011-and-Census-2021.jpg) To download a copy of this chart, please left click the button below or use the 'Related Files' section located at the bottom of the page.
To download a copy of this chart, please left click the button below or use the 'Related Files' section located at the bottom of the page.
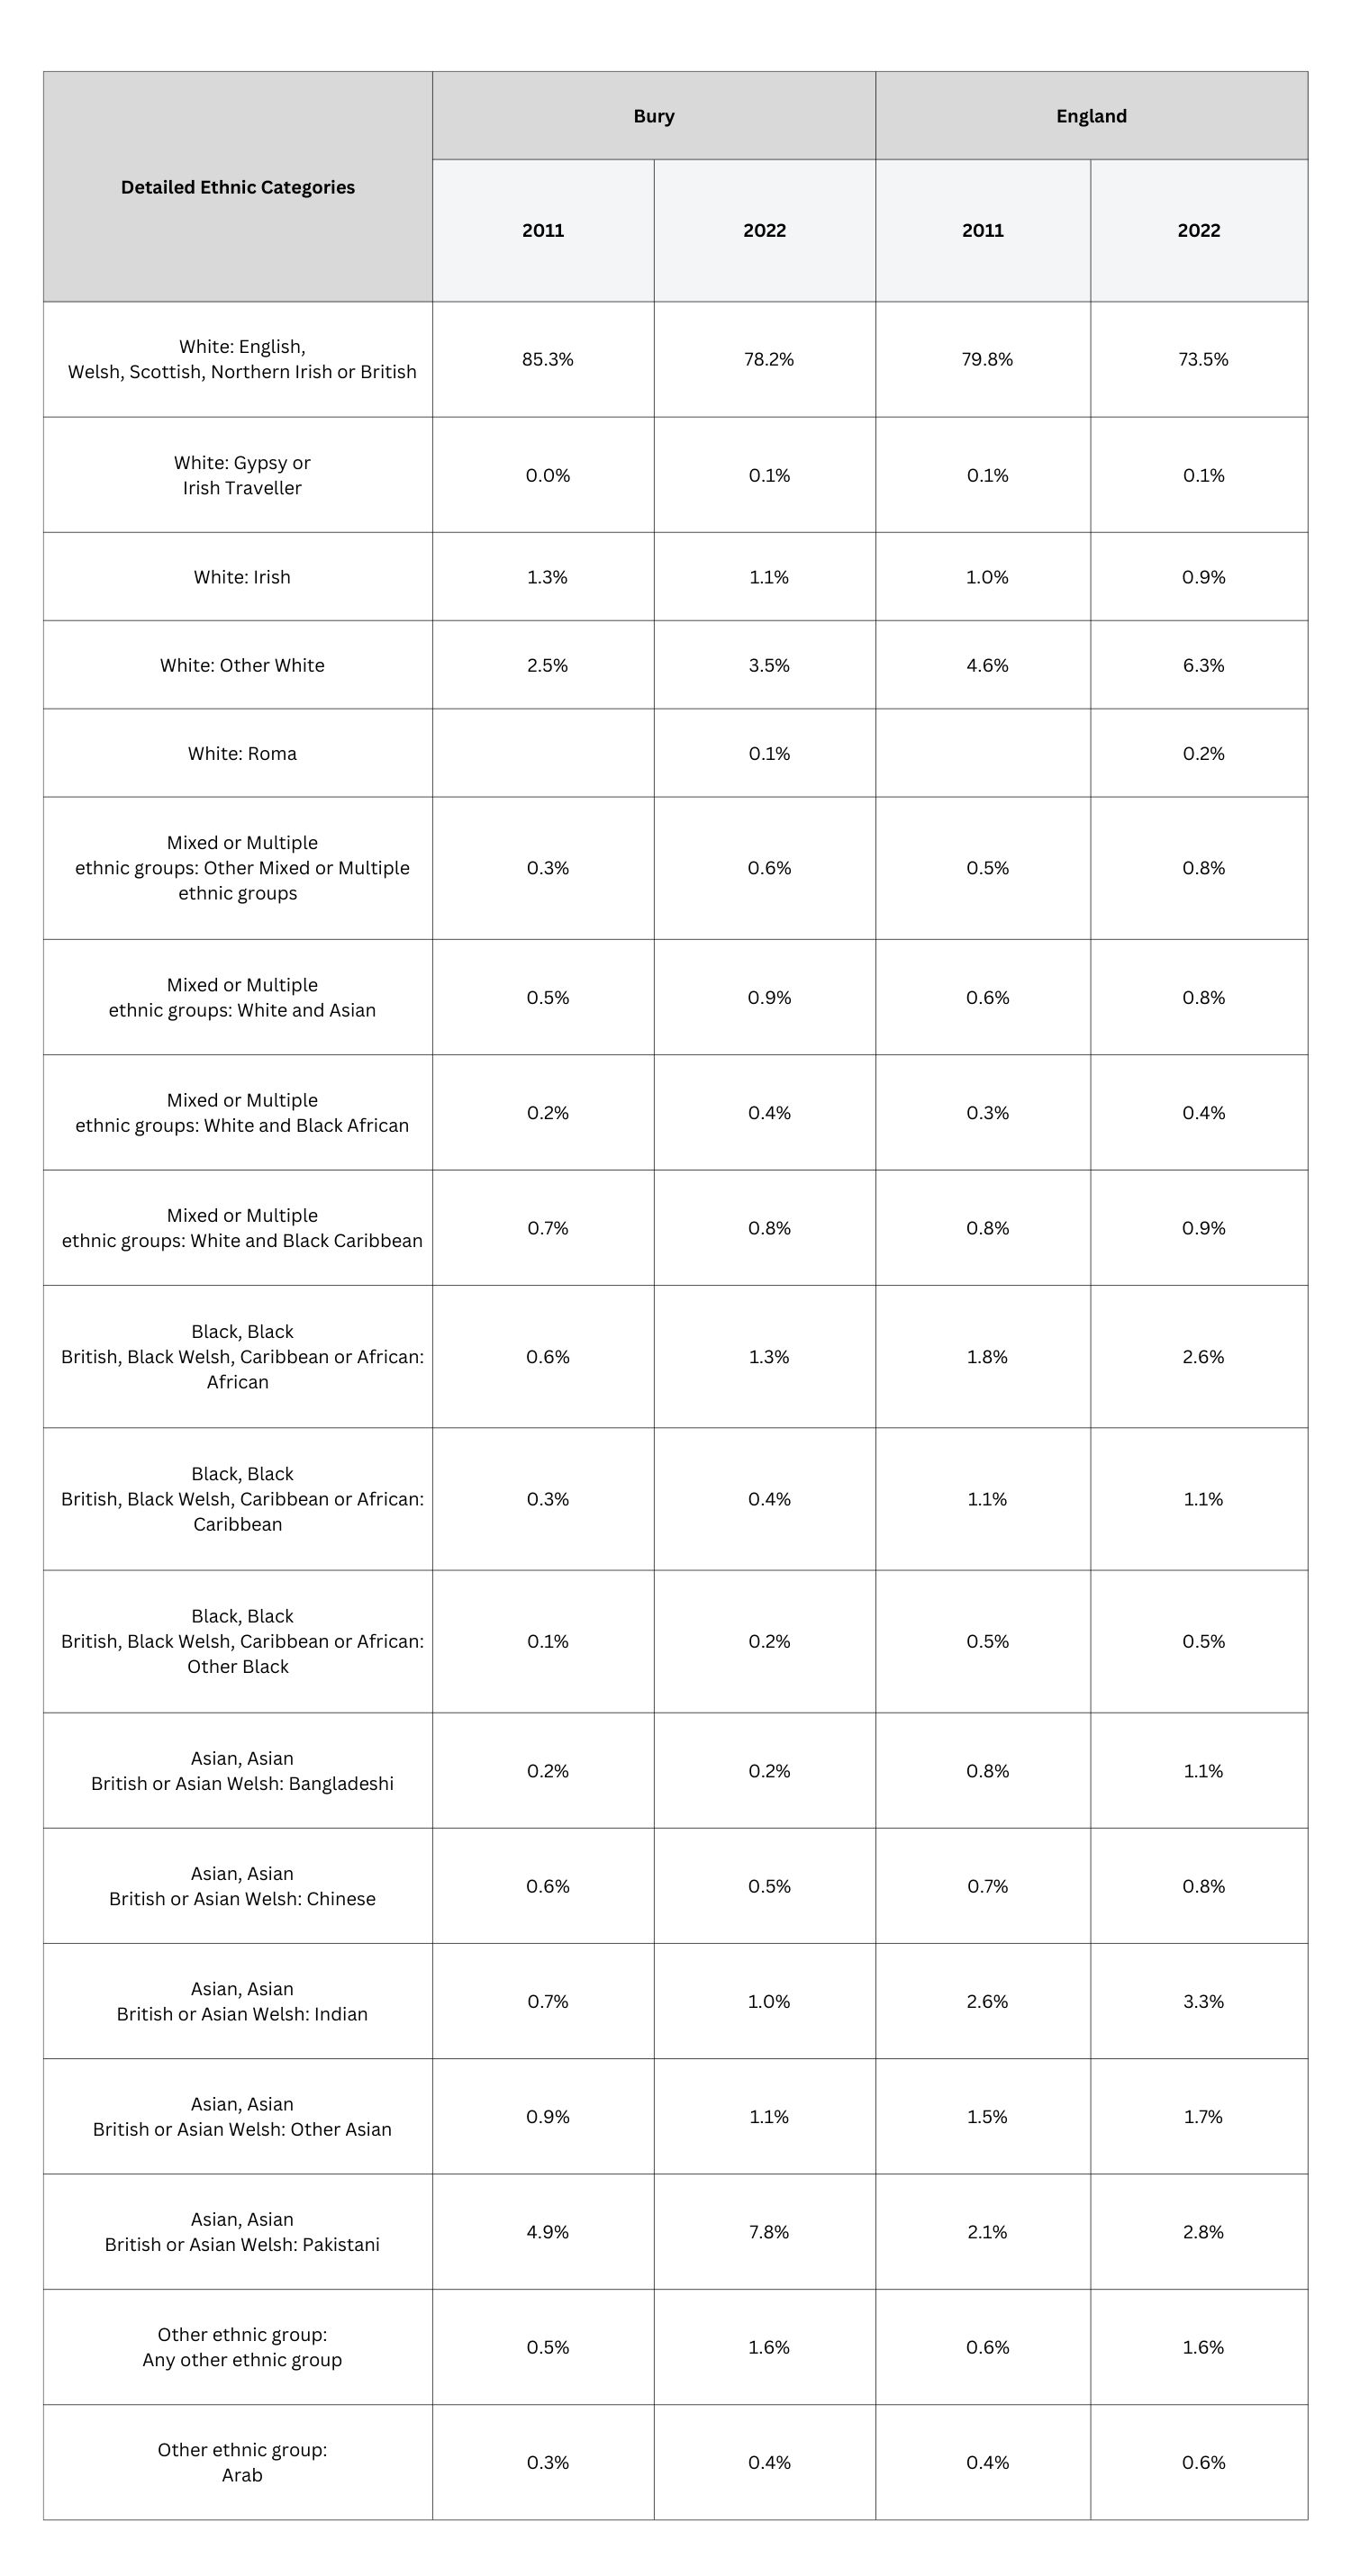
Looking across detailed ethnic categories in Bury, 78.2% of the total population in 2021 identified as "English, Welsh, Scottish, Northern Irish or British," indicating a decrease from 85.3% in 2011. This figure is relatively higher than the corresponding national figures, as only 73.5% of the total population in England identified their ethnic group as "White: English, Welsh, Scottish, Northern Irish or British" in 2021, compared with 79.8% in 2011.
Asian, Asian British, or Asian Welsh: Pakistani ethnic category in Bury has risen from 4.9% in 2011 to 7.8% in 2021, making it the second-highest detailed ethnic category in Bury. This number exceeds the corresponding percentage in England, where 2.8% of the population in 2021 (up from 2.1% in 2011), identified as Asian, Asian British, or Asian Welsh: Pakistani. It is noteworthy that Bury differs from England's second-highest detailed ethnic category, "White: Other White," which saw a population increase from 4.6% in 2011 to 6.3% in 2021 (Table 2)
Table 2: Percentage (%) of population by detailed ethnic categories in Bury and England for Census 2011 and 2022.
-
 To download a copy of this table, please left click the button below or use the 'Related Files' section located at the bottom of the page.
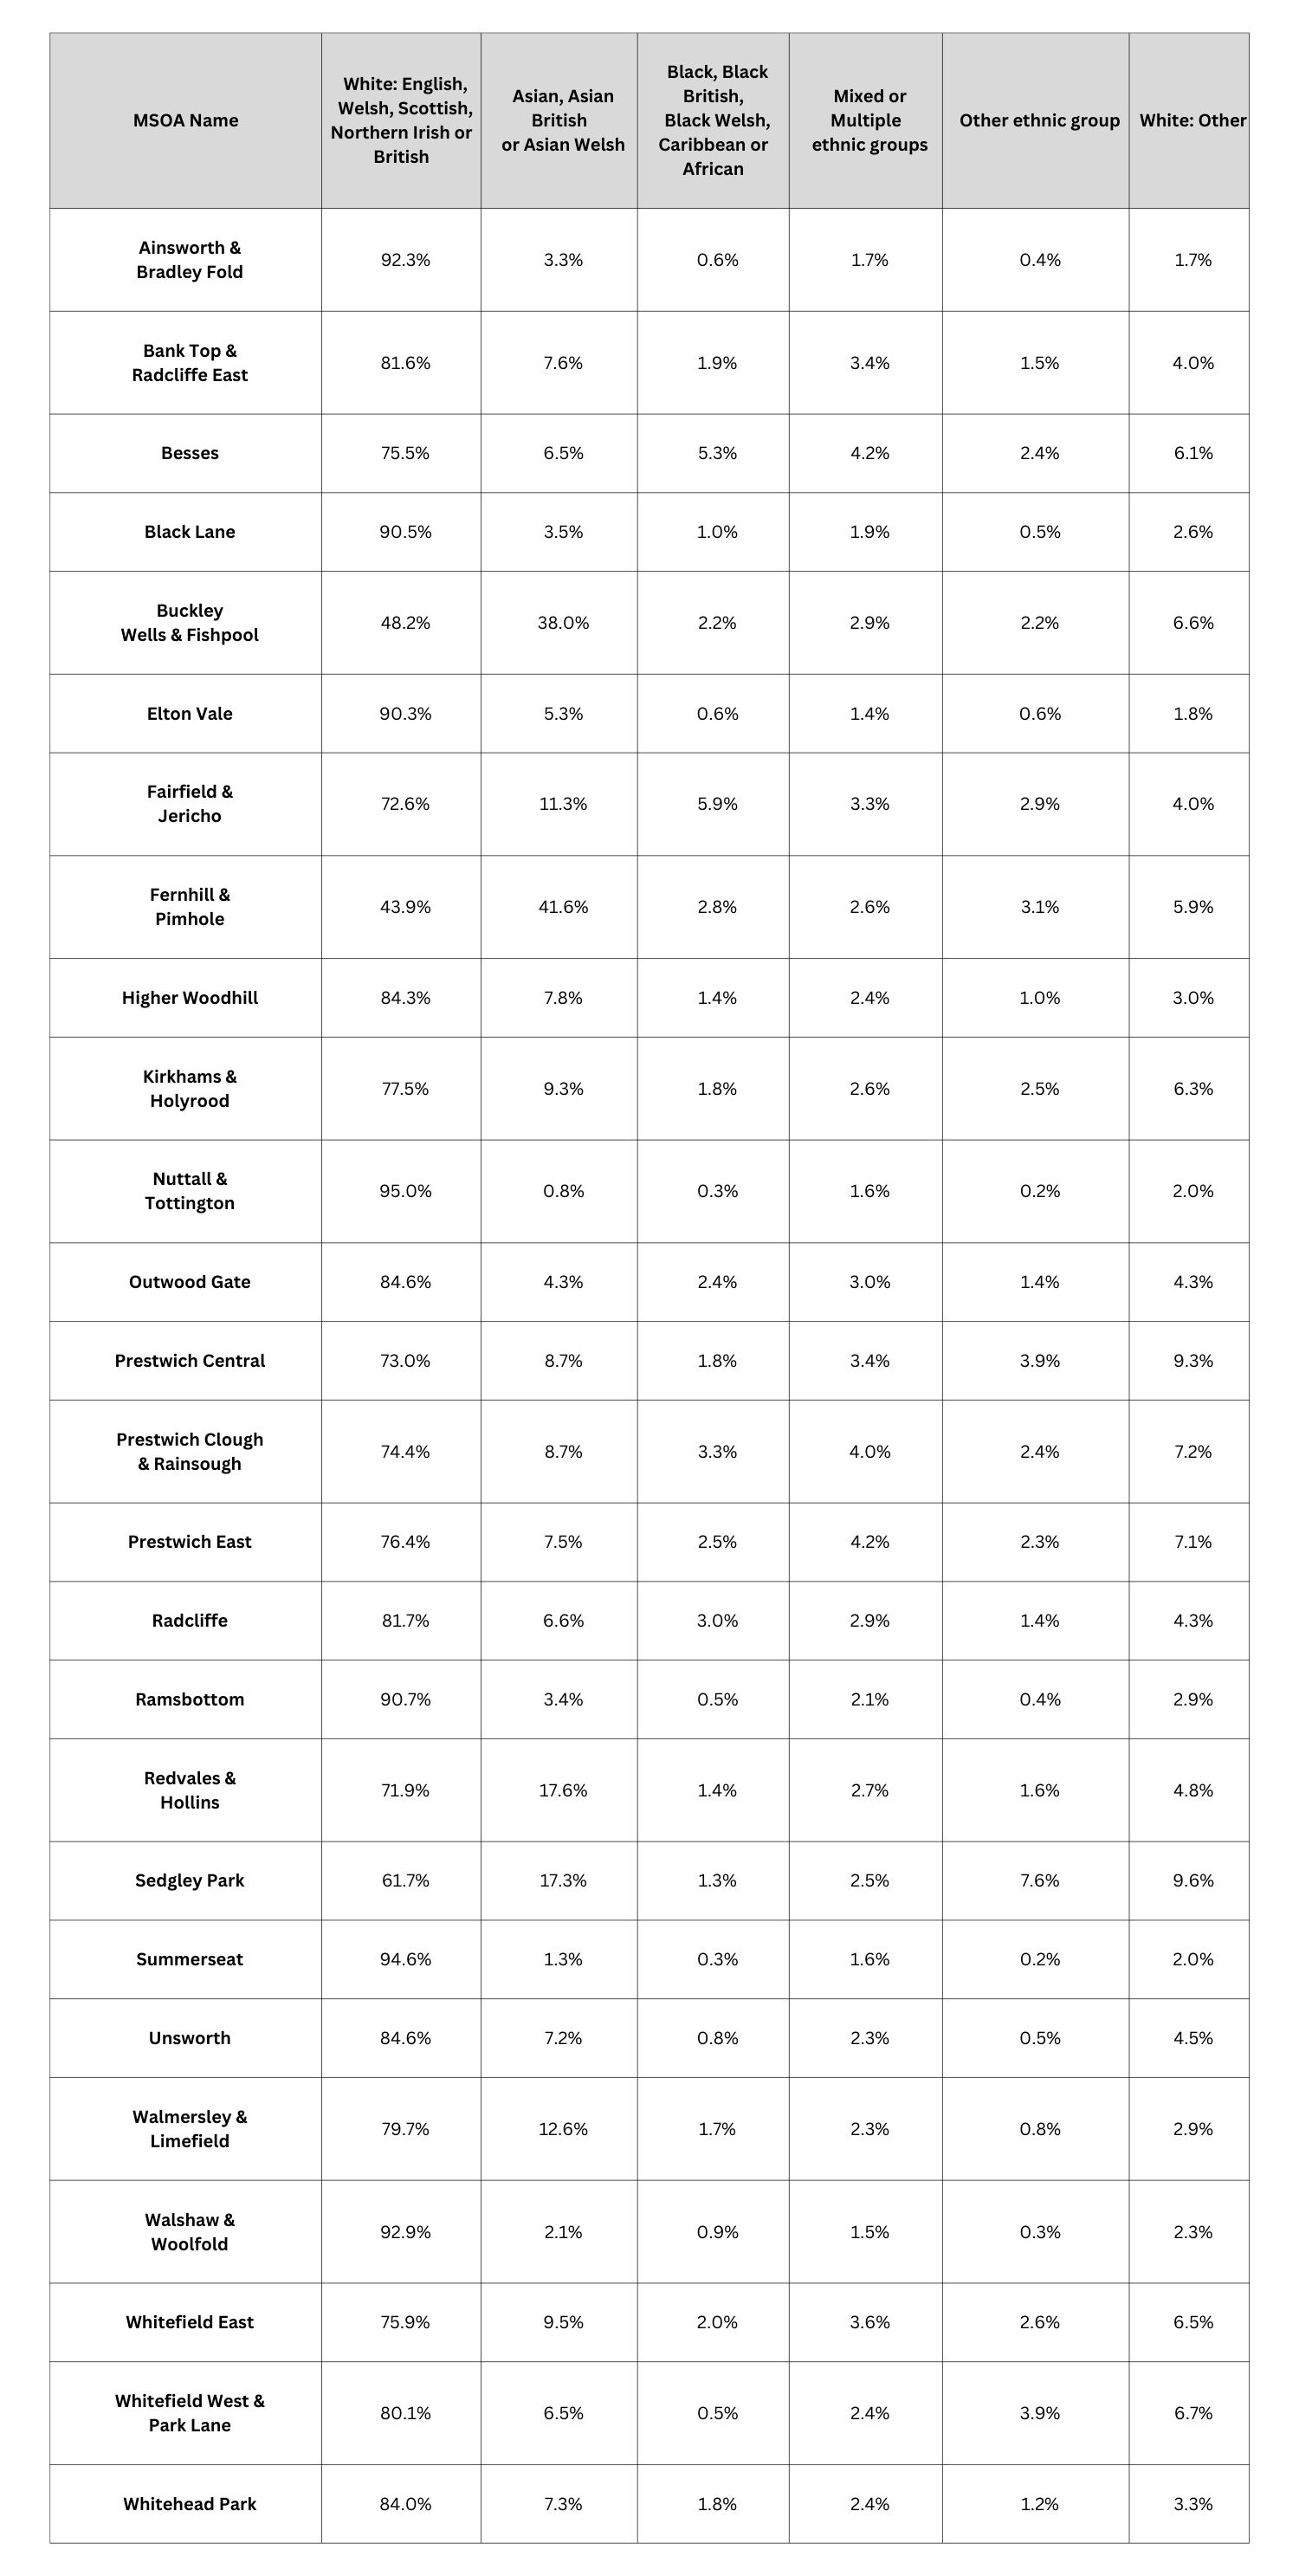
There are wide variations when examining data by Broad ethnic categories across the 26 MSOAs in Bury. (Table 3)
Table 3: Percentage (%) of population by Broad ethnic categories across 26 MSOAs in Bury
-
 To download a copy of this table, please left click the button below or use the 'Related Files' section located at the bottom of the page.
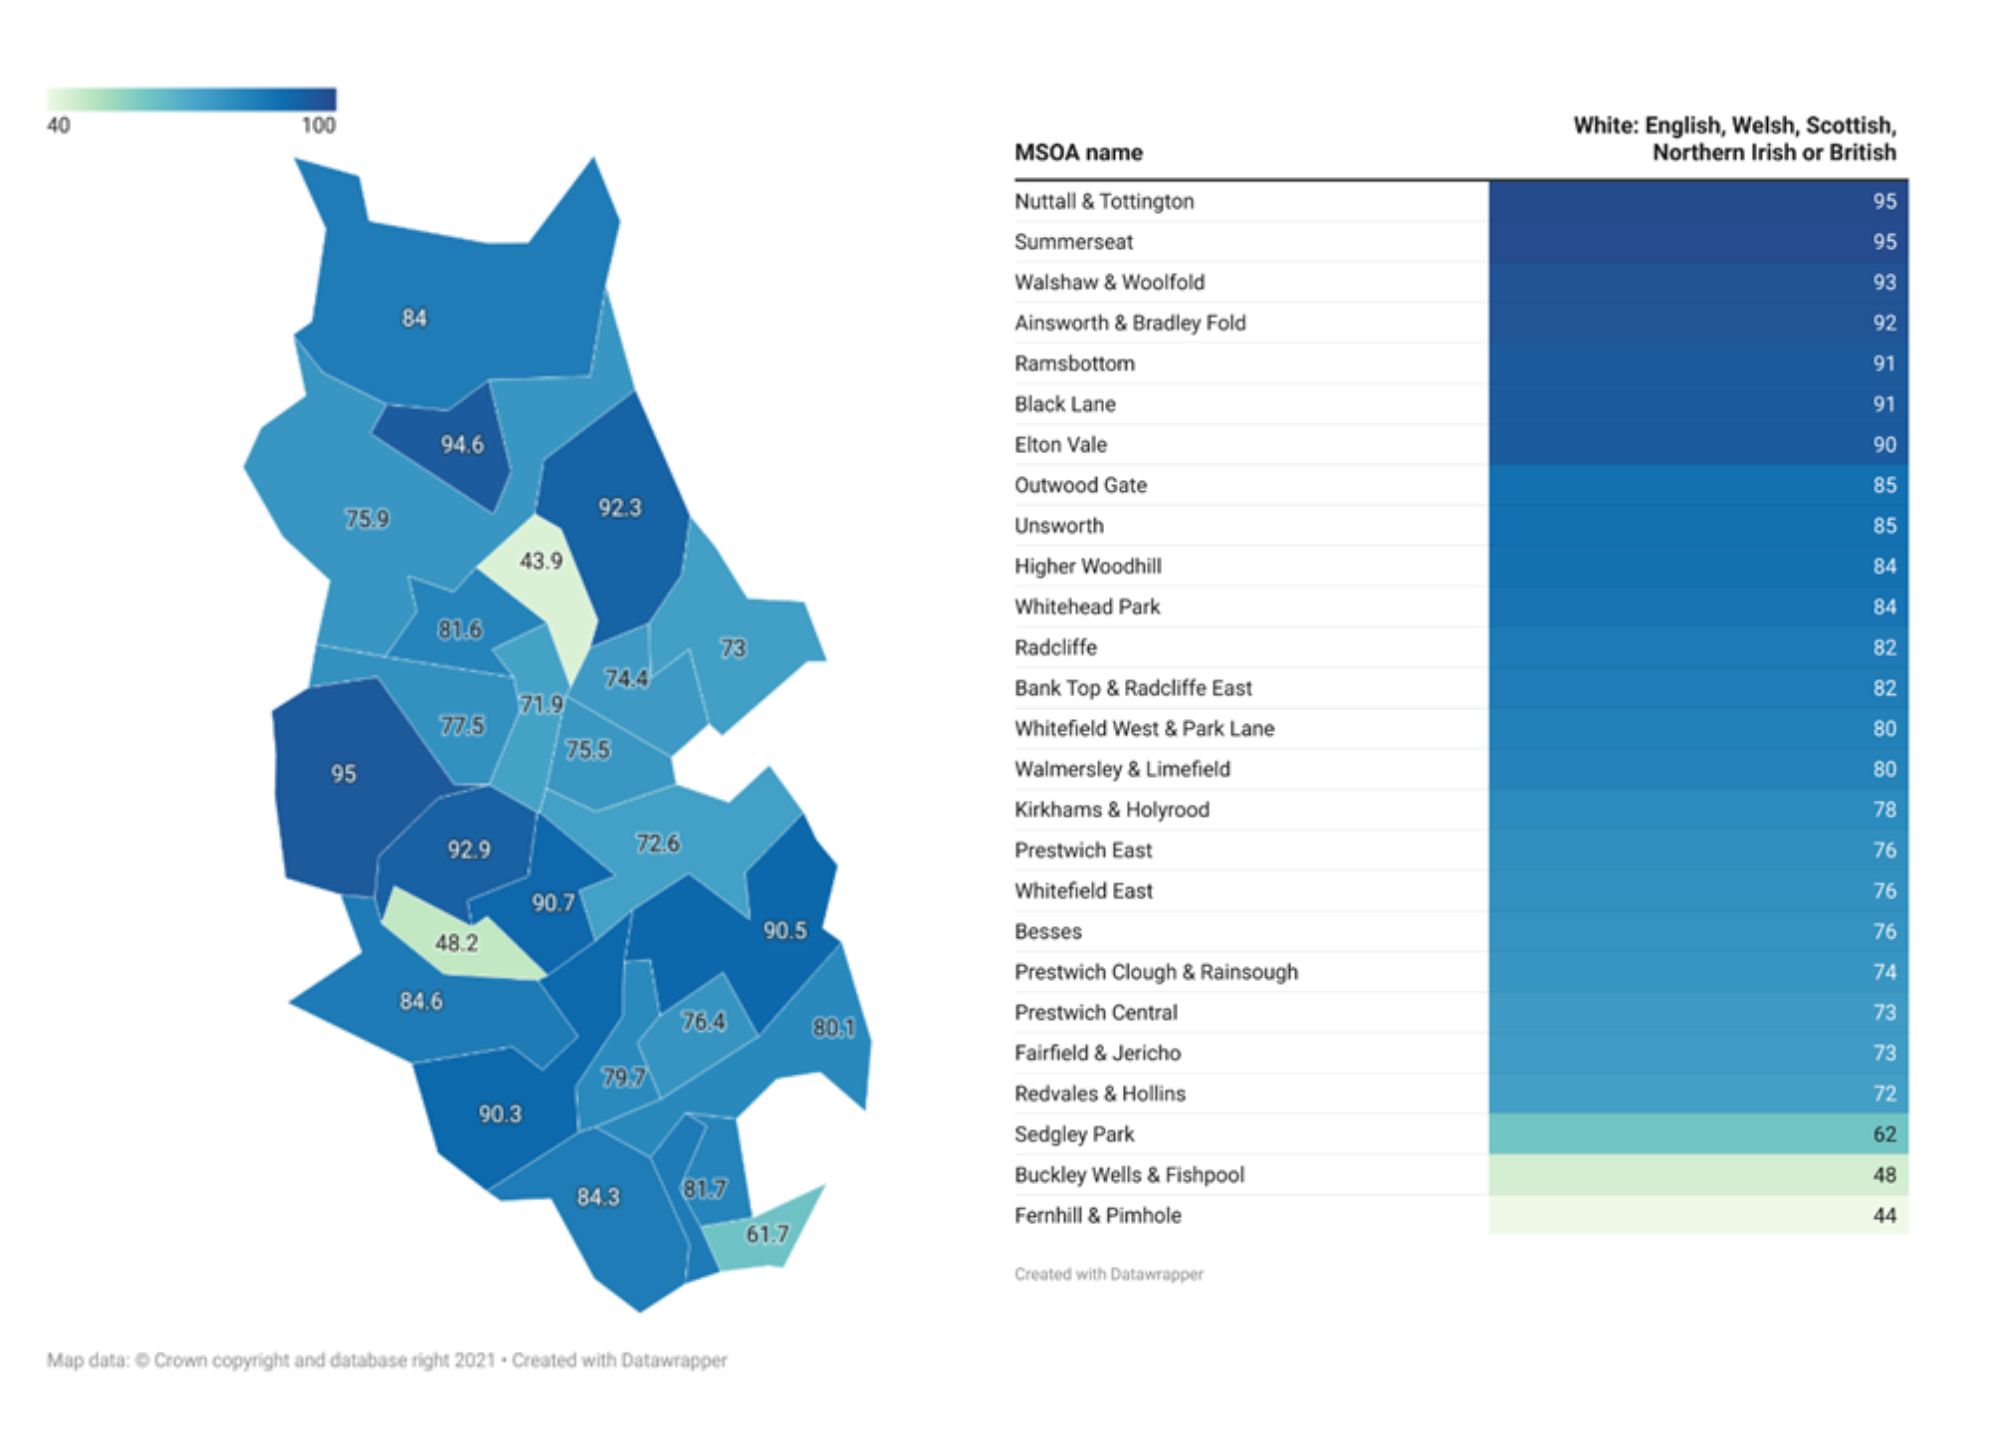
The MSOA’s with the highest proportion of residents reporting their ethnicity as “White: English, Welsh, Scottish, Northern Irish or British” are Nuttall & Tottington (95%), closely followed by Summerseat (94.6%) and Ainsworth & Bradley Fold (92.3%) (Figure 3)
Figure 2: Percentage (%) of residents in Bury identifying with White: English, Welsh, Scottish, Northern Irish or British” broad ethnic category
-
 To download a copy of this diagram, please left click the button below or use the 'Related Files' section located at the bottom of the page.
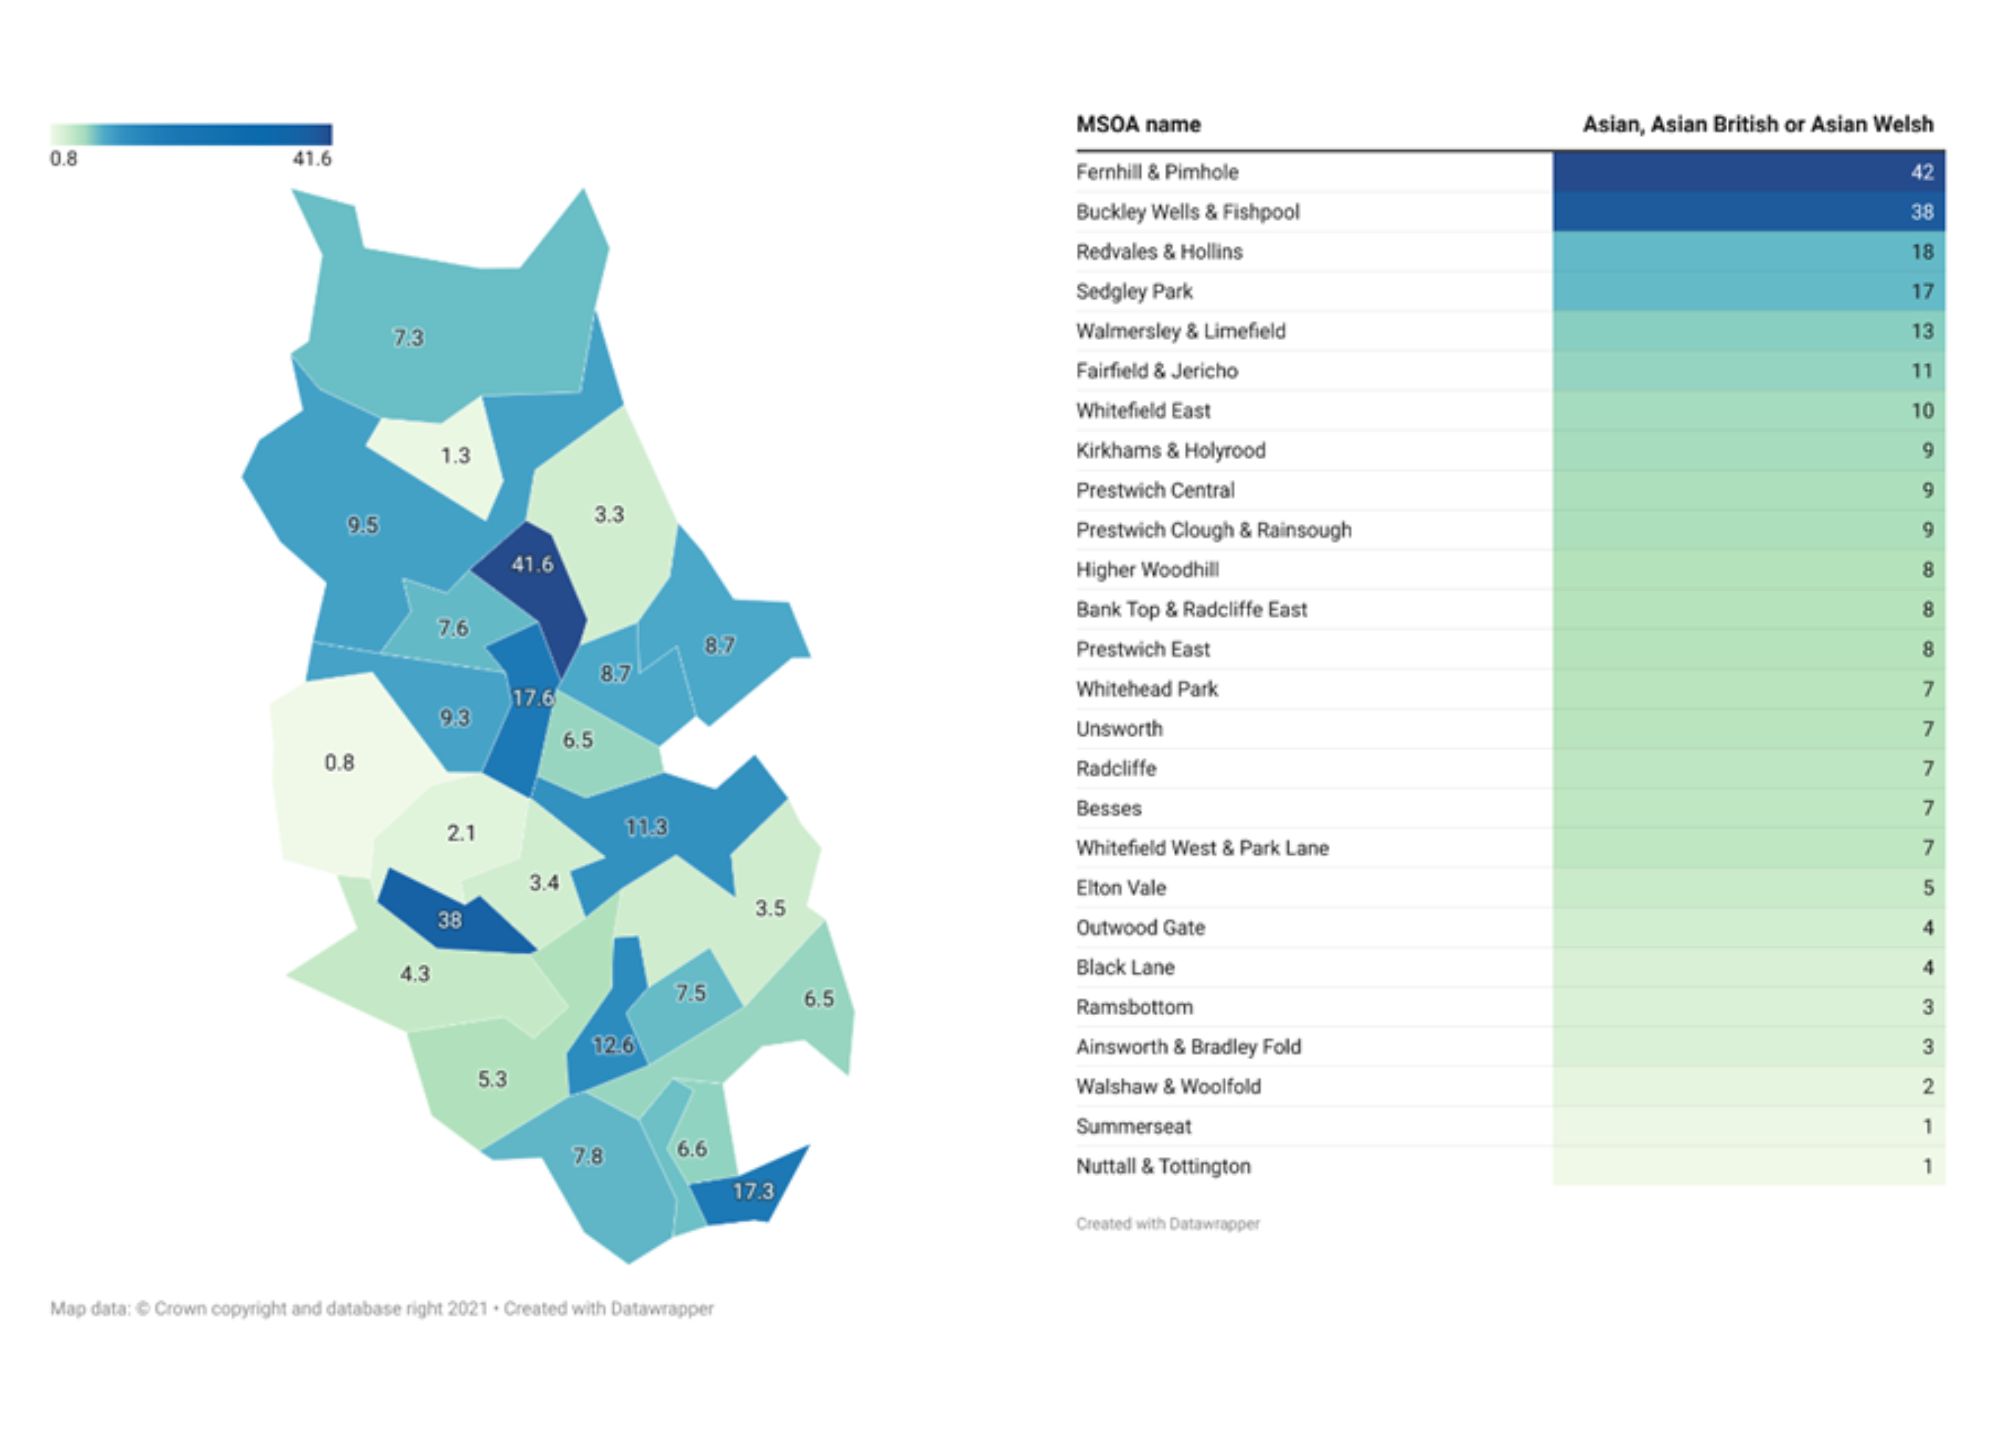
The highest proportion of residents in Bury who identify their ethnicity as “Asian, Asian British or Asian Welsh” live in Fernhill and Pimhole (41.6%) and Buckley Wells & Fishpool (38%) (Figure 4).
Figure 3: Percentage (%) of residents in Bury identifying with “Asian, Asian British or Asian Welsh” broad ethnic category
-
 To download a copy of this diagram, please left click the button below or use the 'Related Files' section located at the bottom of the page.
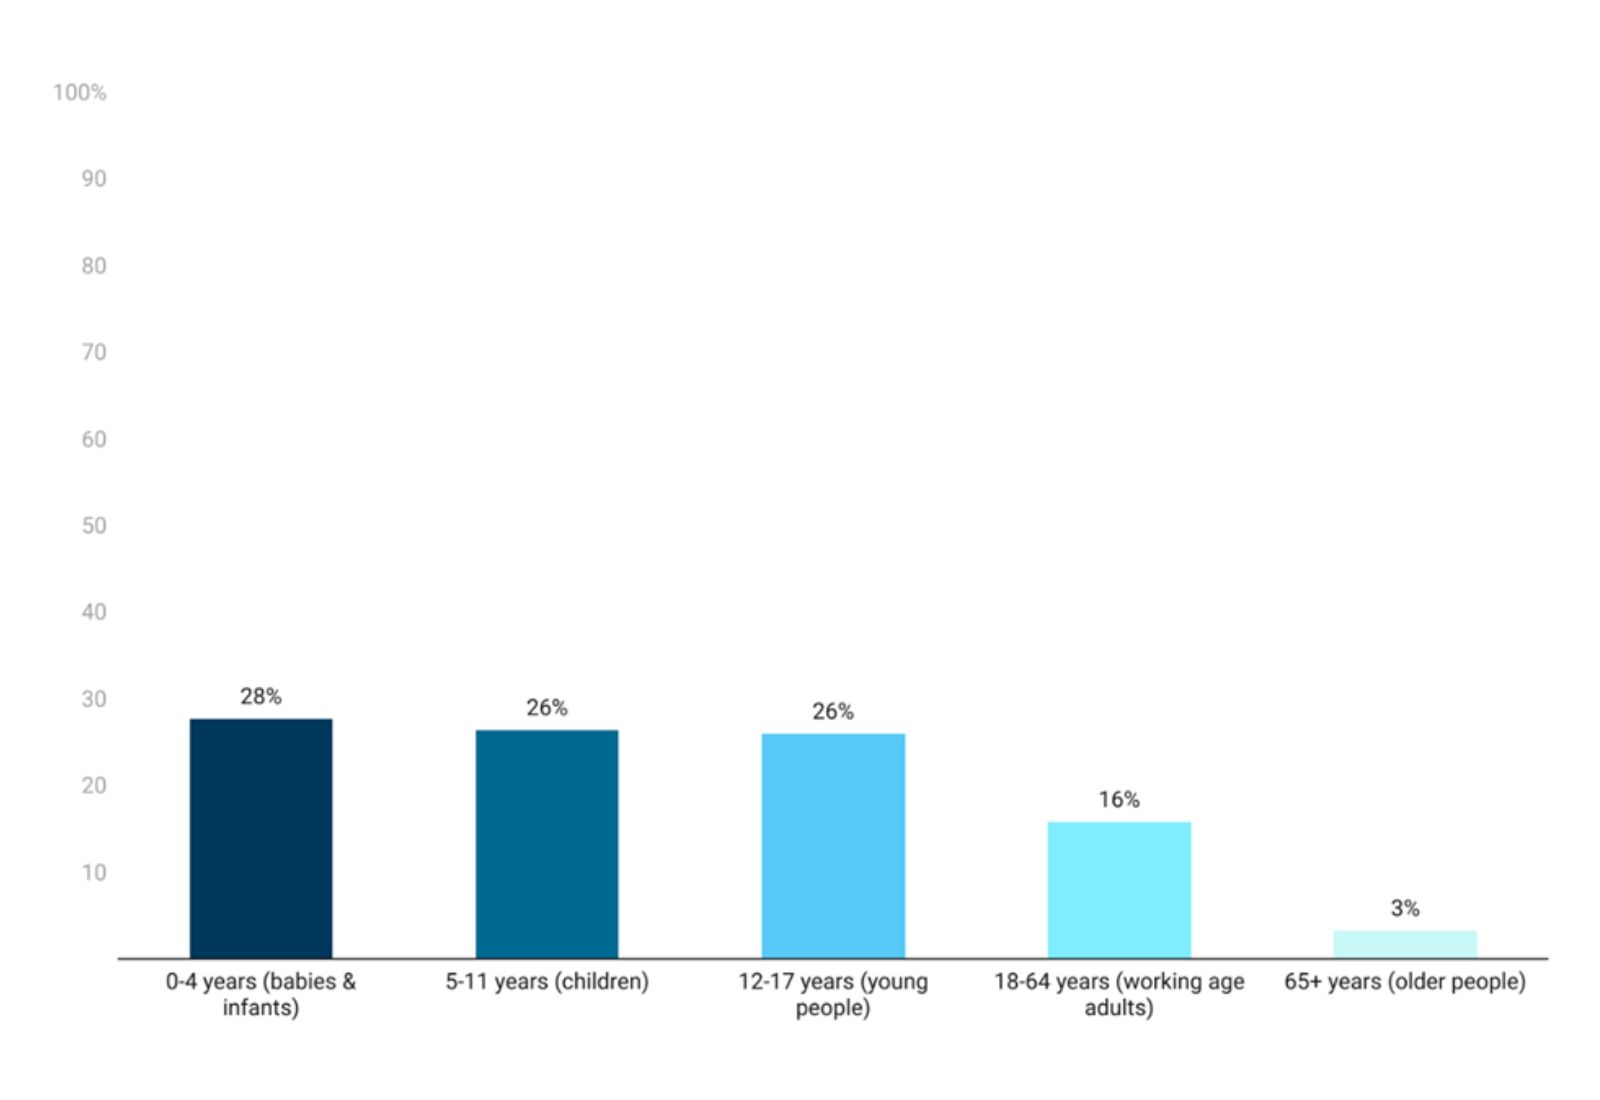
The non-white population in Bury have a younger age structure than Bury’s population as a whole. Among children and young people aged under 5 years, nearly 1 in 4 (28%) belonged to a non-white group, compared with around 1 in 30 (3%) among those aged 65 years and over (Figure 5).
Figure 4: Percentage belonging to a non-white category by broad age groups in Bury
-
 To download a copy of this diagram, please left click the button below or use the 'Related Files' section located at the bottom of the page.