Ageing Well
Ageing Well
Ageing Well
Population ageing occurs when a country’s median age goes up, normally through a combination of people living longer and declining birth rates. The concept of ageing well, which is based on a nonmedical approach to promoting health and well-being, is fundamental to increasing length and quality of life. Ageing well promotes personal behaviours and life-course environments that limit functional declines, especially those caused by chronic conditions, to help older adults maintain their independence and health. Ageing well emphasises the idea that people can maintain satisfying and healthy lives as they age by exercising the choices that optimize healthy, active, and secure lives. It is a dynamic, interactive process that creates long-term, positive change by involving individuals in the physical, social, economic, historical, and cultural contexts of their environments.
In this section of the life course, we will present and explain data on demographics and mortality, health, risks, care and support needs, well-being and wider determinants of health.
By examining these factors, we can develop a deeper understanding of the needs and priorities of our older adults. The findings can inform evidence-based decision-making, allowing for targeted strategies and resource allocation for our older population groups. This assessment serves as a roadmap to address the identified gaps in service provision and promote healthy ageing within the community. By prioritising healthy ageing and addressing the unique needs of older adults, we can create a supportive environment that allows older adults to lead fulfilling lives as they age.
Demographics
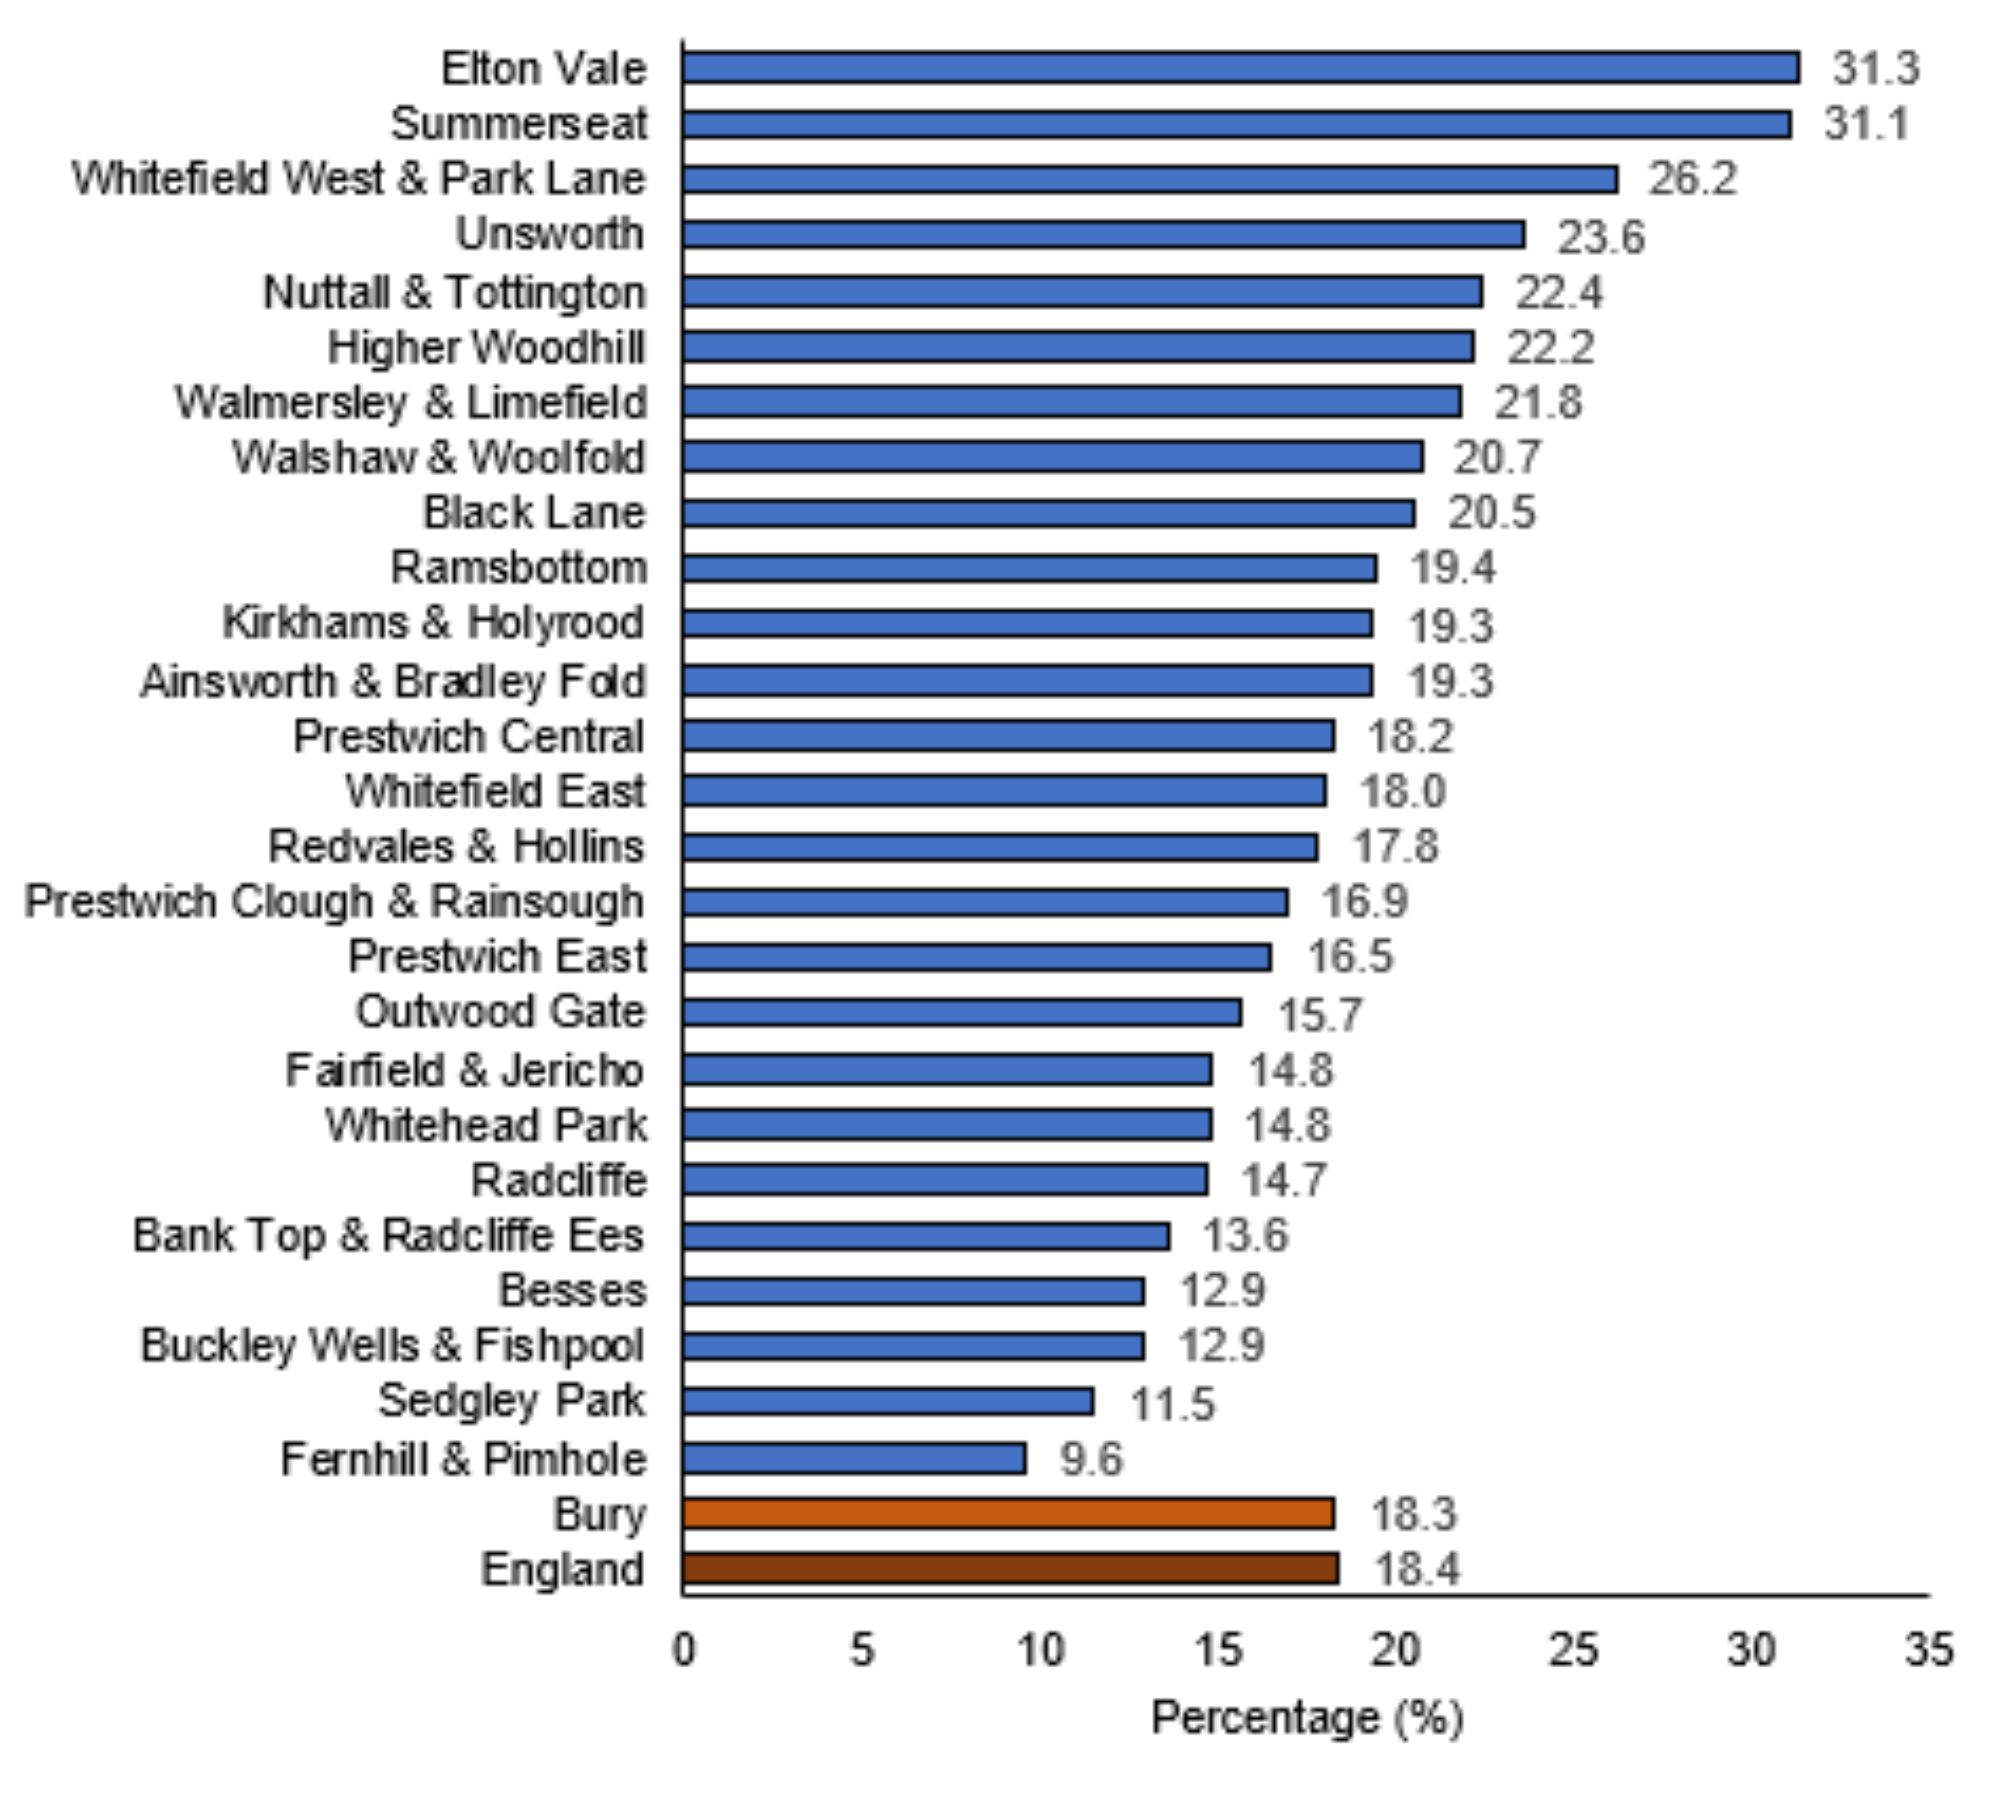
There are 35,447 (18.3%) older adults aged 65 years and over in Bury, similar to England average of 18.4%. Elton Vale (31.3%) and Summerseat (31.1%) have the highest proportion and Fernhill and Pimhole (9.6%) have the lowest proportion of older adults in Bury. Figure 1 below presents the proportion of population aged 65 years and over living in each Middle Super Output Area (MSOA) in Bury as a percentage of the total population in that MSOA.
Figure 1: Proportion of population aged 65 years and over living in each Middle Super Output Area (MSOA) in Bury as a percentage of the total population in that MSOA
Population change in Bury for adults aged 65 years and over comparing Census 2021 to Census 2011
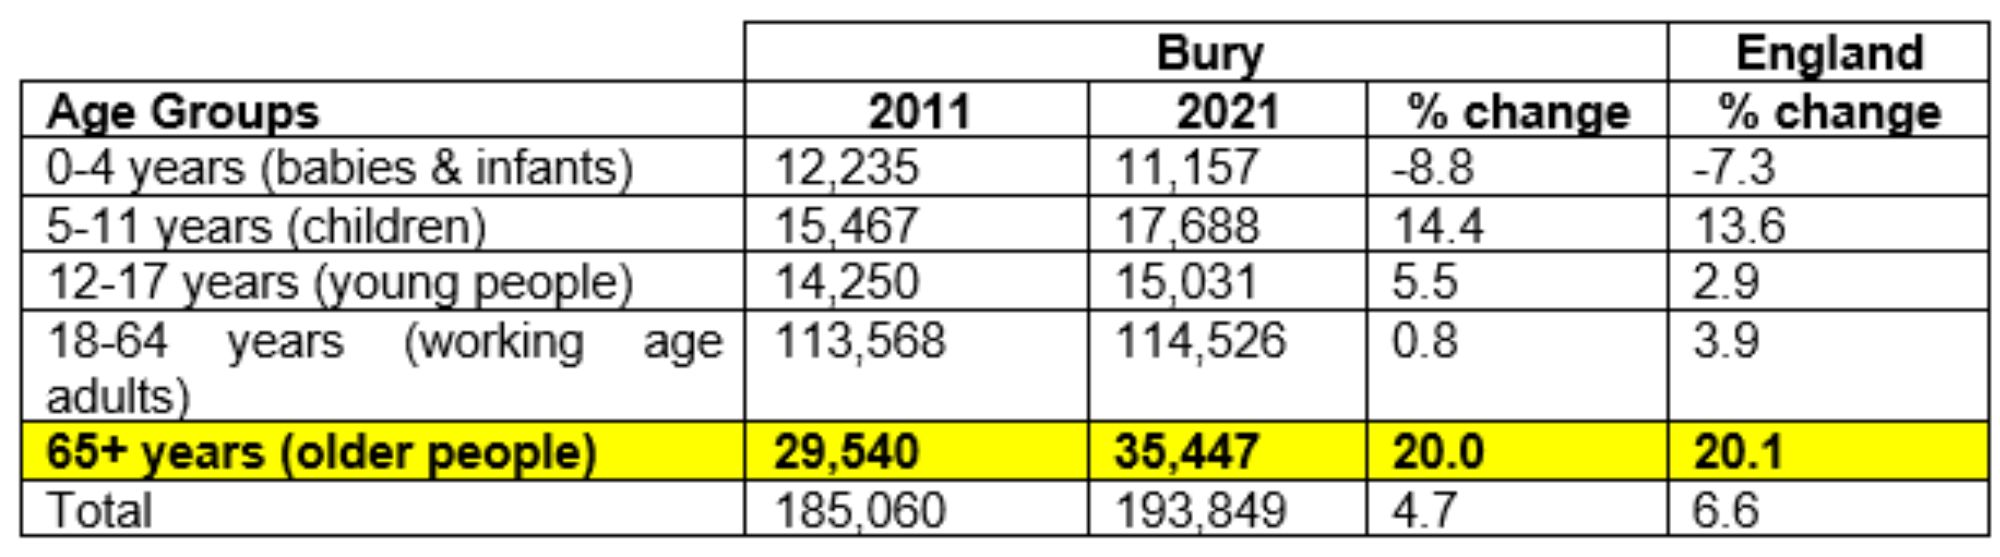
The population change in Bury is not uniform across all age groups. Bury population has continued to age. Census 2021 results show that there has been an increase of 19.8% in people aged 65 years and over in Bury similar to 20.1% seen in England. The largest percentage change was a 20.1% increase in the 65 years and over age group, followed by a 13.6% increase in 5-11 years age group. Conversely there was a percentage decrease in the number of babies and infants (-7.3%).
Table 1 below presents Bury ‘s population by broad age group with percentage change across these groups and comparison with England between Census 2011 and Census 2021.
Table 1: Bury‘s population by broad age group with percentage change across these groups and comparison with England between Census 2011 and Census 2021.
Sex
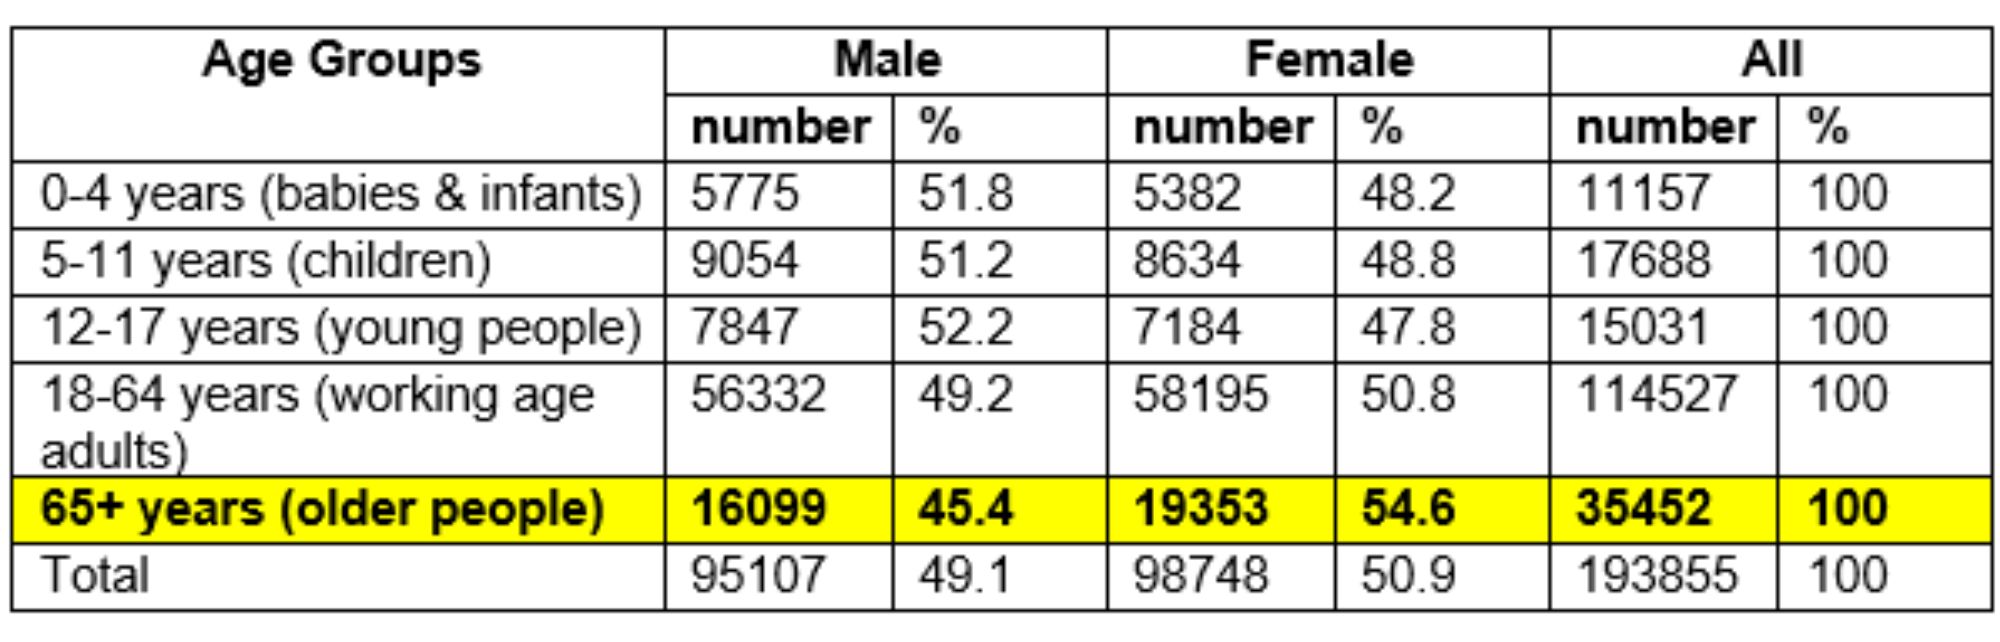
Based on the results of Census 2021 for Bury, the highest difference by sex is in the 65+ age group (older people), where there are 3,254 more females compared with males. On average, females currently live longer than males (see Life expectancy), which significantly impact the sex profile of Bury’s population
Table 2: Number and percentage of Male and Female residents by Broad age groups in Bury
Population Projection:
Older adults in Bury are expected to see the biggest increase of 15.4% with an additional 5,617 older adults between the years 2023 to 2032. During the same time period, England is expected to see an ever greater increase of 21.4% in older adults.
Life expectancy at 65 years of age
Life expectancy at 65 years of age measures how long an individual who has reached the age of 65 years can expect to live on average. This assumes that age-specific mortality levels remain constant. Several factors are taken into account for this indicator including disease prevalence, mortality rate and healthcare access indicators. Measuring LE at 65 years provides important information about the health and well-being of older adults who now make up an increasing proportion of population in majority of countries. This information can inform a number of programmes and policies related to ageing and healthcare.
For example, if life expectancy at 65 years is increasing over time, this may suggest improvements in healthcare, prevention of diseases, and overall population health. This information may help local stakeholders and policymakers to plan for the needs of an ageing population, such as promoting healthy ageing behaviours, supporting caregivers and other age well services. On the other hand, if life expectancy at 65 is decreasing, this may suggest that there are health or social issues affecting older adults that need to be addressed. For example, if there is a higher prevalence of chronic diseases or social isolation among older adults, this may lead to lower life expectancy at 65. Understanding these issues can help develop targeted interventions to improve the health and well-being of older adults.
Examining data for Bury, LE at 65 years for both male and female follows a similar pattern as that observed in LE at birth for male and female. LE at 65 years have increased over the past two decade, however females have consistently higher life expectancy at 65 than males throughout the years from 2001 to 2020. The life expectancy for both males and females was highest in the period 2017-19, with females having a life expectancy at 65 years of 20.5 years and males having a life expectancy of 18.5 years. LE at 65 years saw a slight decline in 2018-2020 compared with the previous time period 2017-19 of 18.1 years in males and 20.2 years in females.
Life expectancy at 65 years – Male
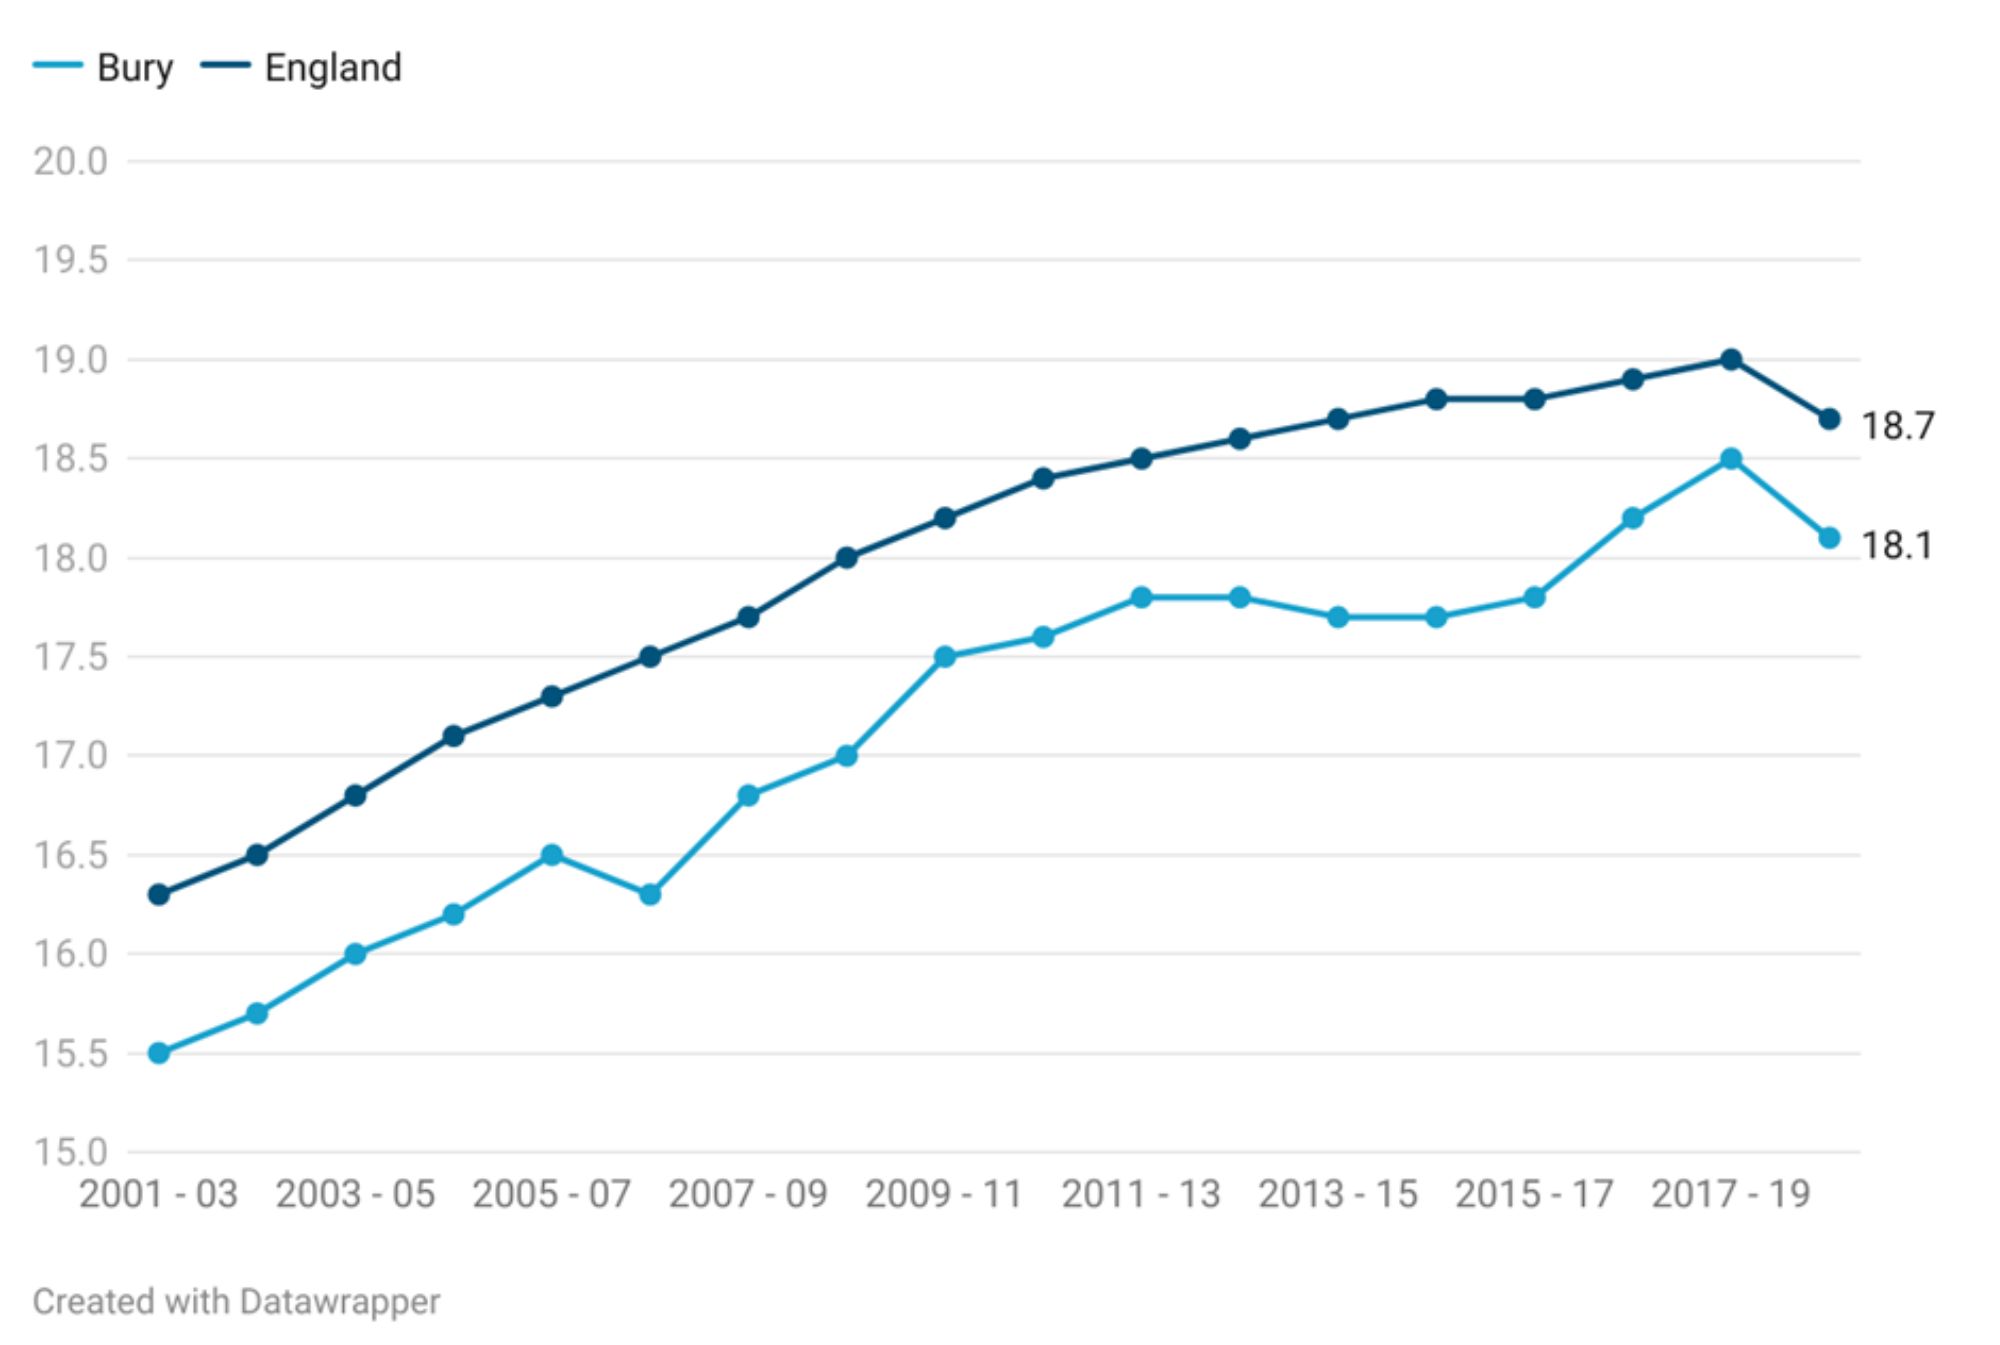
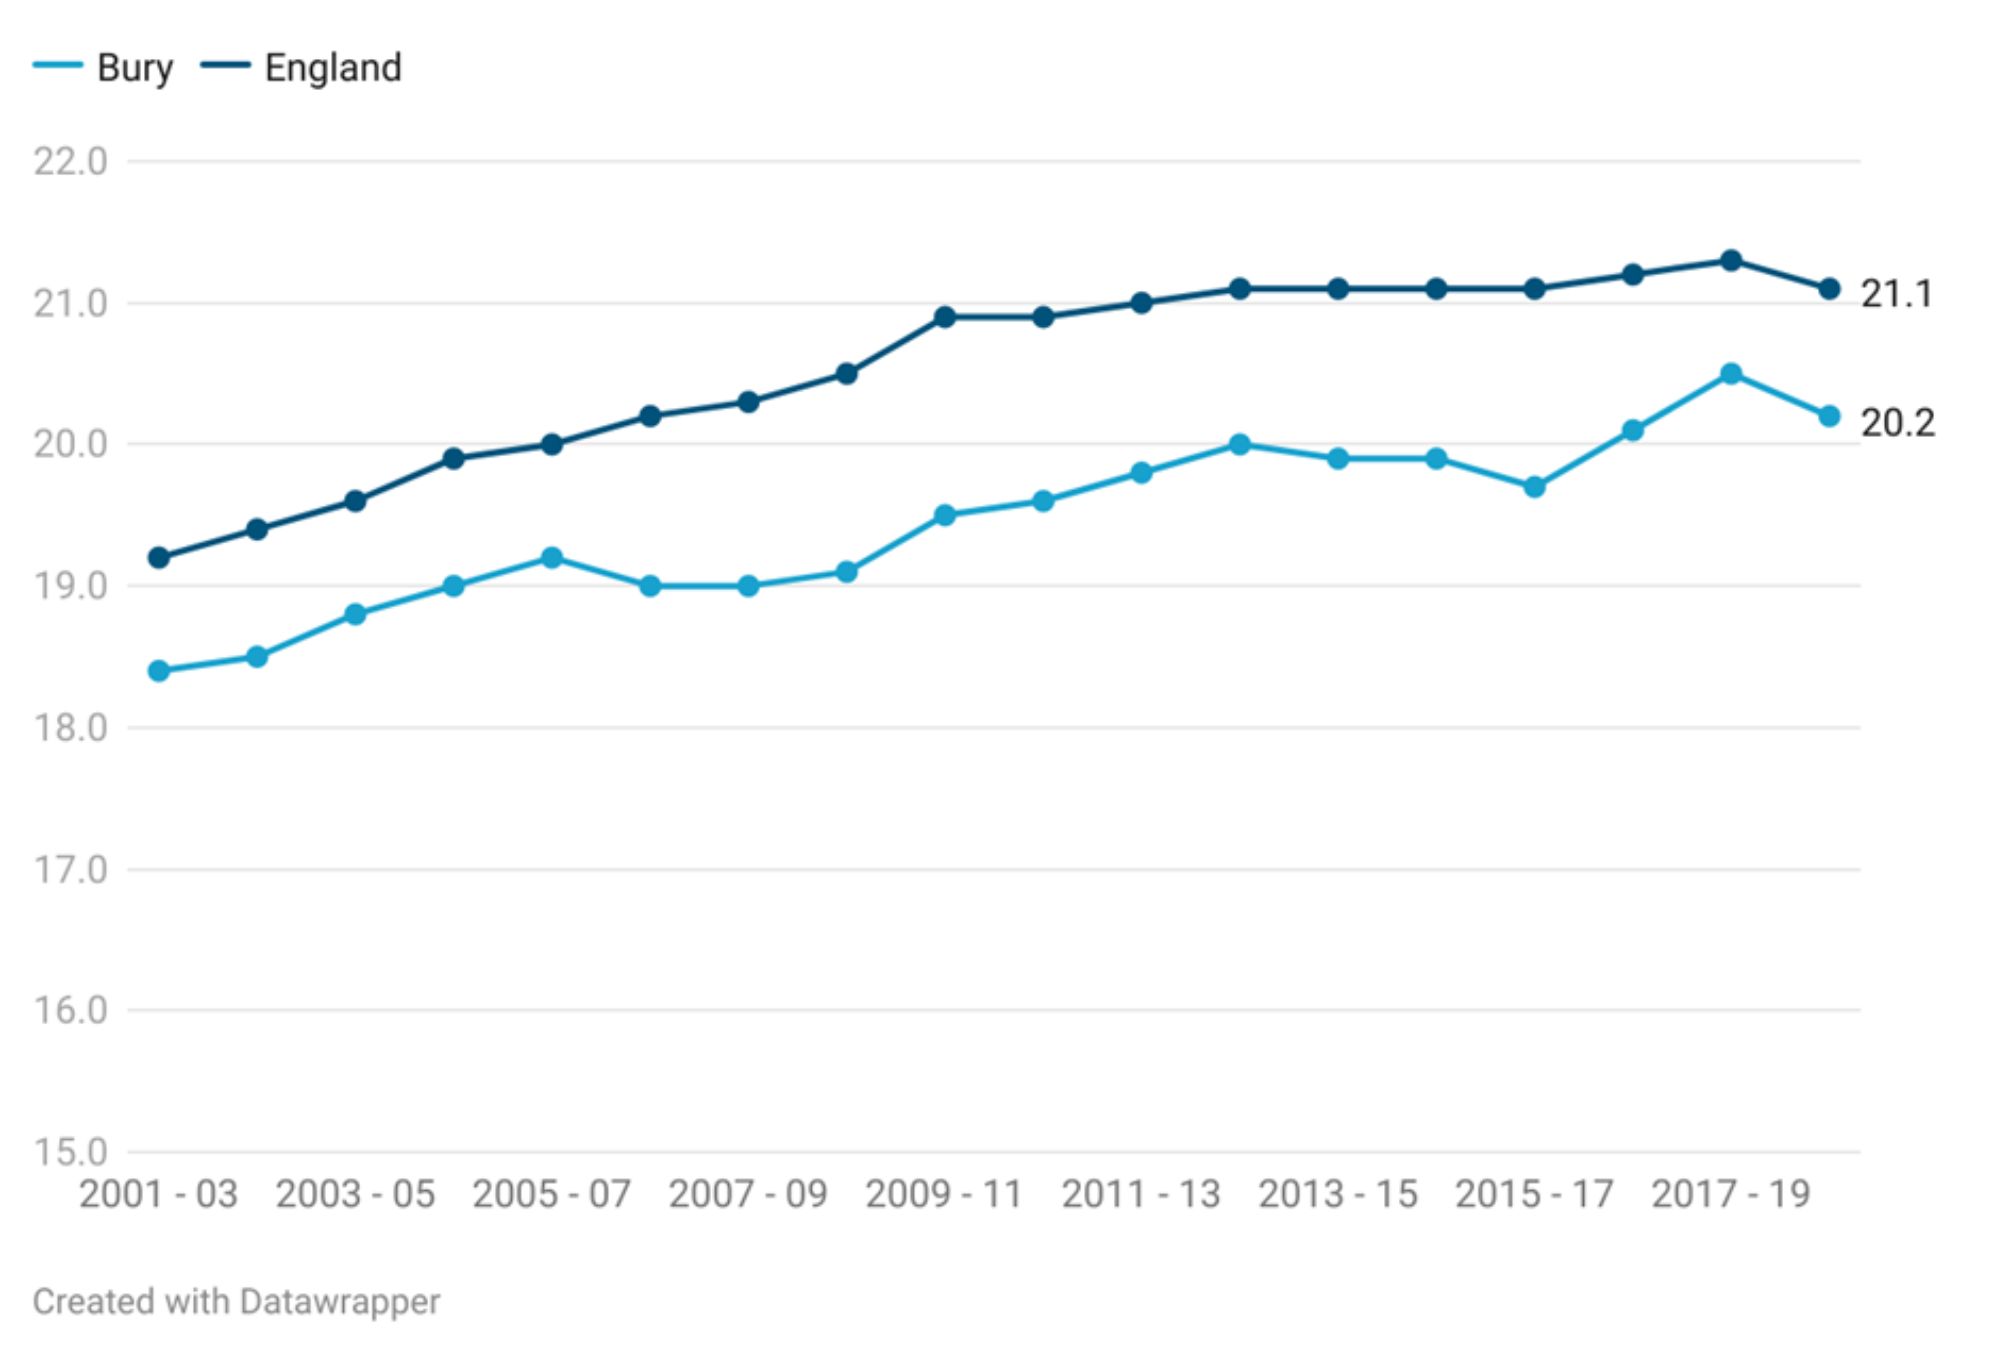
Life expectancy at 65 years – Male in Bury is 18.1 years, lower (statistically significant) than England average of 18.7 years (Productive Healthy Ageing Profile, 2020). Figure 2 compares the life expectancy at 65 years of males in Bury to the trend observed for males in England. Overall, there has been an increase in life expectancy for both Bury and England over the years. However, Bury's life expectancy at 65 years has generally been lower (Statistically significant) than that of England throughout the time period. From 2001-03 to 2018-20, Bury's life expectancy at 65 years has increased from 15.5 years to 18.1 years, a total increase of 2.6 years. England's life expectancy at 65 years has also increased from 16.3 years to 18.7 years, a total increase of 2.4 years. Throughout this period, both Bury and England have seen fluctuations in their life expectancy at 65 years. Bury saw a slight dip in 2006-08, but has generally been on an upward trend since then. England, on the other hand, experienced a dip in life expectancy at 65 years in 2018-20.
Life expectancy in Bury at 65 years for the period 2018-20 is the 6th highest in its group of similar local authorities with the highest male LE at 65 years in Bedford of 19 years and the lowest in Rochdale of 17.3 years (PHOF, 2020).
The gap between the LE in Bury and England has fluctuated throughout the years. In the early years of the period (2001-2010), the gap widened, reaching a peak of 1.2 years in 2006-08. However, in recent years, the gap has narrowed to 0.6 years in 2018-20, with the life expectancy at 65 years for males in Bury approaching the life expectancy for males in England as a whole.
Figure 2: Life expectancy at 65 years - Male (3 year range) in Bury compared with England 2001-03 to 2018-20
Life expectancy at 65 years – Female
Life expectancy at 65 years – Female in Bury is 20.2 years, lower (statistically significant) than England average of 21.1 years (Productive Healthy Ageing Profile, 2020). Figure 3 compares the female life expectancy at 65 in Bury to the observed female trend in England from the period 2001-03 to 2018-20. Similar to males, female life expectancy at 65 years in Bury has been consistently lower (statistically significant) than the national average for England over the observed time period. In 2001-03, the life expectancy for females in Bury at 65 years was 18.4 years compared to 19.2 years for females in England. Over the observed time period, the life expectancy for females in Bury at 65 years has increased, reaching 20.2 years in 2018-20. Meanwhile, the life expectancy for females at 65 years in England has also increased, reaching 21.1 years in 2018-20. Compared with Bury’s statistical neighbours, Bury sits in the middle with the 8th highest female life expectancy at 65 years for the period 2018-20 in its group of 16 similar local authorities with the highest female life expectancy at 65 years in Stockport of 21.4 years and the lowest in Oldham of 19.5 years (PHOF, 2020).
The gap between Bury and England has been fluctuating over time. From 2001-03 to the year 2005-2007, the gap was relatively small, at around 0.8-0.9 years. But from around 2006-08 onwards, the gap started to widen, reaching a peak of 1.4 years in 2008-10, 2009-11, before declining to 1.1 years in 2012-14. This was followed by another period where the gap widened, peaking at 1.4 in 2015-17. Since then, the gap has been decreasing gradually, and in 2018-20 it was 0.9 years.
Figure 3: Life expectancy at 65 - Female (3 year range) in Bury compared with England 2001-03 to 2018-20
Variations in life expectancy at 65 years by small geographical areas
Due to lack of data at MSOA and ward levels, we cannot examine the variations in LE at 65 years for male and female in Bury.
Inequality in life expectancy at 65 years
Inequality in life expectancy at 65 years in Bury has fluctuated through 2010-12 and 2018-20 for both males and females.
In 2010-13 the gap in males was at 6.3 years that gradually decreased to 5 years in 2013-15. The gap then increased from 6.5 years in 2014-16 to 7.3 years in 2017-19. The gap then decreased to 6 in 2018-2020. At the national level, inequality in LE at 65 years has been increasing from 4.6 years in 2010-12 to 5.2 years in 2018-20 (PHOF, 2020).
For females in Bury, the gap in 2010-13 was 5.9 years that decreased to 5.6 years in 2013-2015. The gap peaked at 6.8 years in the period 2014-16 and 2015-17, then declining to 5.2 years in 2017-2019. The gap widened slightly to 5.9 years in 2018-20. At the national level, the gap has gradually widened from 4 years in 2010-12 to 4.8 years in 2018-20 (PHOF, 2020).
Male
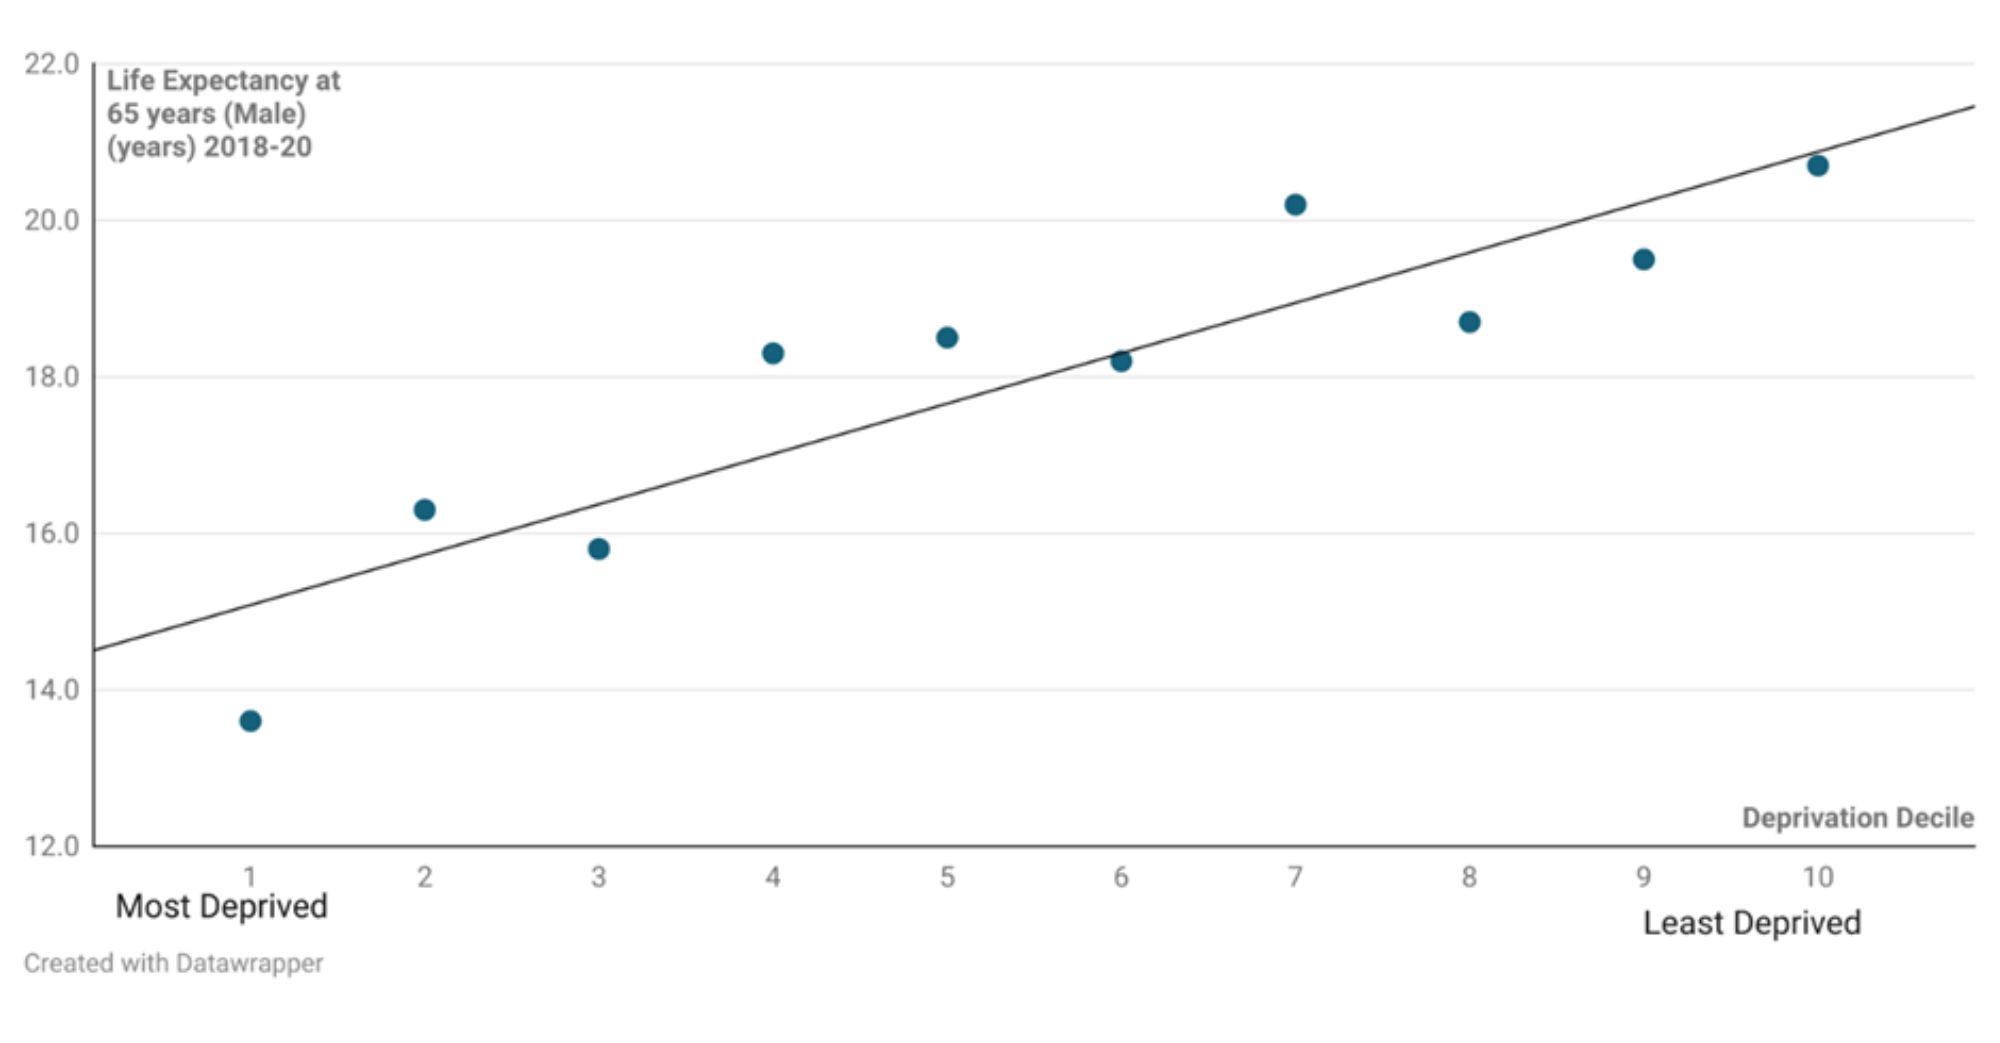
Inequality in life expectancy at 65 years- Male in Bury between the most and least deprived decile is 6.1 years compared with 5.2 years in England (Productive Healthy Ageing Profile, 2020). Figure 4 below presents life expectancy at 65 years for males across deprivation deciles in Bury for the three-year period 2018-20, with decile 1 being the most deprived and decile 10 being the least deprived. Males in the most deprived areas (decile 1) have a life expectancy at 65 years of 13.6 years, which is the lowest among all the deprivation deciles. As the levels of deprivation decreases, the life expectancy increases. The highest life expectancy at 65 years is observed in males in the least deprived areas (decile 10), with a life expectancy at 65 years of 20.7 years.
The data suggests a deprivation gradient with males in more deprived areas having lower life expectancies at 65 years compared to those in less deprived areas.
Figure 4: Life expectancy at 65 years – Male (3 year range) in Bury by levels of deprivation 2018-20
Female
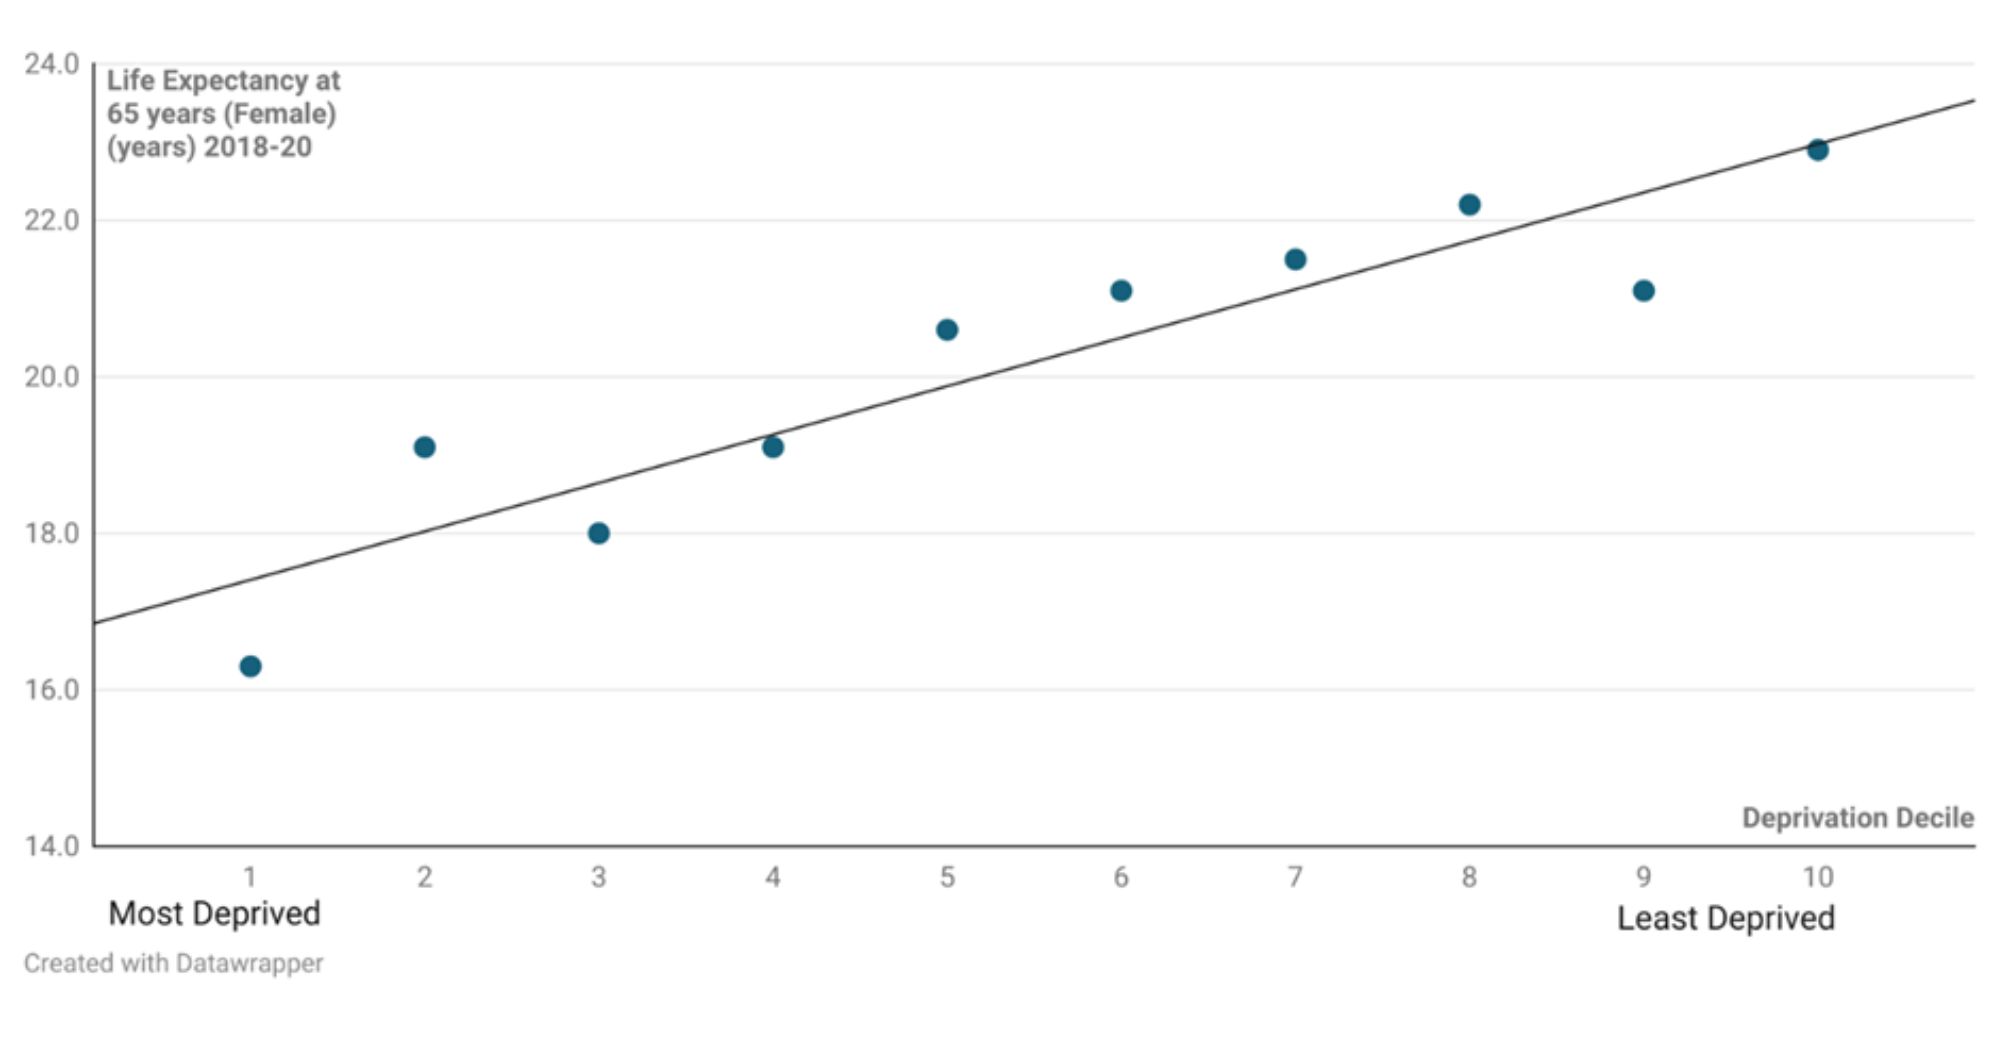
Inequality in life expectancy at 65 years - Female in Bury between the most and least deprived decile is 5.9 years compared with 4.8 years in England (Productive Healthy Ageing Profile, 2020). Life expectancy at age 65 for females by deprivation decile in Bury for the three-year period 2018-2020 is depicted in Figure 5. Females in the most deprived areas (decile 1) have the lowest life expectancy at age 65 of all deprivation deciles, at 16.3 years. Life expectancy increases as deprivation decreases. Females living in the least deprived areas (decile 10) have the highest life expectancy at age 65, with a life expectancy of 22.9 years.
The data indicate a deprivation gradient, with females in more deprived areas having shorter life expectancies at age 65 than those in less deprived areas.
Figure 5: Life expectancy at 65 years – Female (3 year range) in Bury by levels of deprivation 2018-20
Gap in life expectancy at 65 years
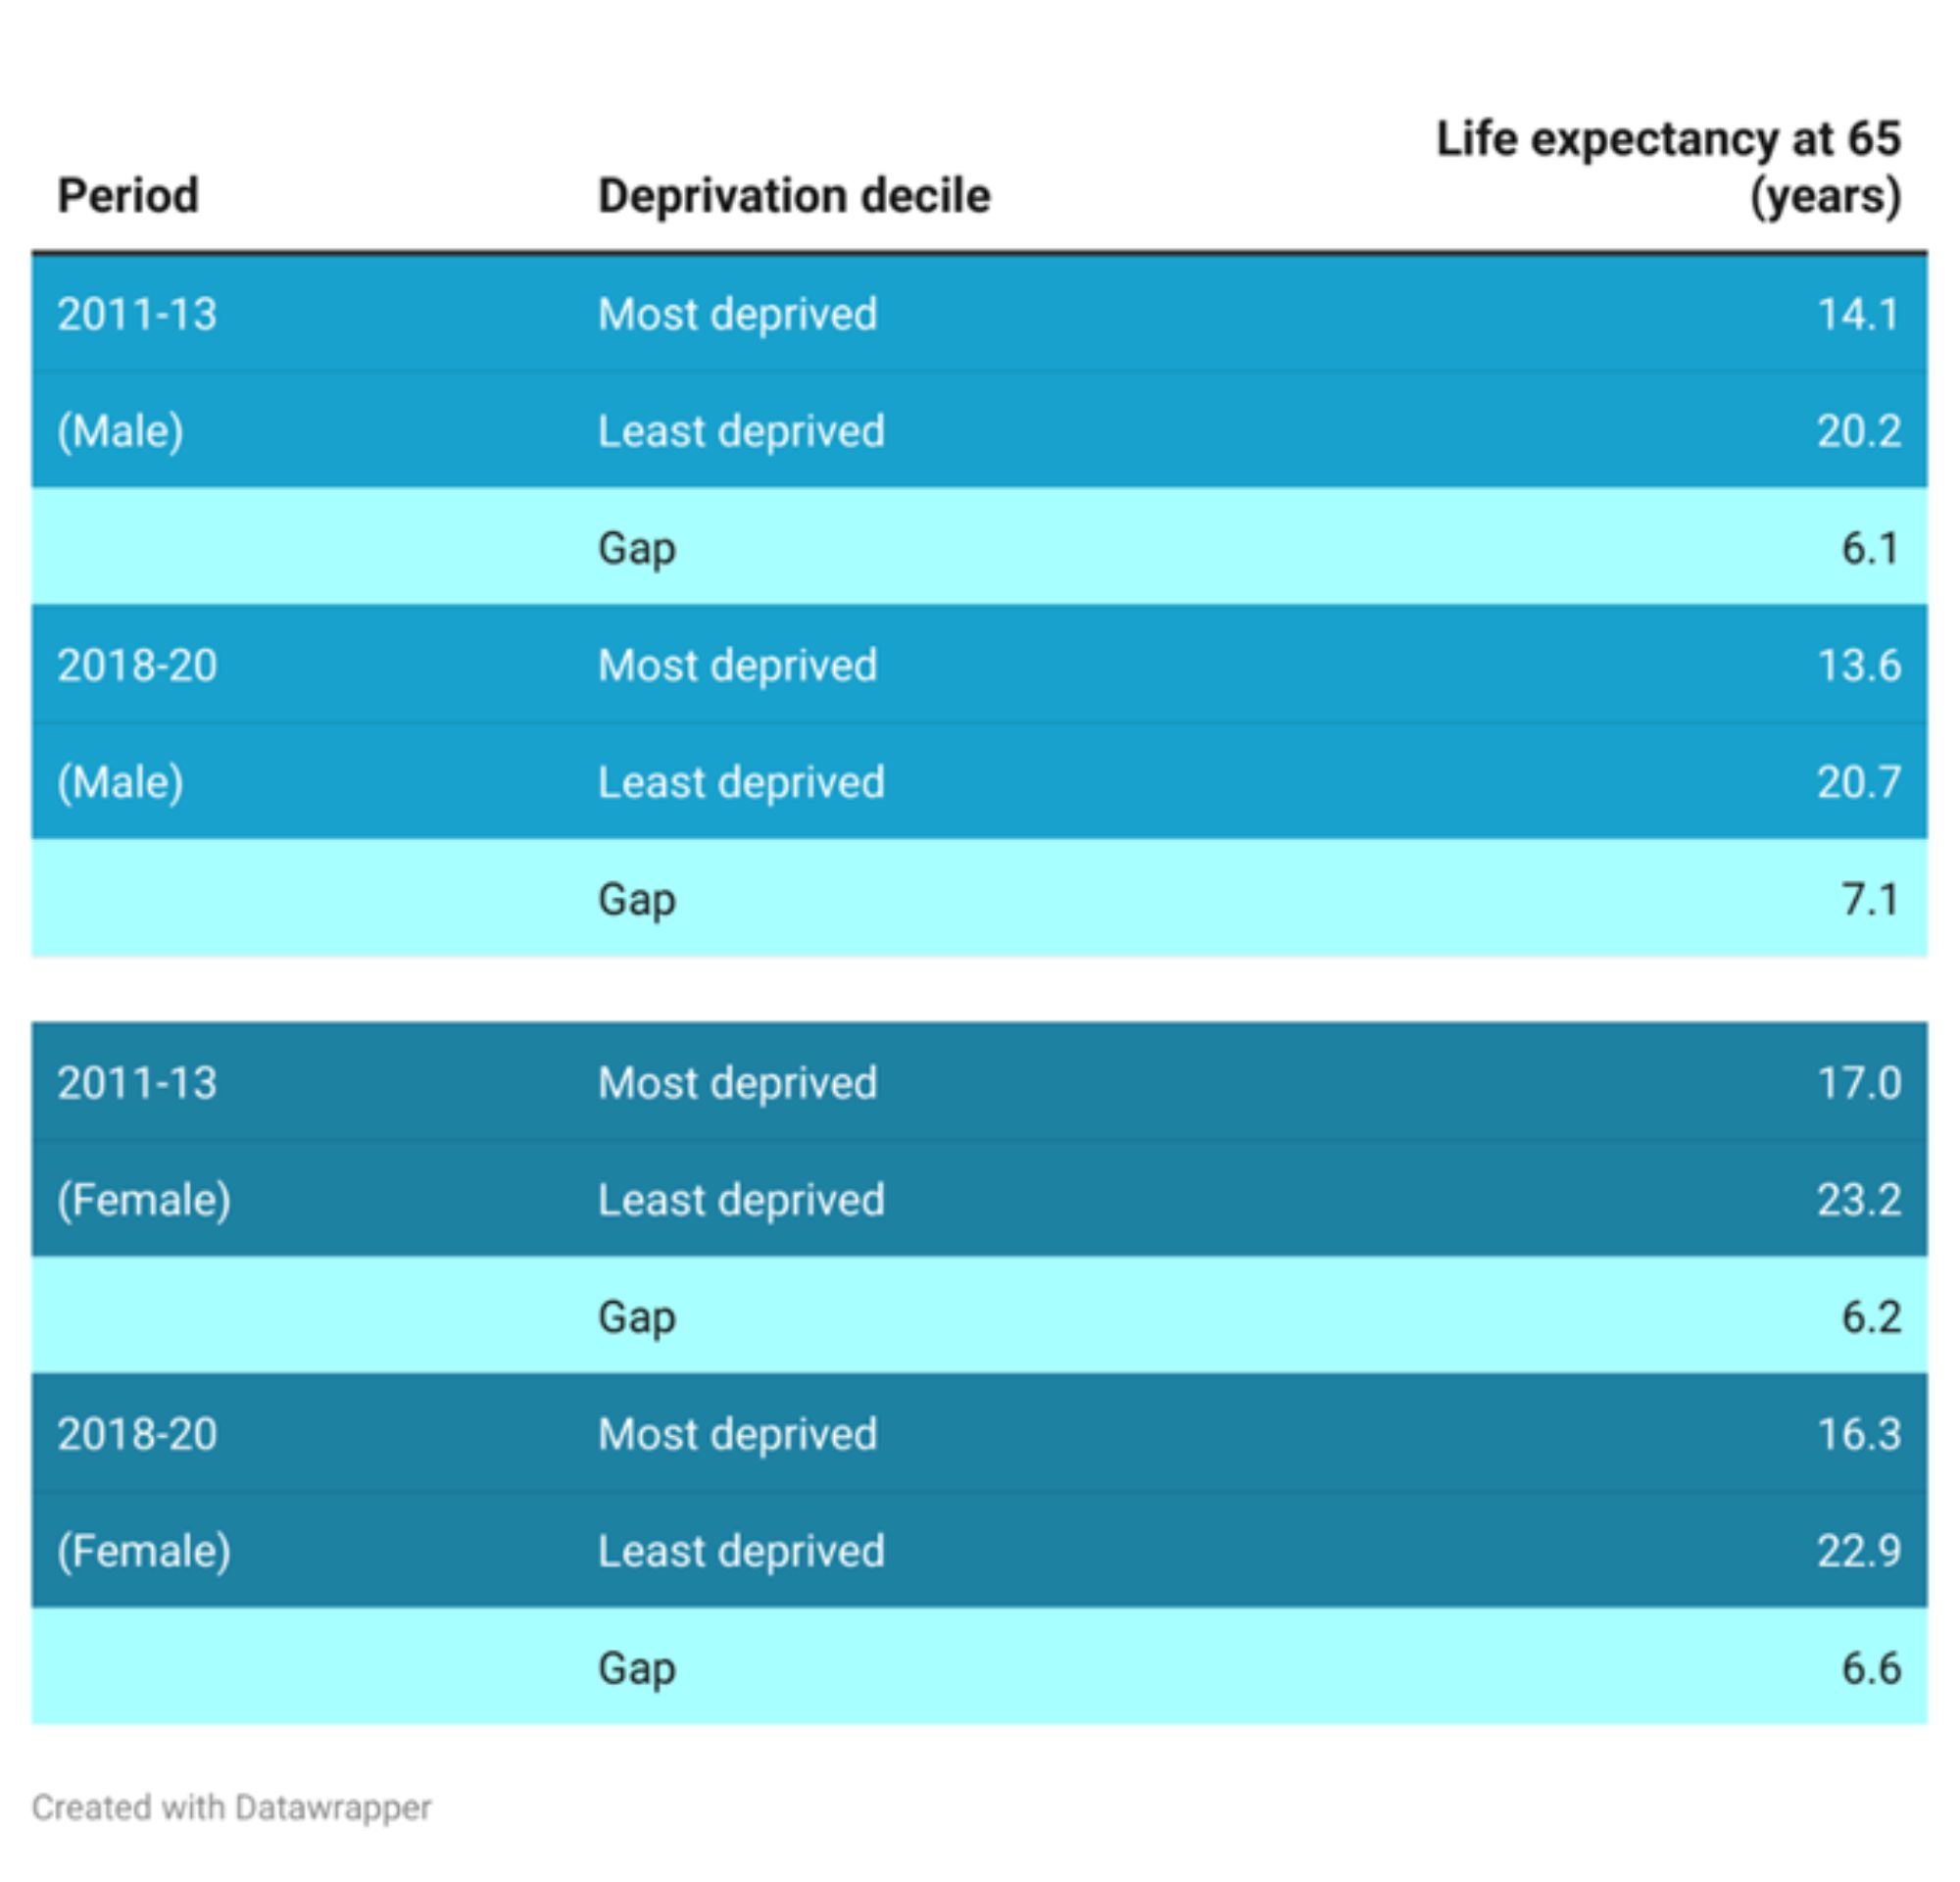
The gap in life expectancy at 65 years between the most deprived and least deprived deciles during two distinct three-year periods, 2011-13 and 2018-2020, is presented in Table 3. The data is separated by sex, with separate statistics for male and female.
Male: In the period 2011-13, the life expectancy at age 65 for the most deprived decile in males was 14.1 years, while it was 20.2 years for the least deprived decile. This is a difference of 6.1 years between the two deciles. In the period of 2018-20, the life expectancy at age 65 was 13.6 years in the most deprived areas and 20.7 years in the least deprived areas. This represents a slightly widening of the gap at 7.1-year.
Female: In the period 2011-13, the life expectancy at 65 years for the most deprived decile in females was 17 years, while the life expectancy at 65 years for the least deprived decile was 23.2 years. This is a difference of 6.2 years between the two deciles. In the period of 2018-20, the life expectancy at age 65 was 16.3 years in the most deprived areas and 22.9 years in the least deprived areas. Compared to 2011-2013, this represents a slightly increased gap of 6.6 years.
Overall, the data shows that there is a significant gap in life expectancy between the most deprived and least deprived areas, with the gap increasing for both sex especially for males in 2018-20 compared with 2011-13.
Table 3: Gap in LE at 65 years between the most and least deprived deciles in Bury for the period 2011-13 and 2018-20 by sex
Healthy life expectancy at 65 years of age
This indicator provides an important summary measure of the mortality and morbidity in those aged 65 years and over. Healthy life expectancy shows the years a person can expect to live in good health (rather than with a disability or in poor health). This indicator complements the proposed indicator of healthy life expectancy at age 65 to measure progress on the government's 'Ageing Grand Challenge' mission to "ensure that people can enjoy at least 5 extra healthy, independent years of life by 2035, while narrowing the gap between the experience of the richest and poorest." It is also a key measure to monitor progress on PHE's productive healthy ageing policy based on the World Health Organisation's healthy ageing framework.
This indicator is a measure of the average number of years a person aged 65 years would expect to live in good health based on contemporary mortality rates and prevalence of self-reported good health. The prevalence of good health is derived from responses to a survey question on general health. For a particular area and time period, it is an estimate of the average number of years a person aged 65 years would live in good general health if he or she experienced the age specific mortality rates and prevalence of good health for that area and time period throughout his or her remaining life. Figures are calculated from deaths from all causes, mid year population estimates, and self reported general health status, based on data aggregated over a three year period. (PHOF, 2023).
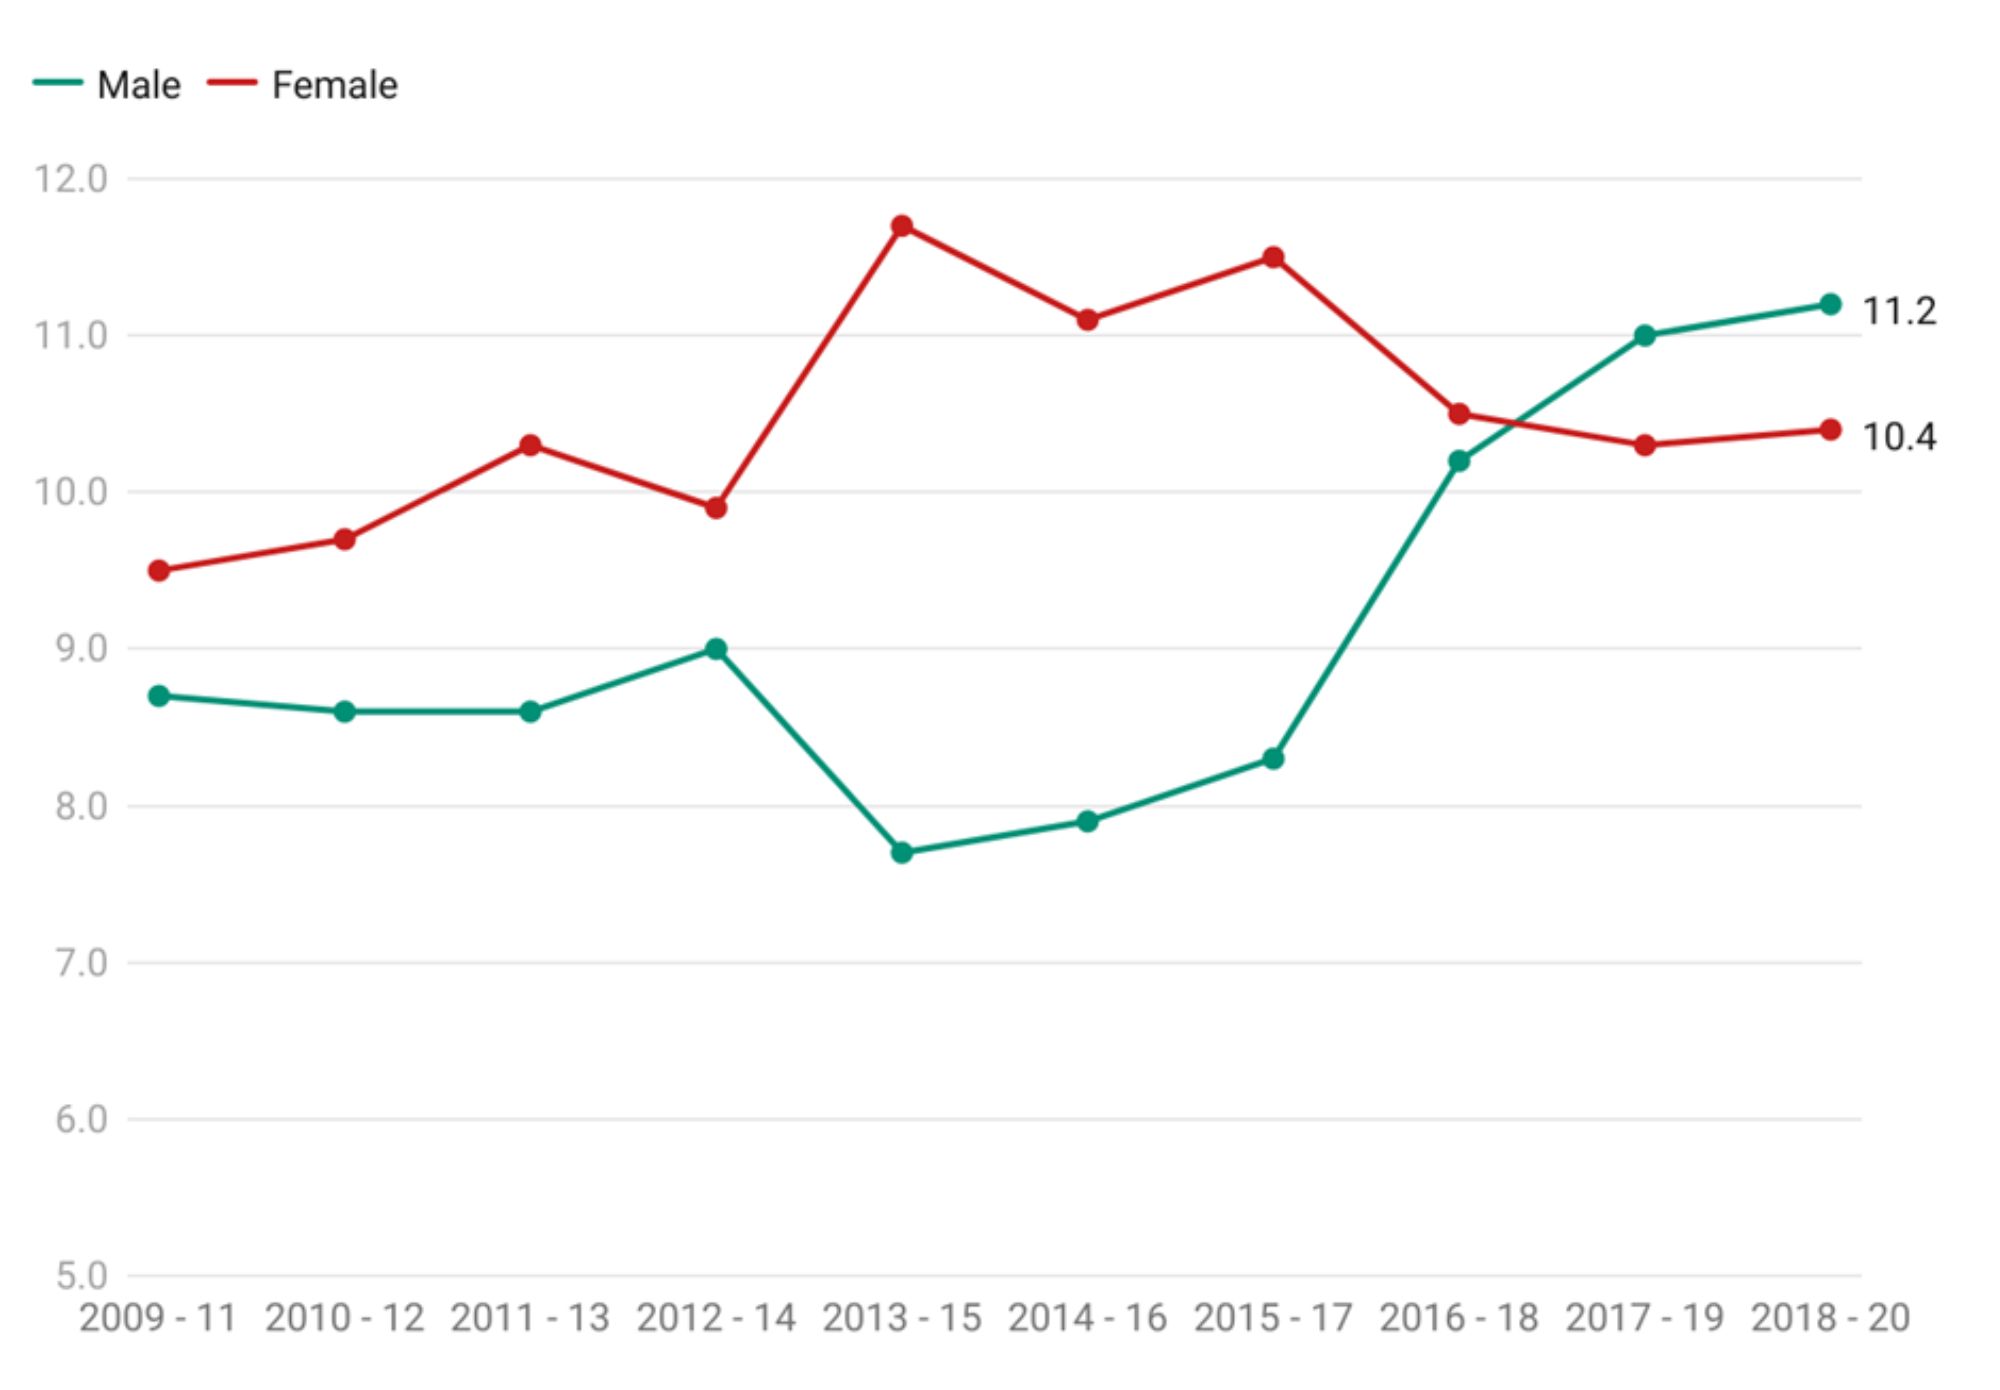
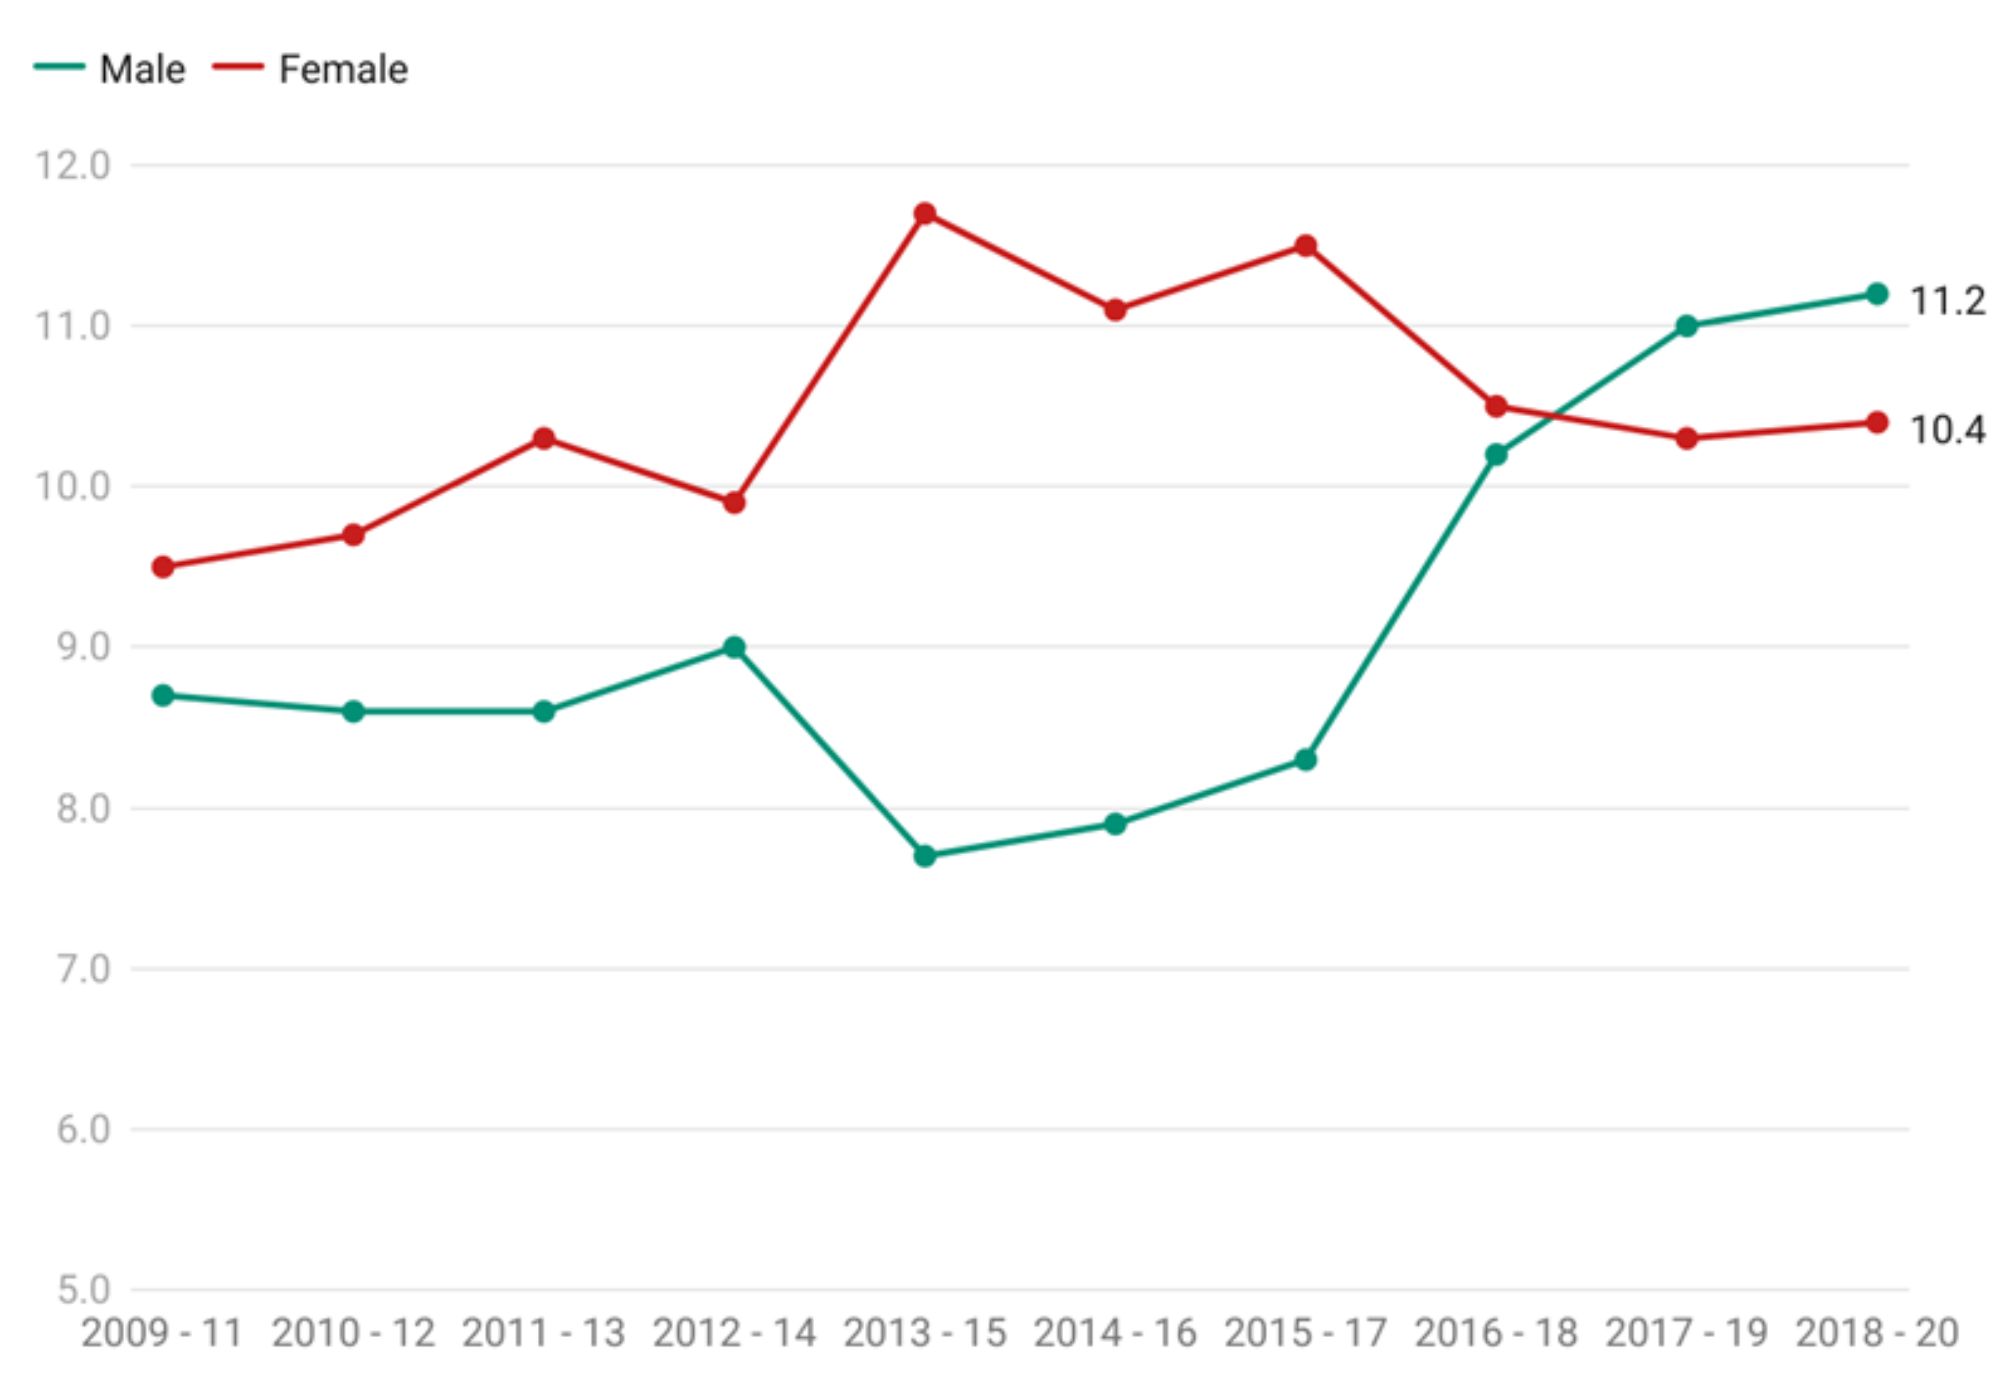
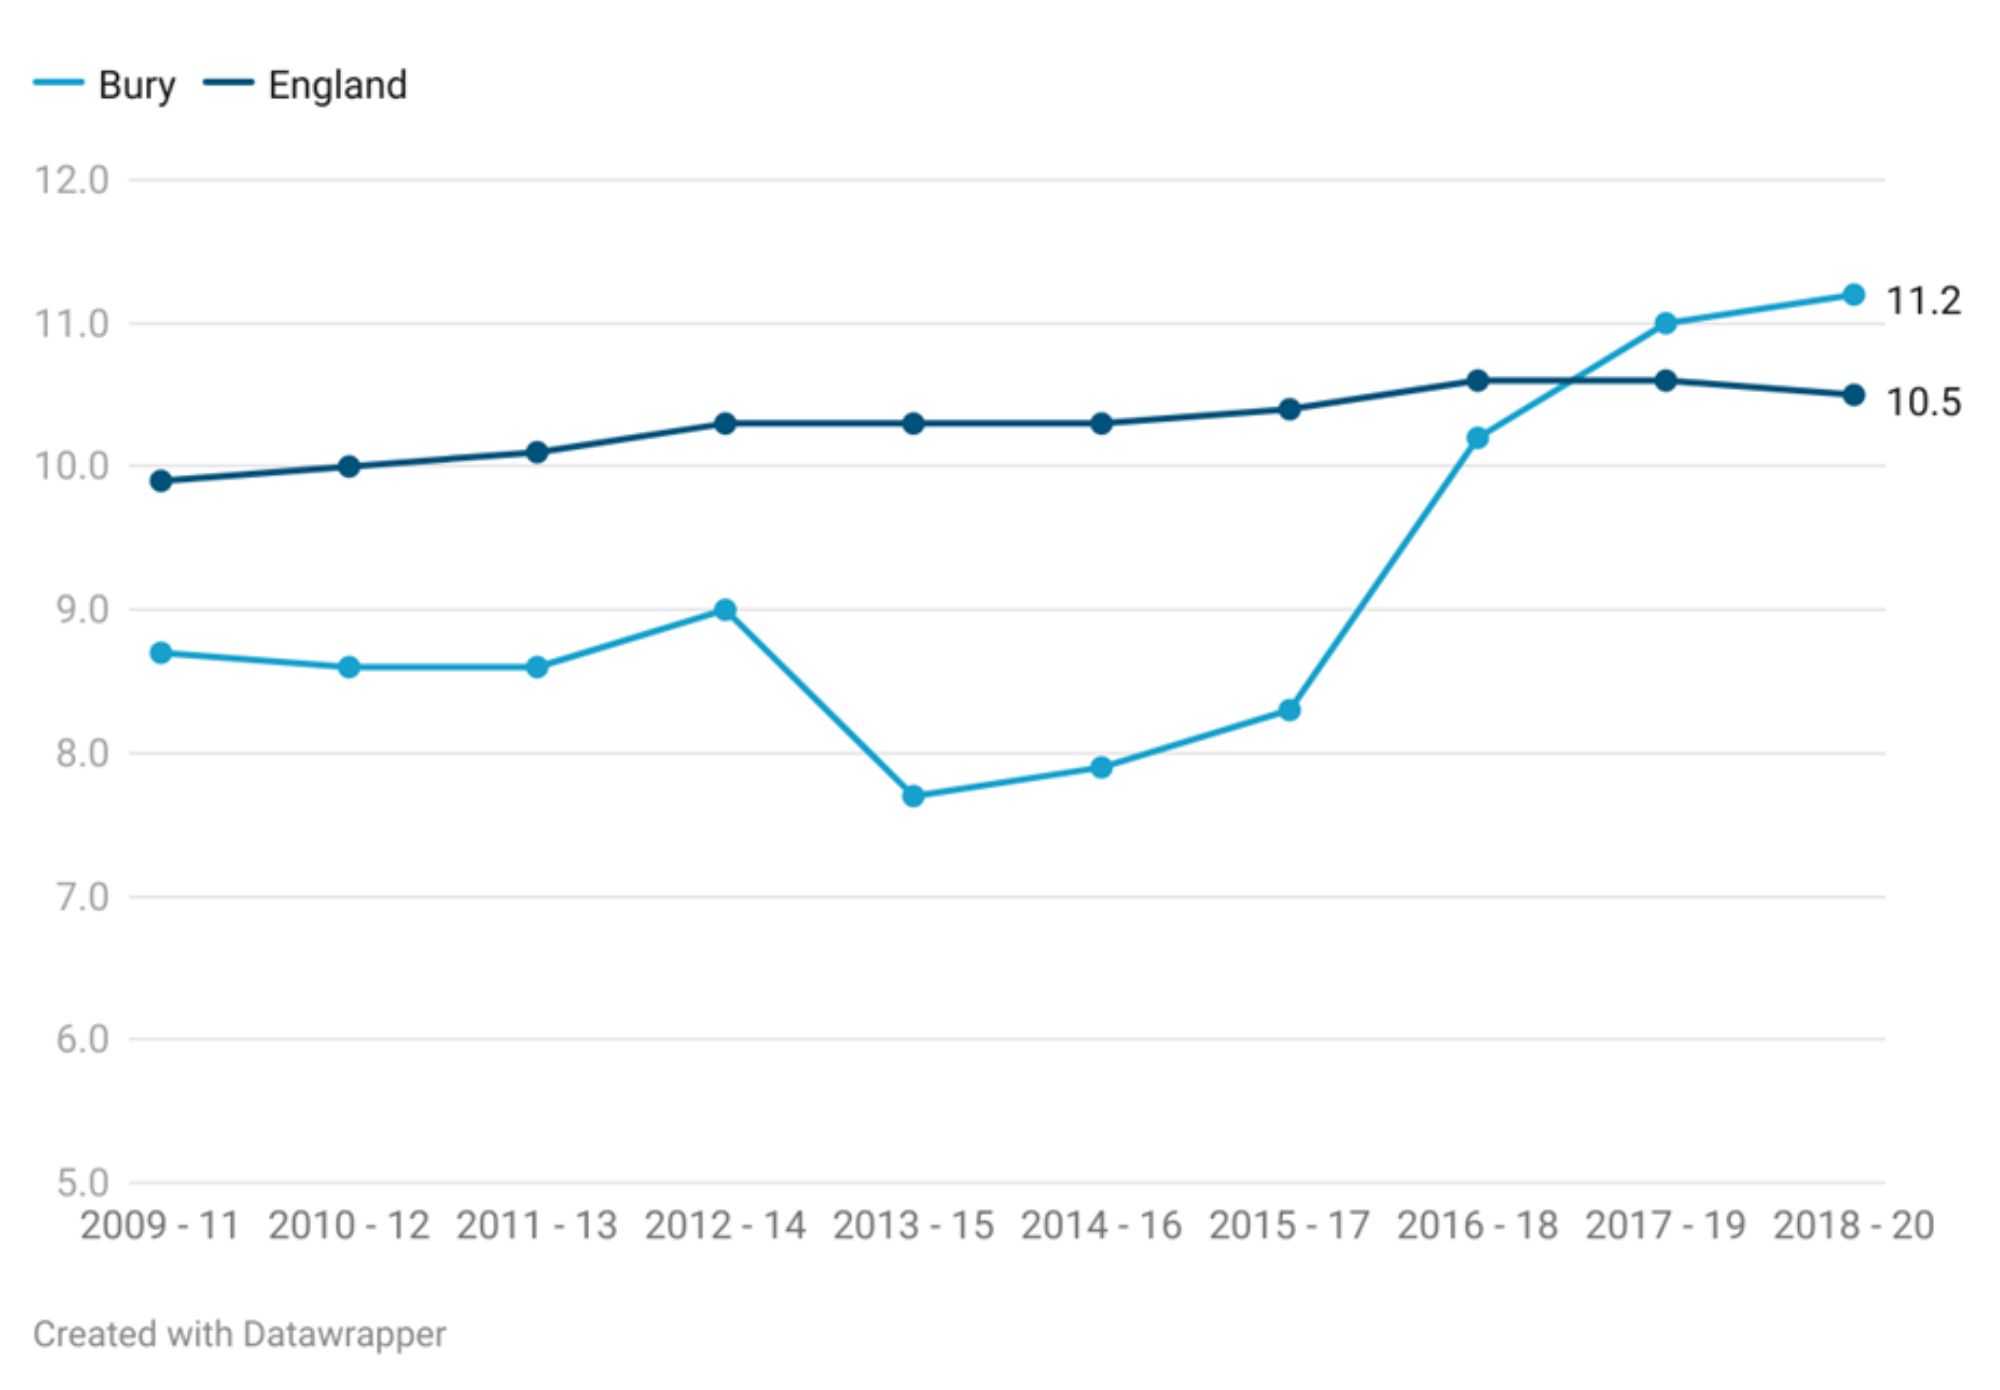
HLE at 65 years has increased over the past decade for both males and females in Bury, with males experiencing a greater increase than females. From 2009-11 to 2018-20, HLE at age 65 increased by 2.5 years for males, but by only 0.9 years for women. Male HLE at age 65 increased from 8.7 years in 2009-2011 to 11.2 years in 2018-2020, while female HLE at age 65 has increased from 9.5 years in 2009-2011 to 10.4 years in 2018-2020. Females had consistently higher healthy life expectancy at 65 years than males throughout the years from 2000 to 2018. However, in the most recent time period of 2018-20, males had higher HLE at 65 years of 11.2 years (highest for males since 2009-11) compared to females who had a HLE at 65 years of 10.4 years (Figure 6).
Figure 6: Comparison of Healthy life expectancy at 65 years by sex in Bury from 2009-11 to 2018-20
Healthy life expectancy at 65 years – Male
Healthy life expectancy at 65 years for males in Bury is 11.2 years, statistically similar to England average of 10.5 years (Productive Healthy Ageing Profile, 2020). Figure 6 compares the healthy life expectancy at 65 years of males in Bury to the trend observed for males in England. Overall, there has been an increase in healthy life expectancy at 65 years for both Bury and England over the years.
Looking at the data in Figure 7, we can see that the trend for healthy life expectancy (HLE) at 65 years in Bury males is relatively stable from 2009-11 to 2015-17, with slight fluctuations and HLE at 65 years ranging from 7.7 to 9 years. After that, there is an improvement in HLE at 65 years in Bury, with the HLE increasing to 10.2 years in 2016-18 and further to 11.2 years in 2018-20. The trend for HLE at 65 years in England for males shows a very slight increase from 9.9 years in 2009-11 to 10.5 years in 2018-20.
Bury has the 3rd highest HLE at 65 years for males in its group of similar local authorities for the period 2018-20, with the highest HLE at 65 years for males in Stockport (11.4 years) and lowest in Oldham (7.7 years) (Productive Healthy Ageing Profile, 2020)
Figure 7: Healthy life expectancy at 65 years - Male (years) in Bury compared with England 2009-11 to 2018-20
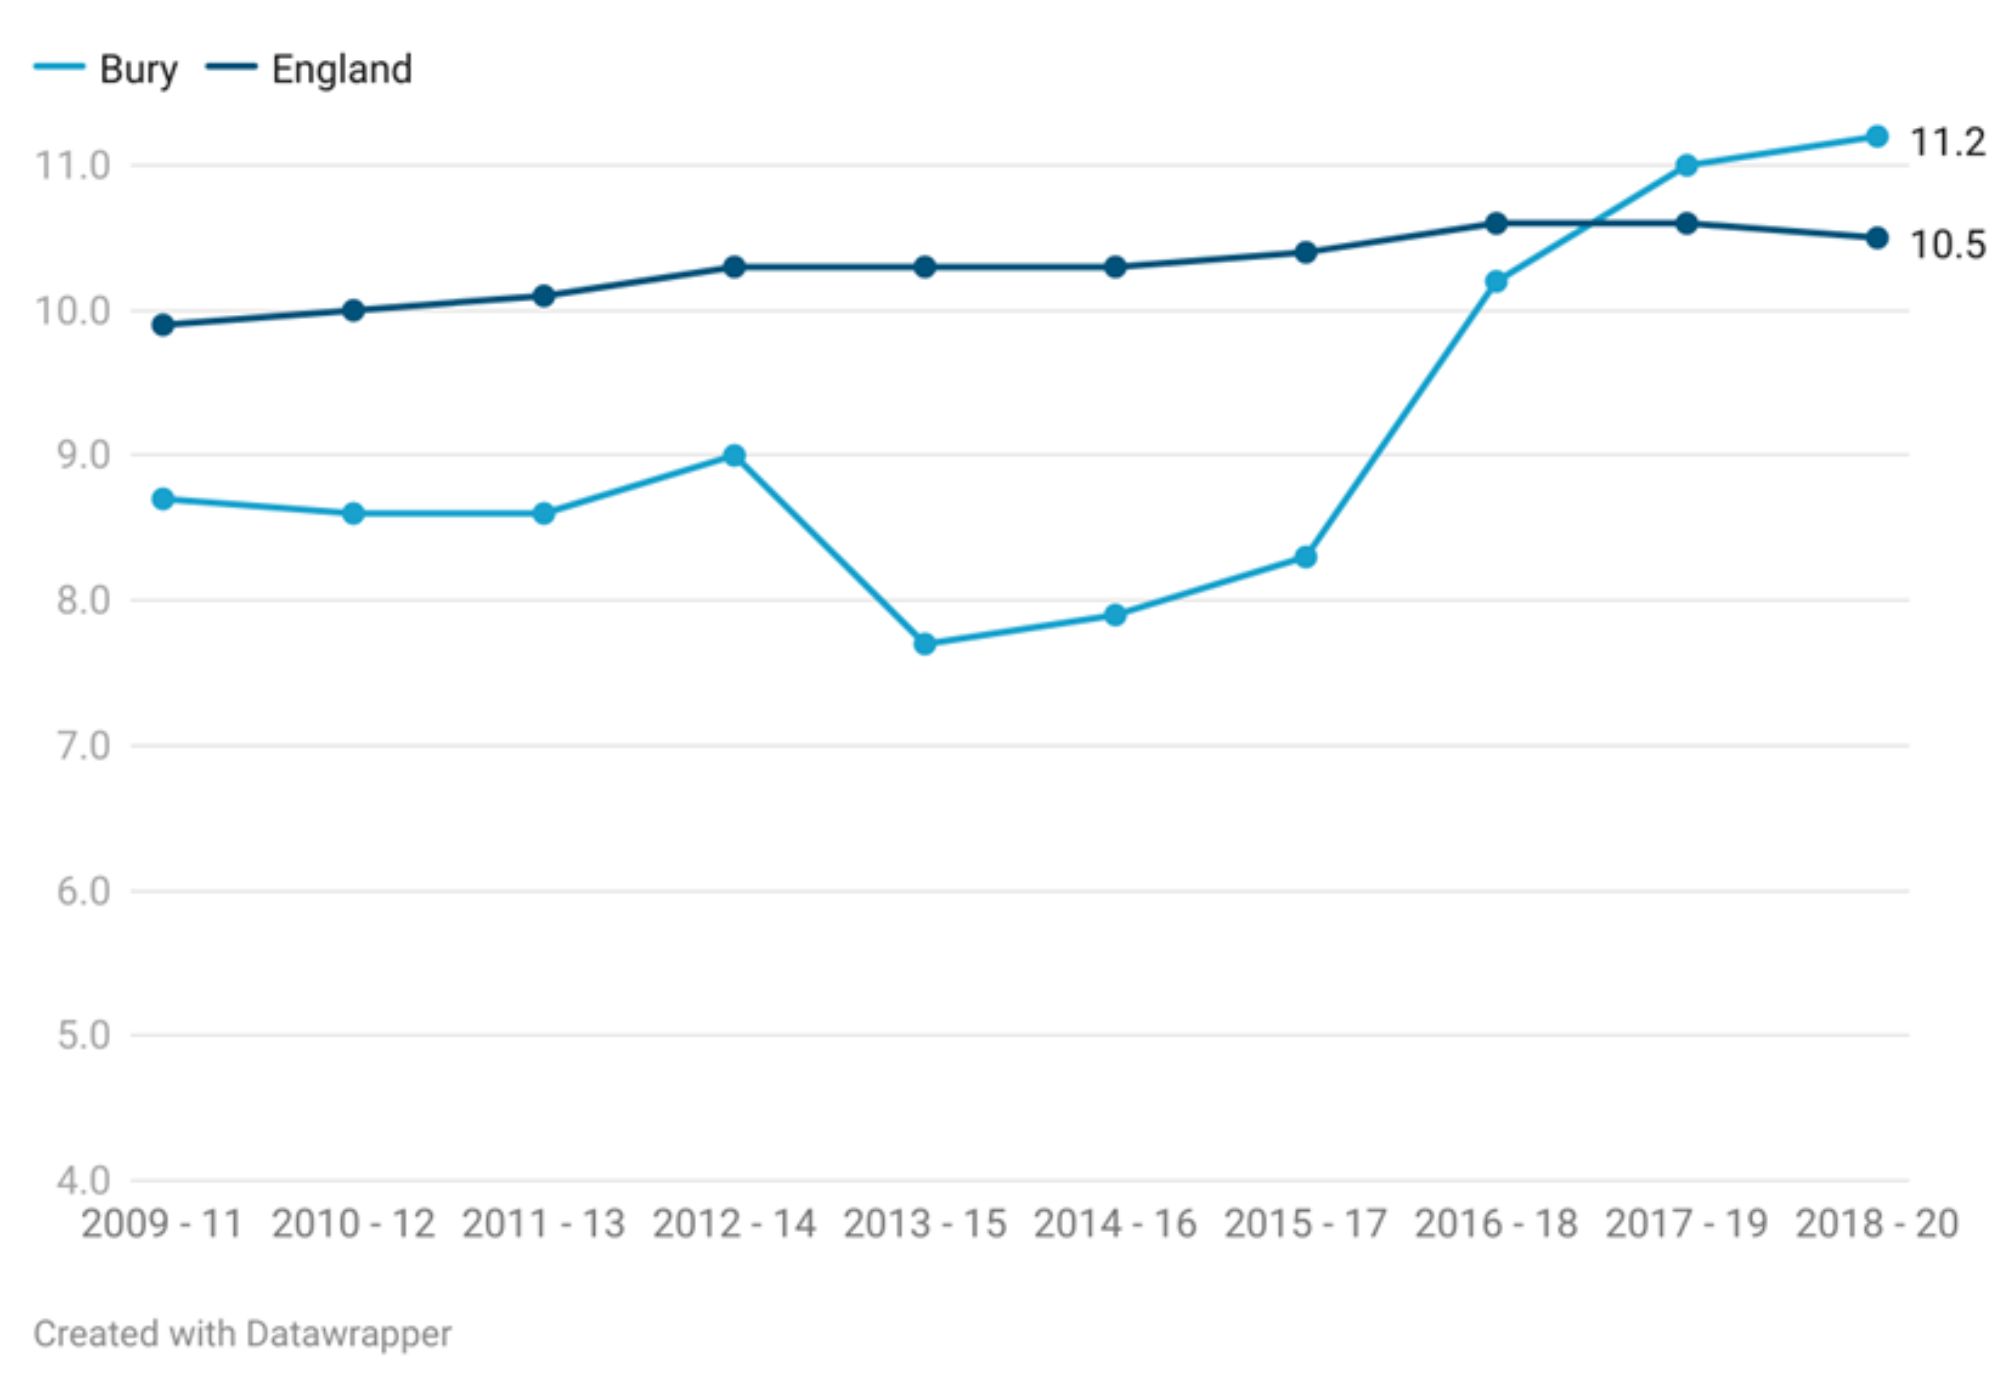
The gap between the HLE at in Bury and England increased from 1.2 years in 2009-11 to 2.1 in 2015/17 and then narrowed to 0.4 years in 2016/18. In the most recent year, there was an inverse gap of 0.7 years, with higher HLE in 65 years of age males in Bury compared with England.
Healthy life expectancy at 65 years – Female (Years)
Healthy life expectancy at 65 years for females in Bury is 10.4 years, statistically similar to England average of 11.3 years (Productive Healthy Ageing Profile, 2020). Figure 7 compares the female healthy life expectancy in Bury to the observed female trend in England at 65 years from the period 2009-11 to 2018-20. Examining the data in Figure 8, we can see that the trend for healthy life expectancy (HLE) at 65 years in Bury females is relatively stable from 2009-11 to 2012-14, with slight fluctuations and HLE at 65 years ranging from 9.5 to 10.3 years. Healthy life expectancy at 65 in females sharply increases from 9.9 years in 2012-14 to 11.7 in 2013-15. After this sharp rise, HLE at 65 in Bury females gradually declined to 10.4 years in 2018-20.
Healthy life expectancy at 65 for females in England has been gradually increasing from 10.6 years in 2009-11 to 11.3 years in 2018-20. In the earlier periods (2009-2014), the healthy life expectancy at 65 for females in Bury was generally lower than the corresponding figure for England. However, from 2014 onwards, there is a shift. Bury's healthy life expectancy surpasses that of England.
Figure 8: Healthy life expectancy at 65 years – Female (Years) in Bury compared with England 2009-11 to 2018-20
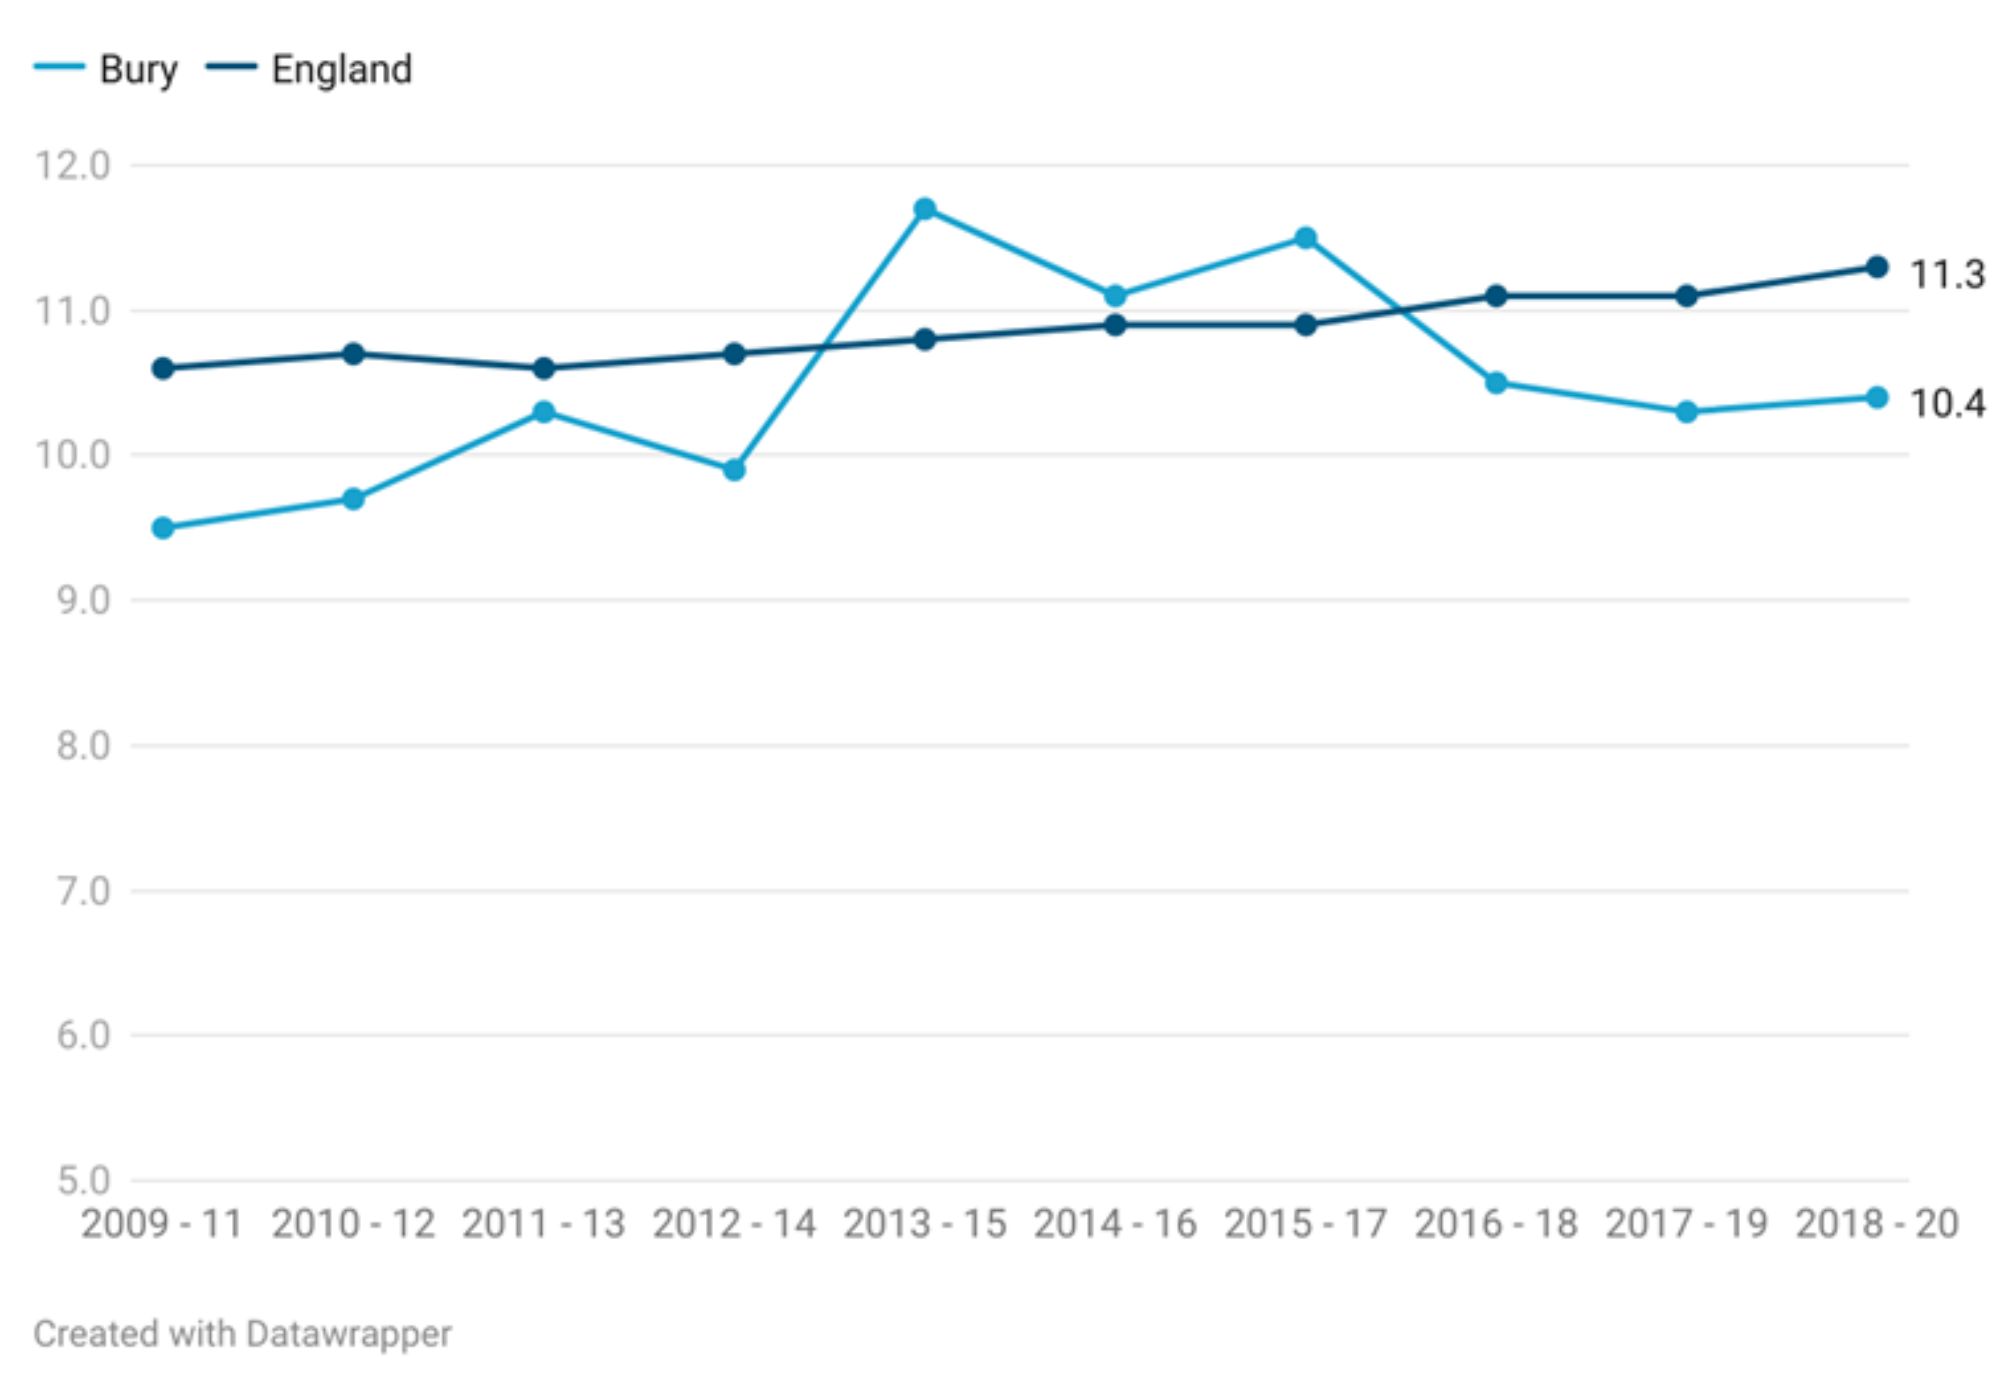
The difference between Bury and England healthy life expectancies fluctuates over time. Initially, the gap ranged from -0.9 to 1.1 years, indicating Bury's lower healthy life expectancy. Subsequently, the difference narrows, reaching its lowest point at -0.6 years (2015-17). However, in more recent years, the gap starts to widen again, with Bury's healthy life expectancy exceeding that of England by 0.9 years in 2018-20.
The most recent improvement in HLE at 65 years in Bury has also been observed for males and may suggest success of interventions and efforts to promote healthy ageing in Bury. However, it is important to continue monitoring the trends to ensure to improve health outcomes for our older population groups.
Bury has the 9th highest HLE at 65 years for females in its group of similar local authorities for the period 2018-20, with the highest HLE at 65 years for females in Bedford (12.2 years) and lowest in Doncaster (7.2 years) (PHOF, 2020).
Variations in healthy life expectancy at 65 years by small geographical areas
Due to lack of data at MSOA and ward levels, we cannot examine the variations in HLE at 65 years for male and female in Bury.
Inequality in healthy life expectancy at 65 years
There are no data on inequality in HLE at 65 years for both males and females.
Disability-free life expectancy at 65 years
Disability-free life expectancy at 65 years is an important summary measure of health and has implications for: quality of life; fitness for work given increases in the State Pension age; personal finances; social connections and contributions; health and care services; and the wider economy. This indicator complements the indicator of healthy life expectancy at age 65 to measure progress on the government's 'Ageing Grand Challenge' mission described earlier.
Disability-free life expectancy (DFLE) at 65 is defined as an estimate of the number of years a person aged 65 years would expect to live without a long-lasting physical or mental health condition or disability limiting their ability to carry out day-to-day activities. This is based on contemporary mortality rates and prevalence of self-reported disability-free state.
The prevalence of disability-free state is derived from responses to a survey question on general health. For a particular area and time period, it is an estimate of the average number of years a person aged 65 years would live without disability if he or she experienced the age-specific mortality rates and prevalence of disability-free state for that area and time period throughout his or her remaining life. Figures are calculated from deaths from all causes, mid-year population estimates, and self-reported disability-free state, based on data aggregated over a three-year period.
Examining data for Bury, DFLE at 65 years for both Male and Female increased from 2009-11 to 2018-20 but the increase was greater (2.5 years) in males compared with females (0.9 years). Between the periods 2013-15 and 2018-20, disability free life expectancy at 65 years in males increased from 7.7 years to 11.2 years, while in females it decreased from 11.7 years to 10.4 years. DFLE at 65 years for females in Bury remained higher than males from 2009-2011 to 2016-18. However, in the two most recent data points for 2017-19 and 2018-20, the DFLE for females at 65 was lower than males. DFLE for males was highest in the most recent period 2018-20 at 11.2 years and for females, it was highest in 2013-15 at 11.7 years (Figure 9).
Figure 9: Comparison of Disability free life expectancy at 65 years by sex in Bury from 2009-11 to 2018-20
Disability-free life expectancy at 65 years – Male
Disability-free life expectancy at 65 years- Males in Bury for the year 2018-20 is at 11.2 years similar (statistically significant) to England average of 10.5 years.
Figure 10 below presents trend data for Bury and England for the period 2009-11 to 2018-20. DFLE at 65 years in Bury remained stable between 2009-11 (8.7 years) to 2015-17 (8.3 years). This was followed by a sharp increase to 10.2 years in 2016-18, increasing further to 11.2 years in 2018-20. For England, disability-free life expectancy at 65 years for males increased gradually from 9.9 years to 10.5 years. Comparing Bury with England, DFLE at 65 years for males in Bury remained lower than England average from 2009-2011 through to 2016-2018 (statistically lower for all years with the exception of 2012-14 and 2016-2018). Based on the two most recent data points, DFLE in males at 65 years for Bury was higher but not statistically significant compared with England’s average.
Figure 10: Disability-free life expectancy at 65 years - Males in Bury compared with England 2014-16 to 2018-20
DFLE for males at 65 years in Bury for the period 2018-20 is the 3rd highest in its group of similar local authorities with the highest male DFLE in Swindon of 11.2 years and the lowest in Oldham of 7.6 years (PHOF, 2020).
Disability-free life expectancy at 65 years – Female
Disability-free life expectancy at 65 years- Females in Bury for the year 2018-20 is at 10.4 years similar (statistically significant) to England average of 11.3 years.
Figure 11 below presents trend data for Bury and England for the period 2009-11 to 2018-20. DFLE of Females at 65 years in Bury remained stable between 2009-11 (9.5 years) to 2012-14 (9.9 years) and then increased sharply to 11.7 years in 2013-15. This was followed by a period of continuous decline to 10.4 years in 2018-20. For England, disability-free life expectancy at 65 years for females increased gradually from 10.6 years to 11.3 years in 2018-20. Comparing Bury with England, Bury had slightly lower (with slight fluctuations) but statistically similar DFLE at the age of 65 for females (Figure 11).
Figure 11: Disability-free life expectancy at 65 years - Females in Bury compared with England 2014-16 to 2018-20

DFLE for females at 65 years in Bury for the period 2018-20 is the 5th highest in its group of similar local authorities with the highest female DFLE in Bedford of 11 years and the lowest in Doncaster of 6.5 years (PHOF, 2020).
Variations in disability-free life expectancy at 65 years by small geographical areas
Due to lack of data at MSOA and ward levels, we cannot examine the variations in DFLE at 65 years for male and female in Bury.
Inequality in disability-free life expectancy at 65 years
There is a lack of publicly available data on inequality in DFLE at 65 years for both males and females at Bury and England levels.
Morbidity in Older Adults
Global Burden of Disease (GBD) tool provides modelled estimates on the burden of ill health and disability from hundreds of diseases, injuries, and risk factors around the world. Most recent data on the tool are available from 2019 and the age range for older adults in this tool kits is limited to 70 years and over.
The GBD tool offers modelled estimates of the burden that can be attributed to various risk factors. Years with Disability (YLD) are used to measure the burden of morbidity (living with a disease). In order to calculate the overall loss of quality of life, the YLD measure of morbidity combines the prevalence of each disease with a rating of the severity of its symptoms (aside from death itself).
Non-Communicable diseases were the most common conditions accounting for the greatest burden of disease for both males and females in Bury. Diabetes, age related hearing loss, COPD, low-back pains and falls were the top 5 most common causes of YLD in Bury males. Whereas, for females low back pain, diabetes, falls, age-related hearing loss and COPD were the top 5 most common causes in Bury females (Table 4).
Table 4: Top 5 conditions accounting for greatest burden of disease by Sex for Bury residents aged 70+ years (YLD rate per 100,000, % of total YLD)
.jpg)
Mortality-Leading causes
More up to date data from the year 2021 are available by 5 years age bands for leading causes of mortality in older age adults for Bury (ONS, 2021). Below we will present the leading cause of mortality for males aged 70 years and over by 5 years age band in Bury for each year from 2013 to 2021
Male
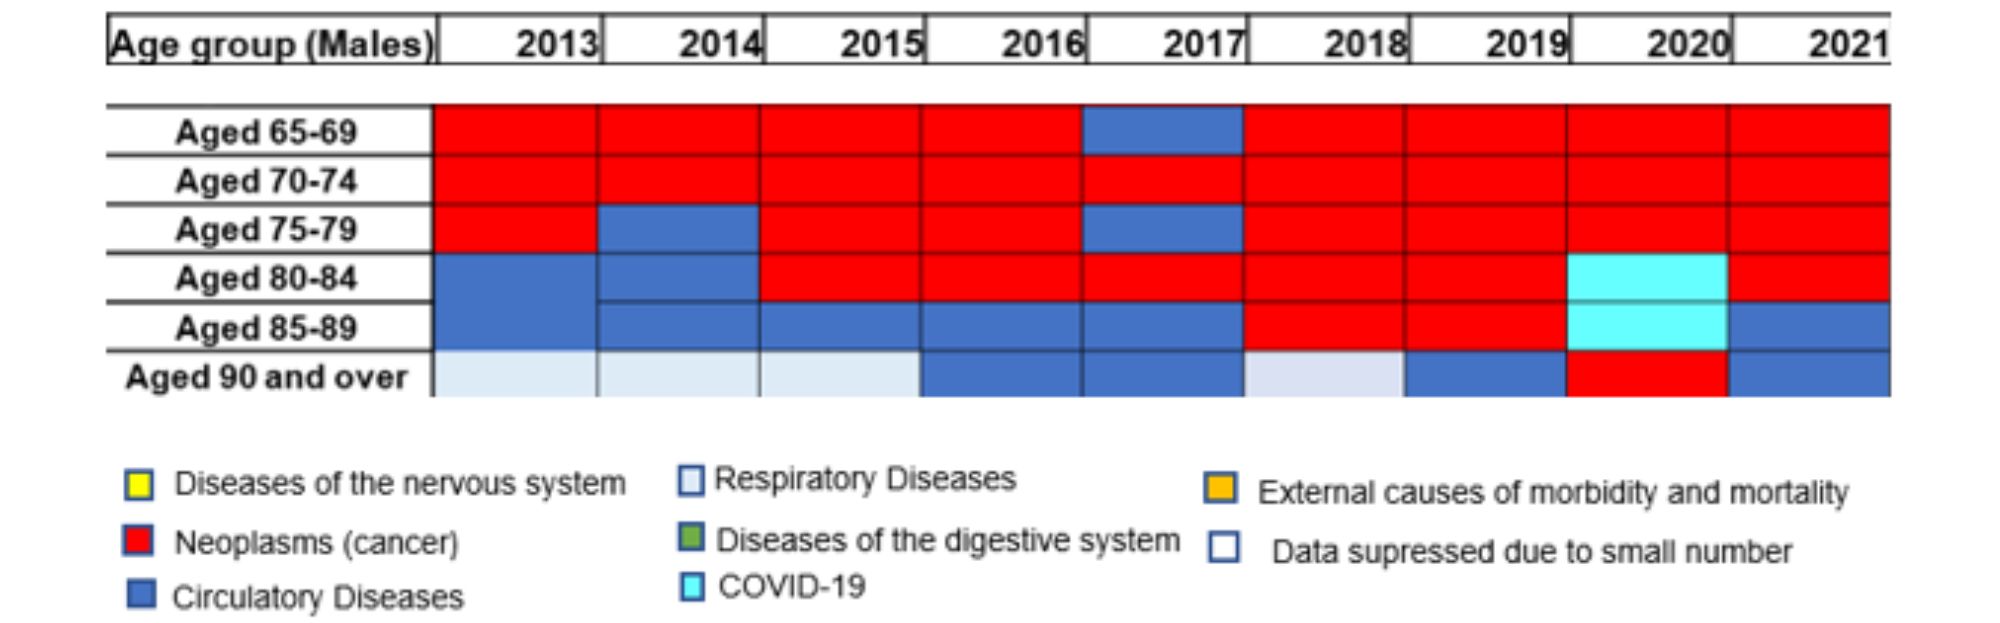
Neoplasms (cancer) are the leading cause of mortality for males aged 65 years and over for most years until 80-84 years. The most common cancers across these age groups contributing to mortality are lung and bowel cancers. Circulatory diseases, specifically ischaemic heart diseases, are the primary cause of death for most years in males aged 85 to 89, and respiratory and circulatory diseases are the primary causes of death for most years in people aged 90 and over. COVID-19 emerged as a leading cause of mortality for males aged 80-89 years in 2020. This highlights the impact of the COVID-19 pandemic on mortality rates in vulnerable population groups.
Table 5: Leading cause of mortality for males aged 65 years and over by five-year age bands in Bury from the year 2013 to 2021
Female
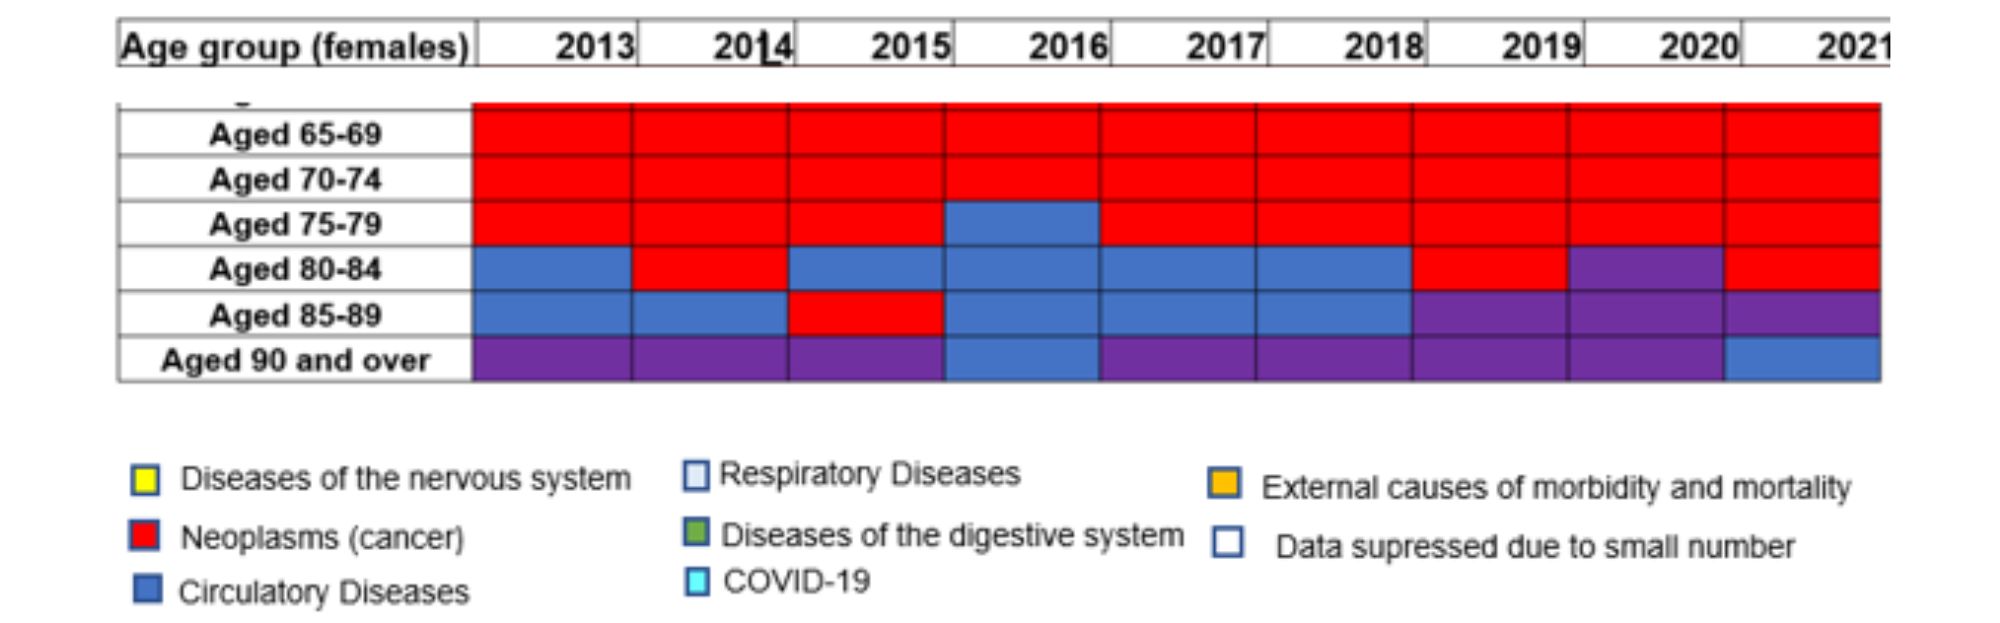
Examining the data for older age females in Bury (Table 6), neoplasms or cancers are the leading cause of mortality in females aged 65 years to 84 years of age. The most common cancers are lungs, bowel and breast cancers. Mental and behavioural disorders are a significant cause of mortality in females aged 85 and over, becoming the leading cause of mortality in the 85-89 years age group from 2019-2021 and the leading cause of mortality in the 90 and over age group. For females aged 85-89 years, mental and behavioural disorders (dementia) have replaced circulatory diseases as the leading cause of death.
Table 6: Leading cause of mortality for females aged 65 years and over by five-year age bands in Bury from the year 2013 to 2021
Mortality-risk factors
Number of risk factors can influence mortality in the population. Using the Global Burden of Disease tool, 87 disease risk factors can be ranked according to the percentage of fatalities they cause. The three main categories of risk factors are behavioural, metabolic, and environmental.
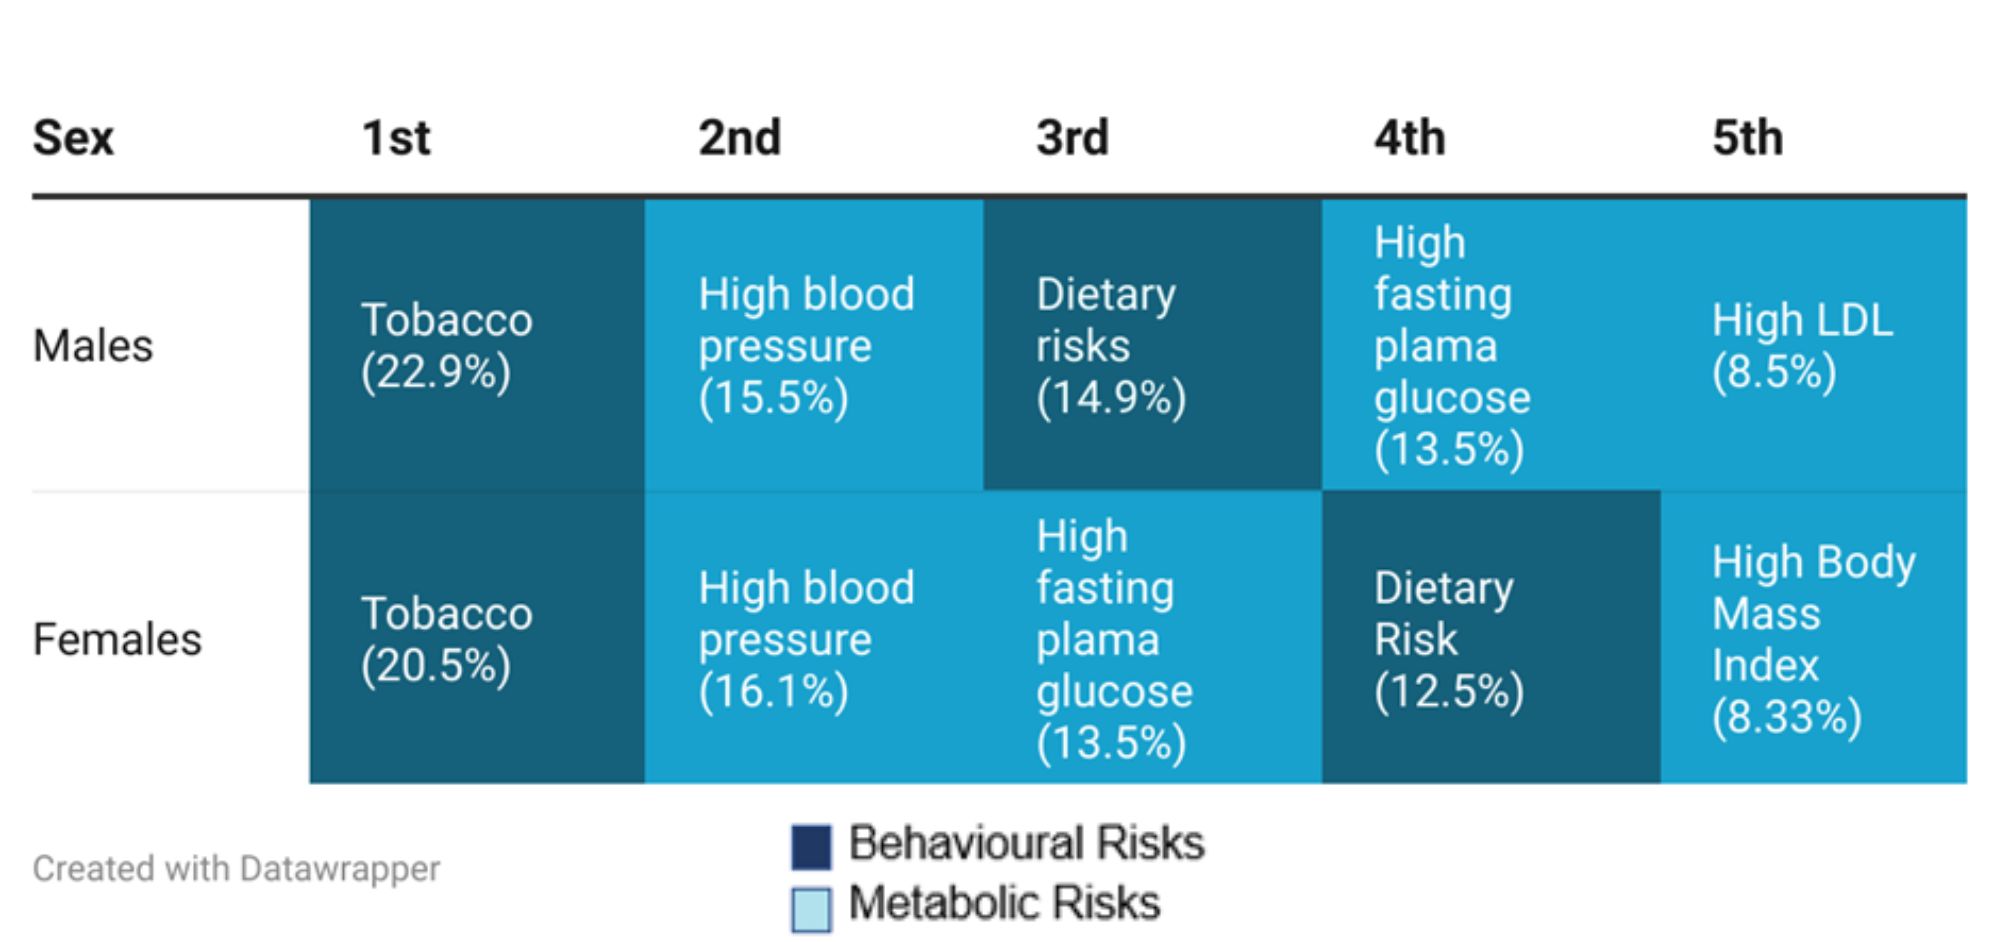
Smoking and high blood pressure are the leading contributor to deaths in both sexes over 70 years in Bury. Following these are dietary risks, high fasting plasma glucose and high LDL for males and high fasting plasma glucose, dietary risk and high BMI for females (Table 7).
Table 7: Top risk factors contributing to deaths by Sex for Bury residents aged 70+ years(% of total deaths)
Mortality-Specific conditions
In this section, we will present publicly available data on mortality rates among the older population for cancer, cardiovascular diseases, respiratory diseases, dementia, and winter-related factors.
Cancer
In the UK, 367,000 people are diagnosed with cancer annually. Around 40% of those cancers are caused by behavioural risk factor including smoking and alcohol (CRUK, 2020) and overweight and obesity. Annual NHS costs for cancer services are £5 billion, but the cost to society as a whole – including costs for loss of productivity – is £18.3 billion (HM Government, 2015).
Under-75 years of age - Cancer mortality
Under 75 years of age mortality from cancer (Persons) in Bury (156.9 per 100,000 population in those aged under 75 years) is higher than England (121.5 per 100,000) and North West averages (136 per 100,000). Amongst Bury’s statistical neighbours, Bury has the highest premature mortality rate from cancer, with the lowest rate in Calderdale (117.6).
Data in inequalities are only available by sex for Bury with slightly lower premature mortality from cancer in males (154.1 per 100,000) compared with females (154.1 per 100,000). Data on deprivation is only available at England level, where a social gradient is observed with higher mortality (149.4 per 100,000) in decile 1 compared with decile 10 (104.9 per 100,000).
Mortality rate from all cancers, in persons over 65 years of age
The directly standardised mortality rate from all cancers, in persons over 65 years of age in Bury is 1,248.2 per 100,000 population for the year 2021, higher than North West average of 1,108.3 per 100,000 and England average (statistically significant) of 1,030 per 100,000 (Productive Healthy Ageing Profile, 2021). There are no trend data available for Bury and England for mortality rate from all cancers, in persons over 65 years of age.
Bury has the highest all cancer mortality rate in persons over 65 years of age in its group of 16 statistical neighbours, with the lowest rate in Bedford of 932.9 per 100,000 (Figure 12).
Figure 12: Directly age-standardised mortality rate from all cancers in persons aged 65 years and over for Bury and its statistical neighbours per 100,000 population
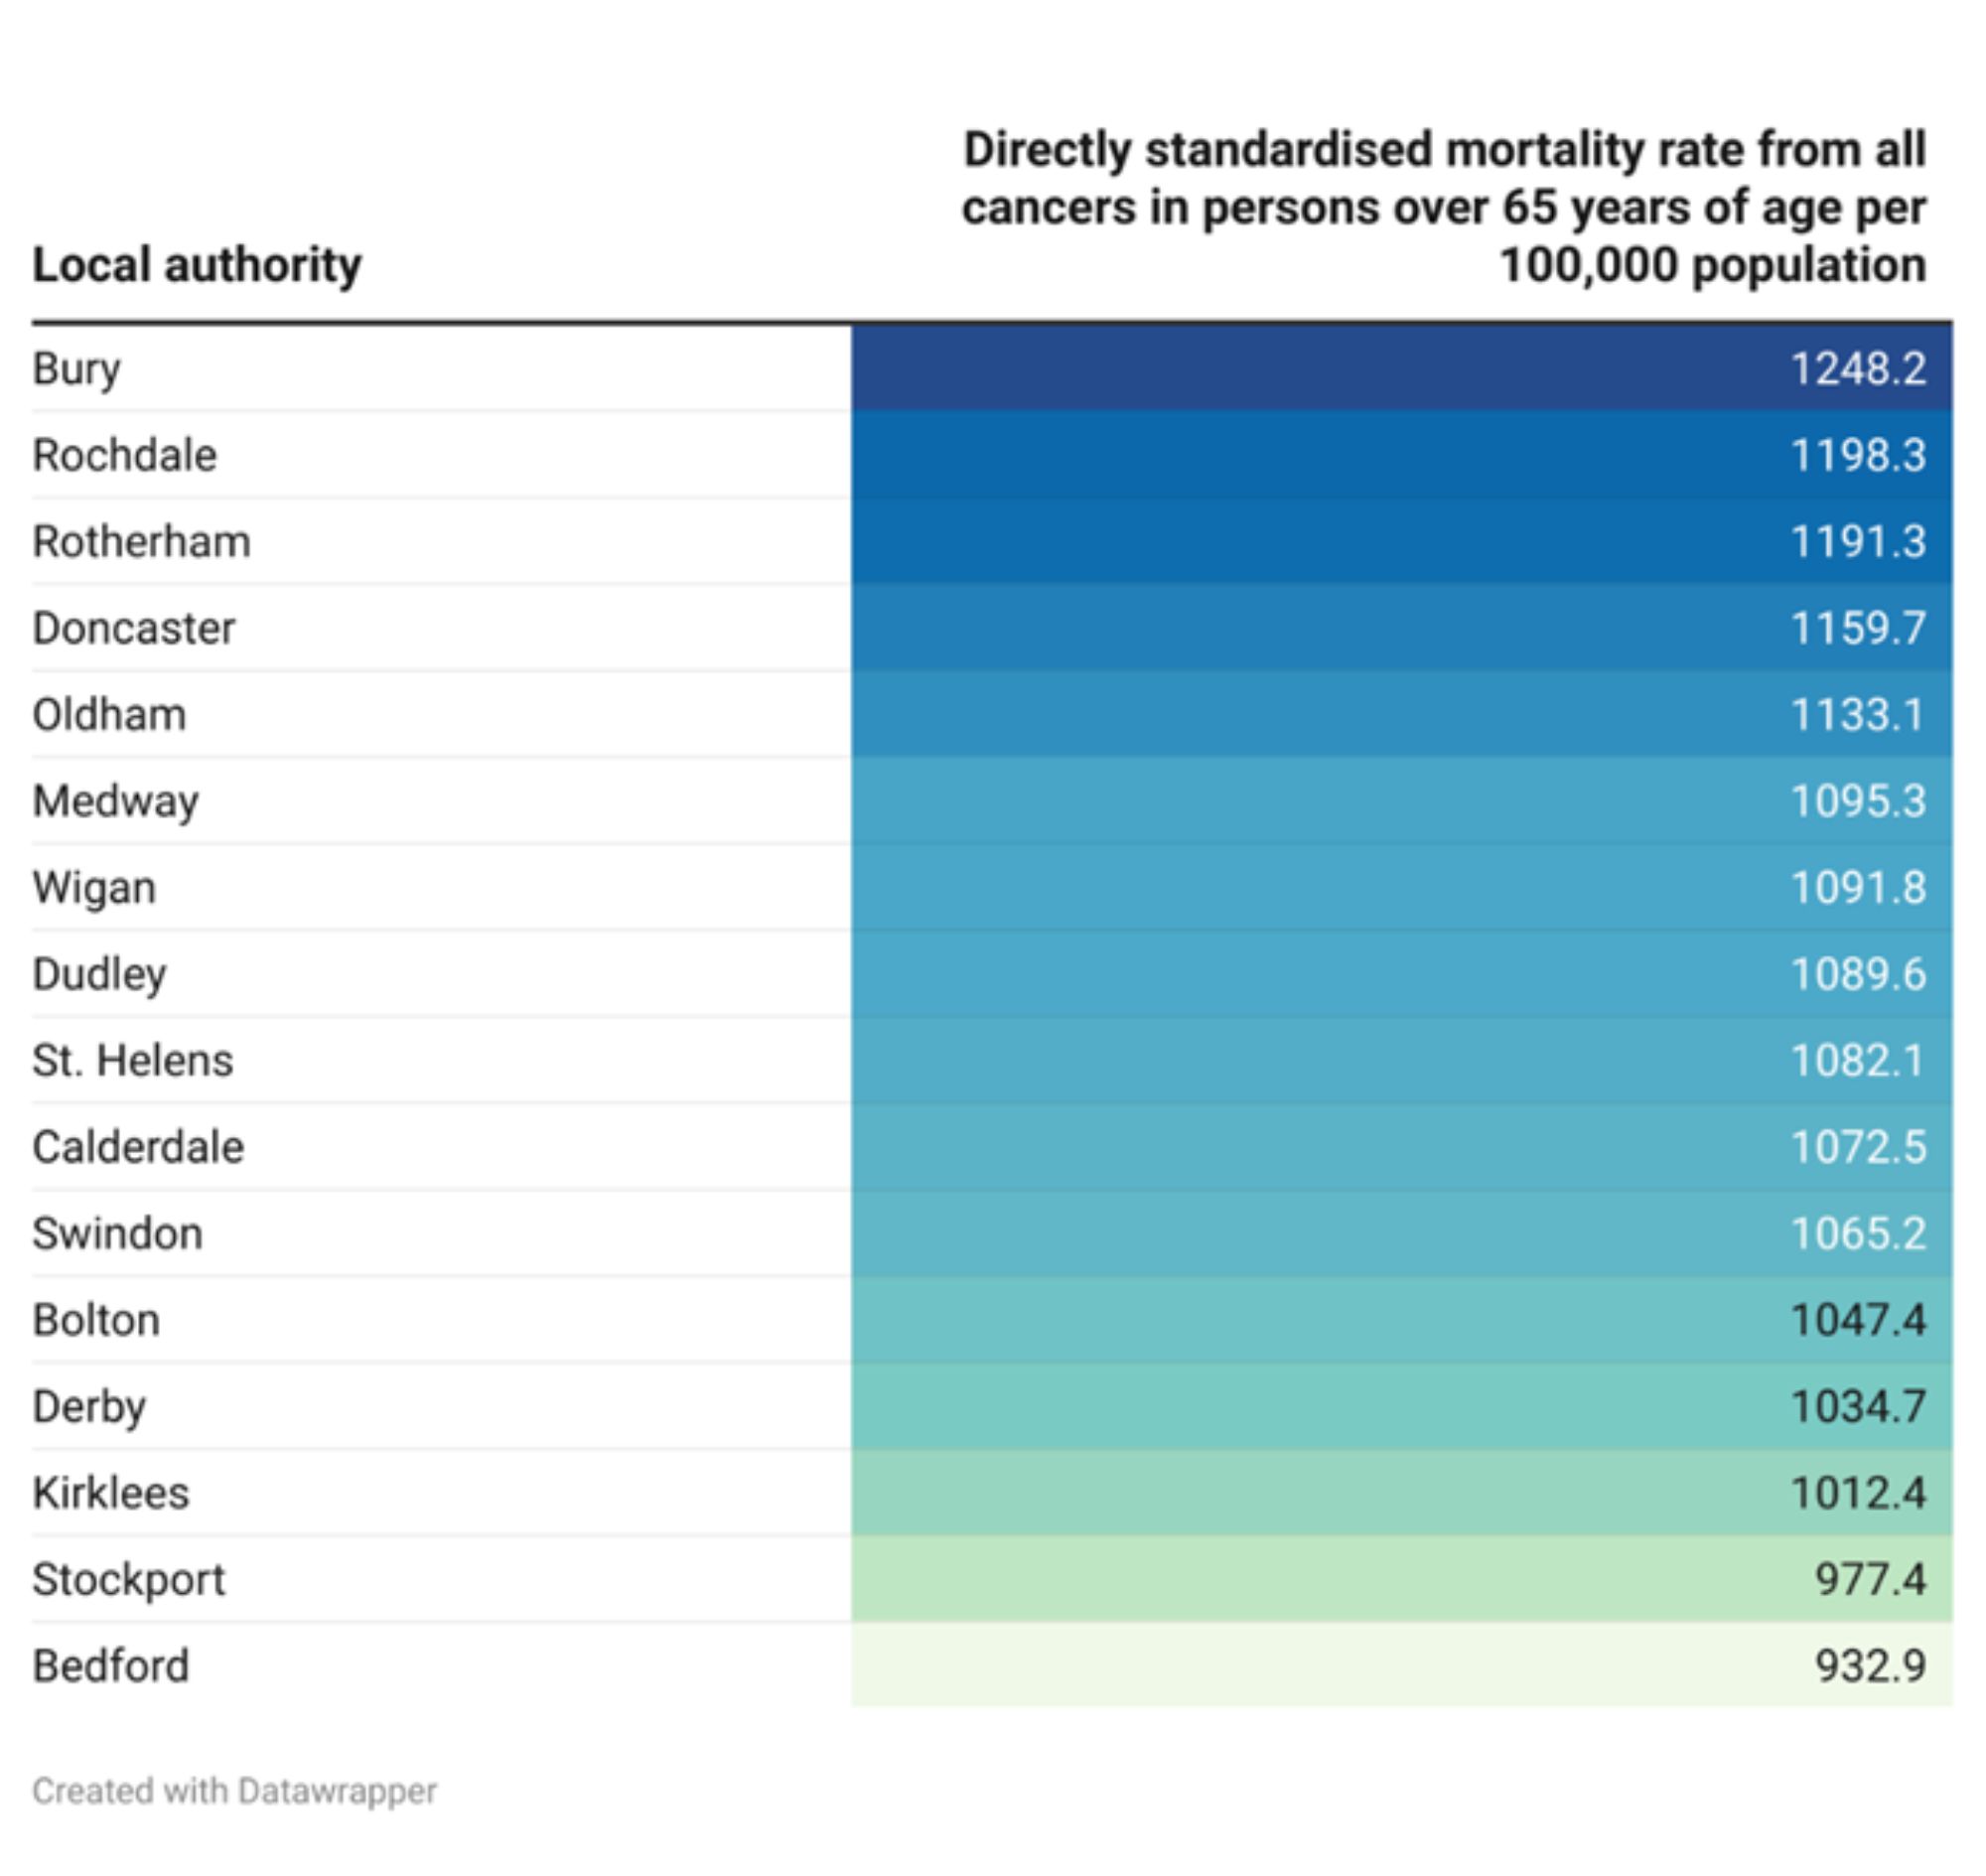
Data on inequalities in mortality rate from all cancers in persons over 65 years of age are only available by sex, where cancer mortality in males for the year 2021 is higher (1,404.9 per 100,000) compared with females (1,148,2 per 100,000).
Examining data on inequalities by sex for England show higher (statistically significant) mortality rates for males over 65 years of age at 1279.3 compared with females at 849.4. Data by deprivation are available for England only and shows a deprivation gradient where older age individuals in the most deprived decile (1,168.8 per 100,000) have higher cancer mortality rates compared with the least deprived decile (901.3 per 100,000) (Productive Healthy Ageing Profile, 2021).
Percentage of deaths with cancer as the underlying cause
This indicator presents the annual percentage of registered deaths where cancer is the underlying cause of death within the age range specified below. This information can assist local stakeholders including policy makers in identifying the impact of cancer on mortality in Bury.
Aged 65-74 years
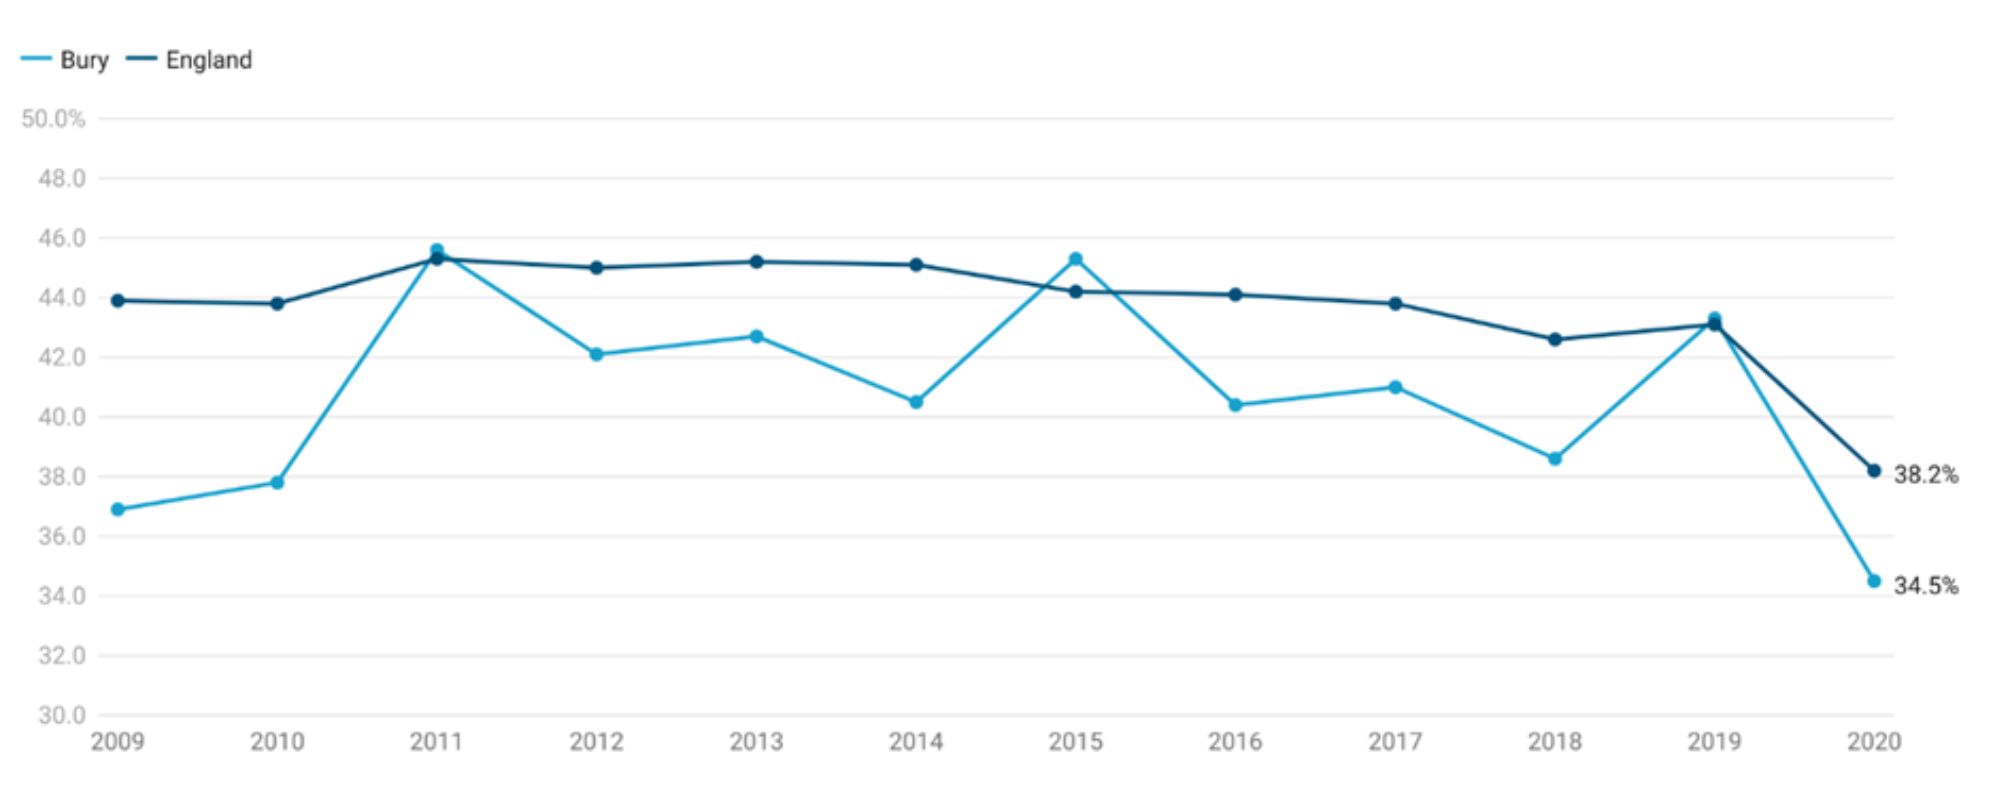
Cancer contributes to 34.5% of all deaths in individuals aged 65-74 years in Bury, statistically similar to England’s average of 38.2% (Productive Healthy Ageing Profile, 2020). There is no significant trend in Bury based on the five most recent data points. Examining data from 2009-2020, deaths (%) from cancer in individuals aged 65-74 years has ranged from the lowest at 34.5% in 2020 to the highest at 45.3% in 2015.
Percentage of deaths from cancer as the underlying cause in this age group in Bury increased from 36.9% in 2009 to 45.6% in 2011. This was followed by a period of stable proportion of deaths with slight fluctuations to 43.3% in 2019, before sharply declining to 34.5% in 2020. England saw a fairly similar trend with deaths (%) increasing from 43.9% in 2009 to 45.2% in 2013, before gradually declining to 31.5% in 2019. There was a sharp decline to 38.2% in the year 2020 (Figure 12). This sharp decline may be due to COVID-19 impact on the mortality patterns with greater proportion of underlying deaths from COVID-19 pandemic.
Comparing Bury with England, the percentage of deaths from cancer were generally slightly lower than England but statistically significant only for the years 2009 and 2010.
Figure 12.1: Percentage of deaths in 65-74 years of age with cancer as the underlying cause in Bury compared with England - 2009-2020
Bury has the 9th highest percentage of deaths with cancer as the underlying cause in its group of similar local authorities, with the highest proportion of deaths in Swindon at 41.8% and lowest in Rochdale at 29.8%.
Data on inequalities in Bury are only available by age with significantly higher proportion of deaths in 65-74 years age group (34.5%), and significantly lower proportion (12.7%) in 85 years and over age group when compared with all ages (Productive Healthy Ageing Profile, 2020). Similarly, data for England are also available by age only with statistically lower percentage of deaths with cancer as the underlying cause in those aged 85 years and over (13.8%) and statistically higher in 75-84 years (27.4%) and 65-74 years (38.2%) (Productive Healthy Ageing Profile, 2020).
Aged 75-84 years
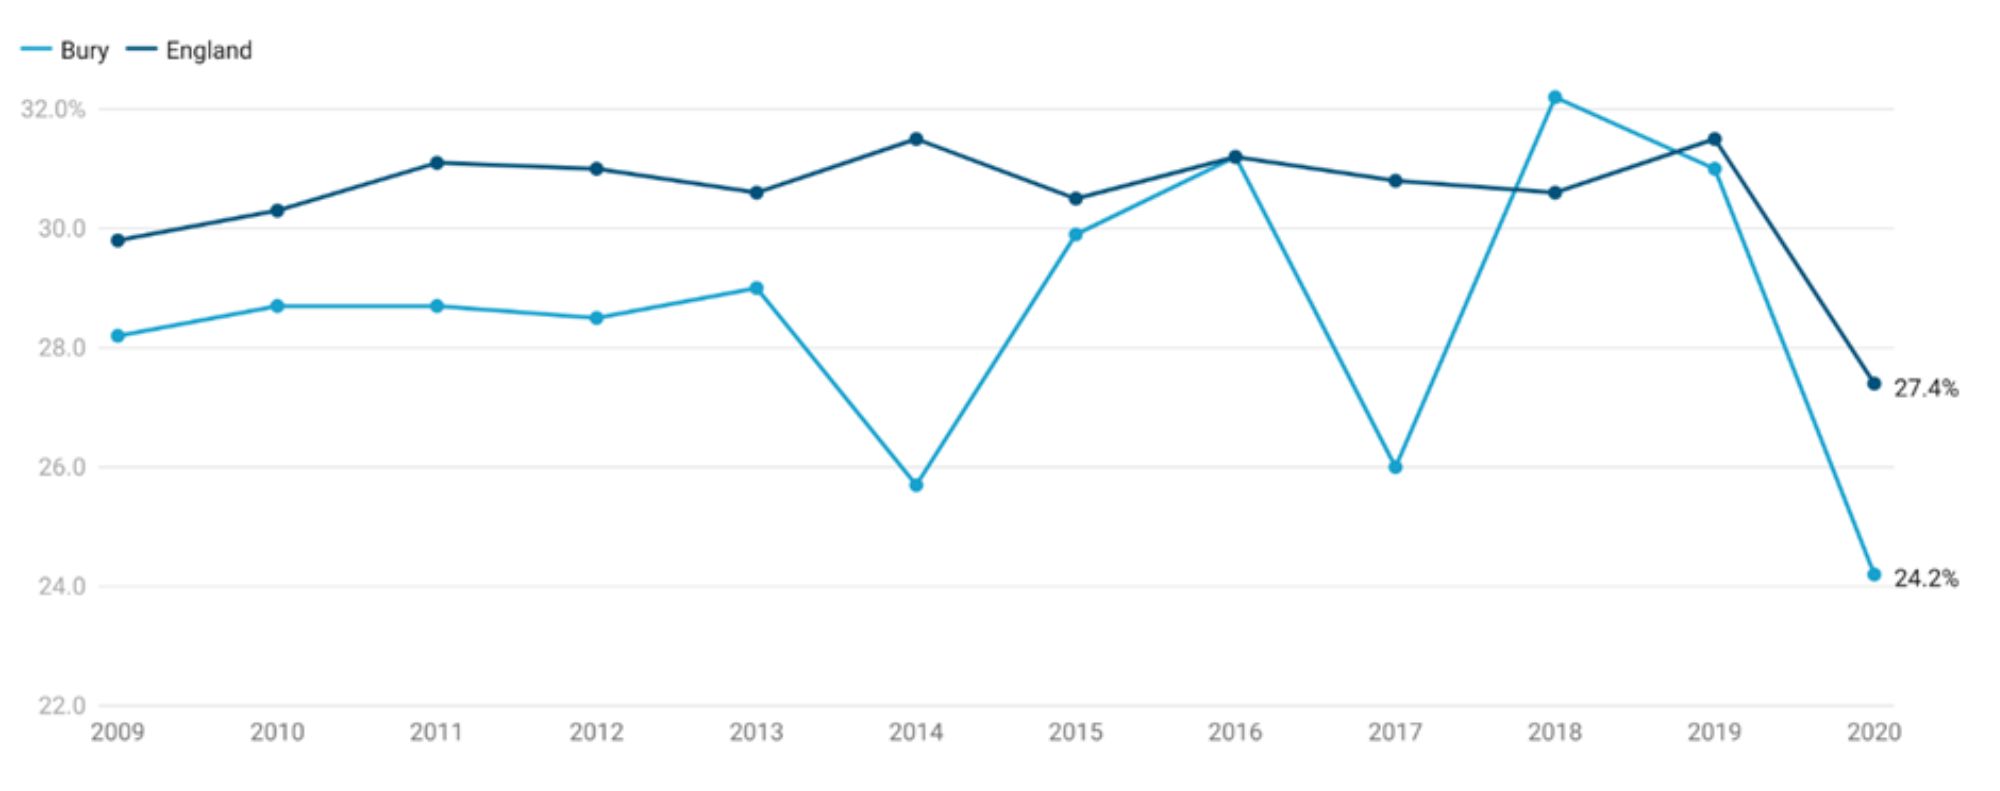
Based on the most recent data for 2020, cancer causes 24.2% of all deaths in Bury's population aged 75-84 years, which is statistically comparable to England's national average of 27.4 (Productive Healthy Ageing Profile, 2020). According to data from 2009 to 2021, deaths (percent) from cancer among people 75-84 years old ranged from the lowest 24.2% in 2020 to the highest 32.2% in 2018.
In Bury, the percentage of deaths with cancer as the primary cause gradually increased (with some fluctuations) from 28.2% in 2009 to 32.2% in 2018. Following this, there was a sharper decline to 24.2% in 2020. Based on the five most recent data points, there is no discernible trend in Bury. In England, the percentage of deaths rose slightly with some fluctuations from 29.8% in 2009 to 31.5% in 2019, followed by a sharp decline to 27.4% in the most recent data point in 2020 (Figure 13).
Comparing Bury with England, the percentage of deaths from cancer were generally slightly lower than England but statistically significant only for the years 2014 and 2017 only.
Figure 12.2: Percentage of deaths in 75-84 years of age with cancer as the underlying cause in Bury compared with England - 2009-2020
In a group of local authorities with similar demographics, Bury has the 5th lowest percentage of deaths in those aged 75-84 years with cancer as the primary cause, with Swindon having the highest percentage at 31.2% and Wigan having the lowest at 22.1%.
Only age-based data on inequalities in Bury are available (Productive Healthy Ageing Profile, 2020), and these have been described earlier in the 65-74 years sub-section.
Aged 85 years and over
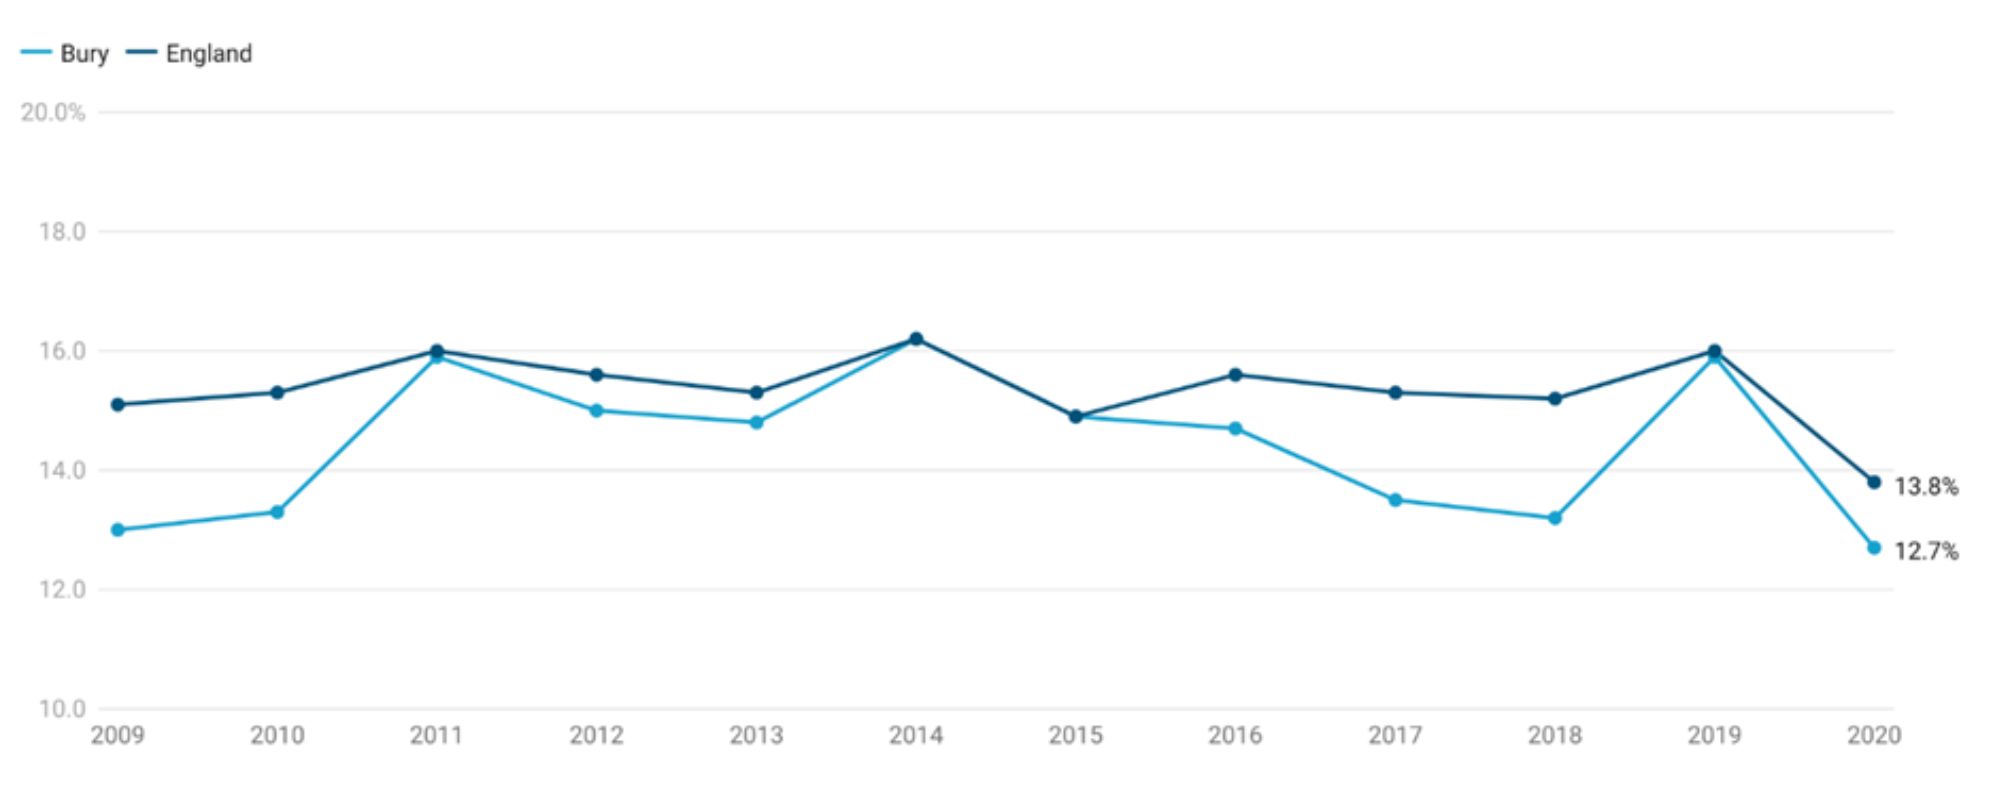
Cancer contributes to 12.7% of all deaths in individuals aged 85 years and over in Bury, statistically similar to England’s average of 13.8%. (Productive Healthy Ageing Profile, 2020). Based on the five most recent data points, there is no discernible trend in Bury. Examining data from 2009-2020, deaths (%) from cancer in individuals aged 85 years and over has ranged from the lowest at 12.7% in 2020 to the highest at 16.2% in 2014.
Percentage of deaths from cancer as the underlying cause in this age group in Bury increased from 13% in 2009 to 16.2% in 2014, before gradually declining to 13.2% in 2018. This was followed by a sharp rise to 15.9% in 2019 and then a sharp decline to 12.7% in 2020. England saw a slight rise in percentage of cancer deaths in those aged 85 years and over from 15.1% in 2009 to 16% in 2019. The percentage fell to 13.8% in 2020 (Figure 13).
The percentage of deaths from cancer were generally slightly lower (but statistically similar) in Bury compared with England
Figure 13: Percentage of deaths in 85 years and over with cancer as the underlying cause in Bury compared with England - 2009-2020
Bury has the 5th lowest percentage of deaths with cancer as the underlying cause of deaths in its group of similar local authorities, with the highest proportion of deaths in Swindon at 31.2% and lowest in Wigan at 22.1%.
Data on inequalities in Bury are only available by age and have been described in the 65-74 years age group sub section earlier.
Cardiovascular Diseases
Cardiovascular disease (CVD) is a group of disorders that affect the heart and blood vessels, including coronary heart disease (CHD), stroke, heart failure, many causes of dementia and peripheral arterial disease. CVD is a major cause of death and disability in the England. It affects 6 million people and accounts for a quarter of deaths in England. Annual healthcare costs in England relating to CVD are estimated at £7.4 billion, with an annual cost to the wider economy of £15.8 billion (HM Government, 2019).
Under-75 years of age- CVD mortality
Under 75 years of age mortality from CVD (Persons) in Bury (93.1 per 100,000 population in those aged under 75 years) is higher than England (76 per 100,000) average but similar to North West average (92.8 per 100,000).
Data in inequalities are only available by sex for Bury with twice higher premature mortality from CVD in males (130.8 per 100,000) compared with females (57.1 per 100,000). Data on deprivation is only available at England level, where a social gradient is observed with higher mortality (109.6 per 100,000) in the most deprived decile (decile 1) compared with decile 10 (54.3 per 100,000).
Mortality rate from all CVDs, in persons over 65 years of age
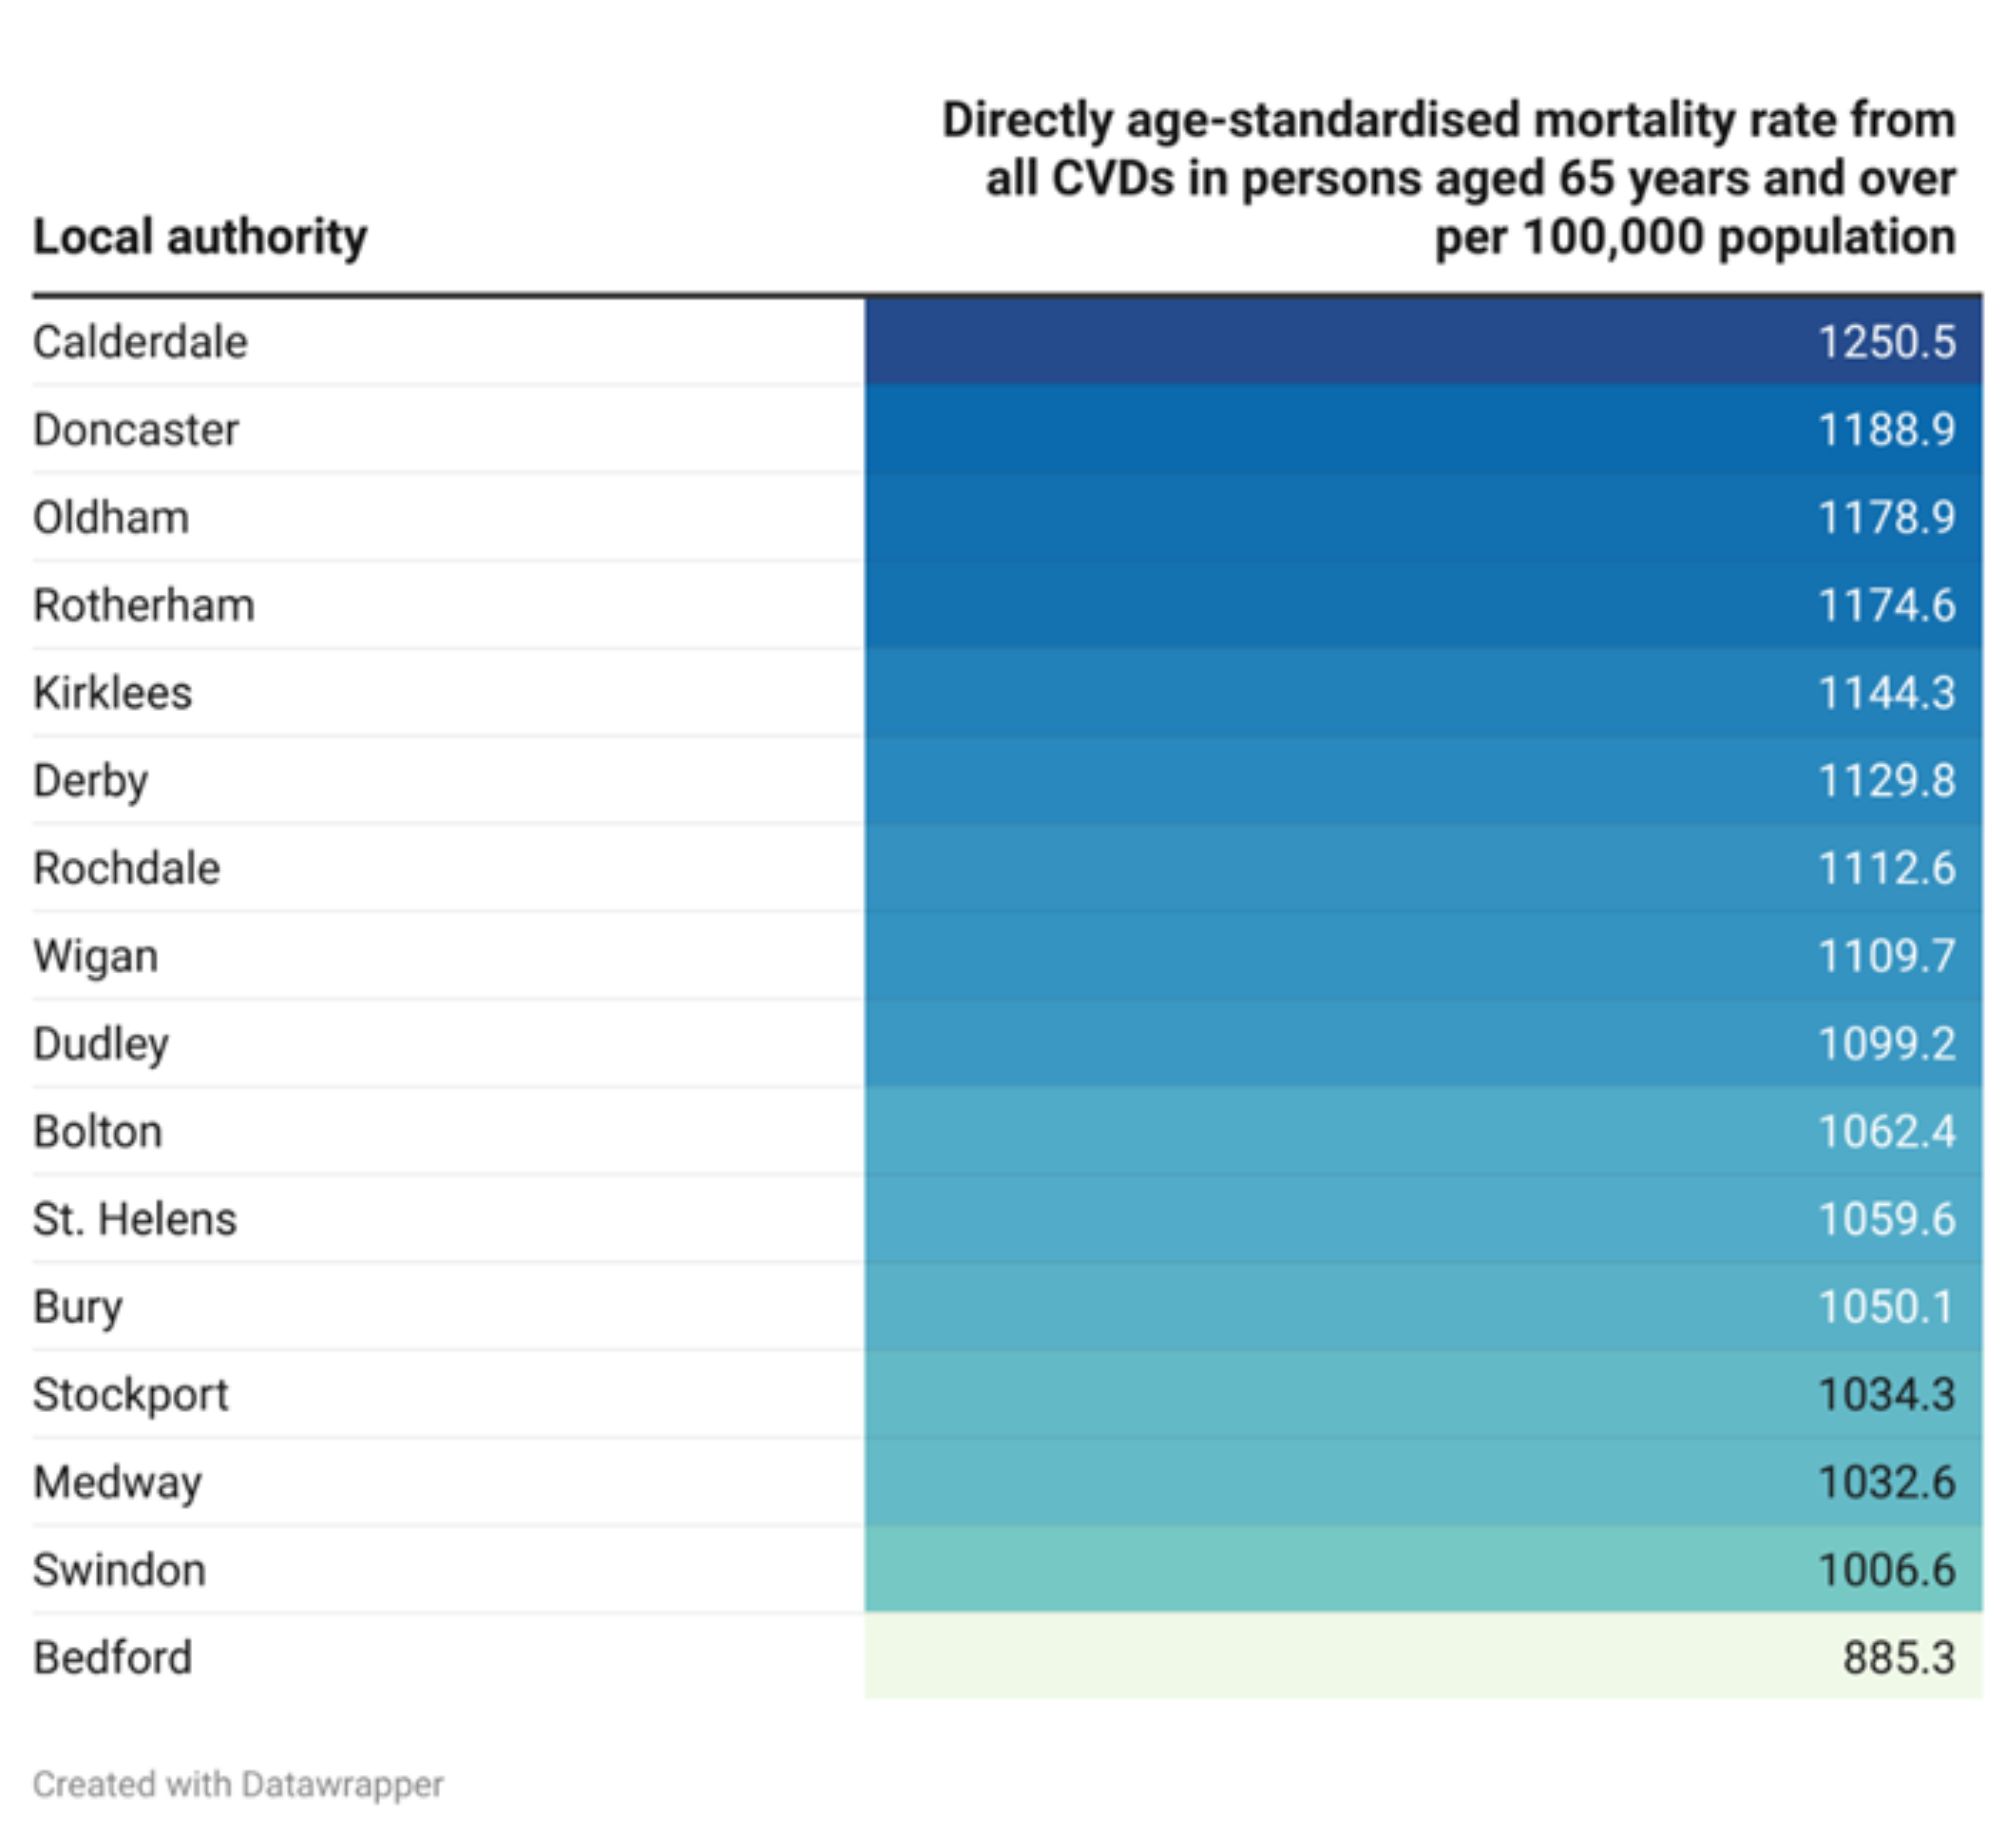
The directly standardised mortality rate from all CVDs for people over 65 in Bury is 1,050.1 per 100,000 population in 2021, lower than the average for the North West (1,092.9 per 100,000) and statistically similar to England average of 1021.4 points per 100,000 (Productive Healthy Ageing Profile, 2021). For the mortality rate from CVD in people over 65, there are no trend data available for Bury or England.
In its group of 16 statistical neighbours, Bury has the 5th lowest CVD mortality rate among people over 65, with the highest rate in Calderdale (1,250.5) and lowest in Bedford (885.3) (Productive Healthy Ageing Profile, 2021).
Figure 14: Directly age-standardised mortality rate from all CVDs in persons aged 65 years and over for Bury and its statistical neighbours per 100,000 population
Data on disparities in mortality rates from all CVDs in people over 65 in Bury are only available by sex, with CVD mortality in men being higher and statistically significant (1,382.2 per 100,000) than cancer mortality in women (804.1 per 100,000) for the year 2021.
The mortality rates for men over 65 in England are higher (statistically significant) for 1251 compared to 839.6 for females. Data by deprivation are only available for England and show a deprivation gradient, with older age individuals in the most deprive decile (1,203.5 per 100,000) having higher CVD mortality rates than those in the least deprive decile (834.1 per 100,000) (Productive Healthy Ageing Profile, 2021).
Circulatory Diseases
Below we will identify the impact of circulatory disease on mortality in older adults (over 65 years of age) in England.
Percentage of deaths with circulatory disease as the underlying cause
This indicator presents the annual percentage of registered deaths where circulatory disease is the underlying cause of death within the age range specified below.
Aged 65-74 years
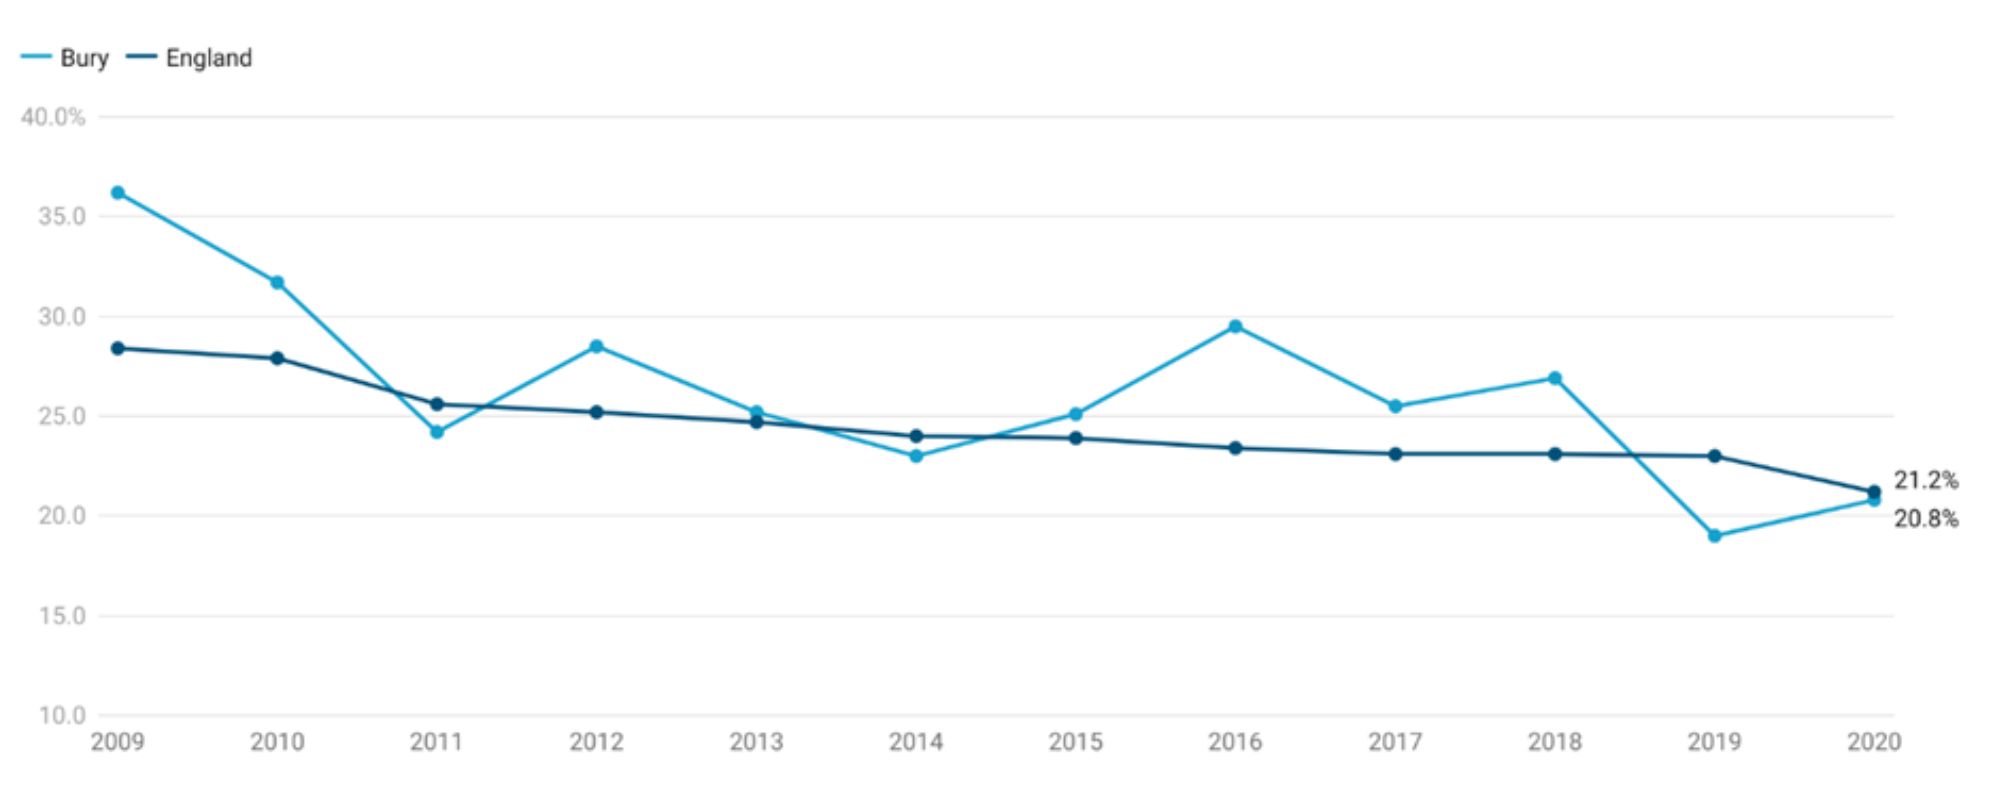
Circulatory disease contributes to 20.8% of all deaths in individuals aged 65-74 years in Bury, statistically similar to England’s average of 21.2% (Productive Healthy Ageing Profile, 2020). There is a decreasing trend (statistically significant) in Bury for the percentage of deaths with circulatory disease in population aged 65-74 years based on the five most recent data points. Examining data from 2009-2020, deaths (%) from circulatory disease in individuals aged 65-74 years has ranged from the lowest at 19% in 2019 to the highest at 36.2% in 2009.
Percentage of deaths from circulatory disease as the underlying cause for this age group in Bury declined from 36.2% in 2009 to 24.2% in 2011 and then increased to 28.5% in 2012. This was followed by a decline to 25.2% in 2013 with the percentage of deaths remaining fairly stable until 2015 at 25.1%. Circulatory disease mortality then increased sharply to 29.5% before gradually declining to 19% in 2019. There has been a slight rise to 20.8% in the most recent data from 20.8. England saw a constant decline from 28.4% in 2009 to 21.2% in 2020.
Comparing Bury with England, the percentage of deaths from circulatory disease in Bury were higher than England average from 2009 to 2018 (statistically significant for 2009 and 2016 only) and then lower but statistically similar to England average in 2019 and 2020.
Figure 15: Percentage of deaths in 65-74 years of age with circulatory disease as the underlying cause in Bury compared with England - 2009-2020
Bury has the 5th highest percentage of deaths with circulatory disease as the underlying cause in its group of similar local authorities, with the highest proportion of deaths in Calderdale at 24.9% and lowest in Wigan at 18.1%
Data on inequalities in Bury are only available by age with no statistical differences by each age group (65-74 years, 75 to 84 years and 85 and over years) when compared with all ages (Productive Healthy Ageing Profile, 2020). The percentage of deaths with circulatory disease as the underlying cause declines with each older age band with the highest percentage in 65-74 years (20.8%), 75-84 years (18%) and lowest in 85+ years (15.4%). Similarly, data for England are also available by age only with statistically lower percentage of deaths with circulatory disease as the underlying cause in those aged 65-74 years (21.2%) and statistically higher in 85 years (22.9%) (Productive Healthy Ageing Profile, 2020).
Aged 75-84 years
Based on the most recent data for 2020, circulatory disease causes 18% of all deaths in Bury's population aged 75-84 years, which is statistically lower than England's national average of 21.6% (Productive Healthy Ageing Profile, 2020). According to data from 2009 to 2021, deaths (percent) from circulatory disease among people 75-84 years old ranged from the lowest 21.6% in 2020 to the highest 34.8% in 2009.
In Bury, the percentage of deaths with circulatory disease as the primary cause gradually increased (with some fluctuations) from 32.7% in 2009 to 27.1% in 2013. Following this, there was a sharper rise to 32.7% in 2014. From 2014, percentage of deaths with circulatory disease as the primary cause have gradually declined to 18% in 2020. Based on the five most recent data points, percentage of deaths from circulatory disease in Bury are decreasing (statistically significant). In England, the percentage of deaths have been continuously declining from 34.8% in 2009 to 21.6% in 2020 (Figure 16).
Comparing Bury with England, the percentage of deaths from circulatory disease were generally slightly lower than England but statistically significant only for the years 2020
Figure 16: Percentage of deaths in 75-84 years of age with circulatory disease as the underlying cause in Bury compared with England - 2009-2020
In a group of local authorities with similar demographics, Bury has the lowest percentage of deaths in those aged 75-84 years with circulatory disease as the primary cause, with Dudley having the highest percentage at 23.1%.
Only age-based data on inequalities in Bury are available (Productive Healthy Ageing Profile, 2020), and these have been described earlier in the 65-74 years sub-section.
Aged 85 years and over
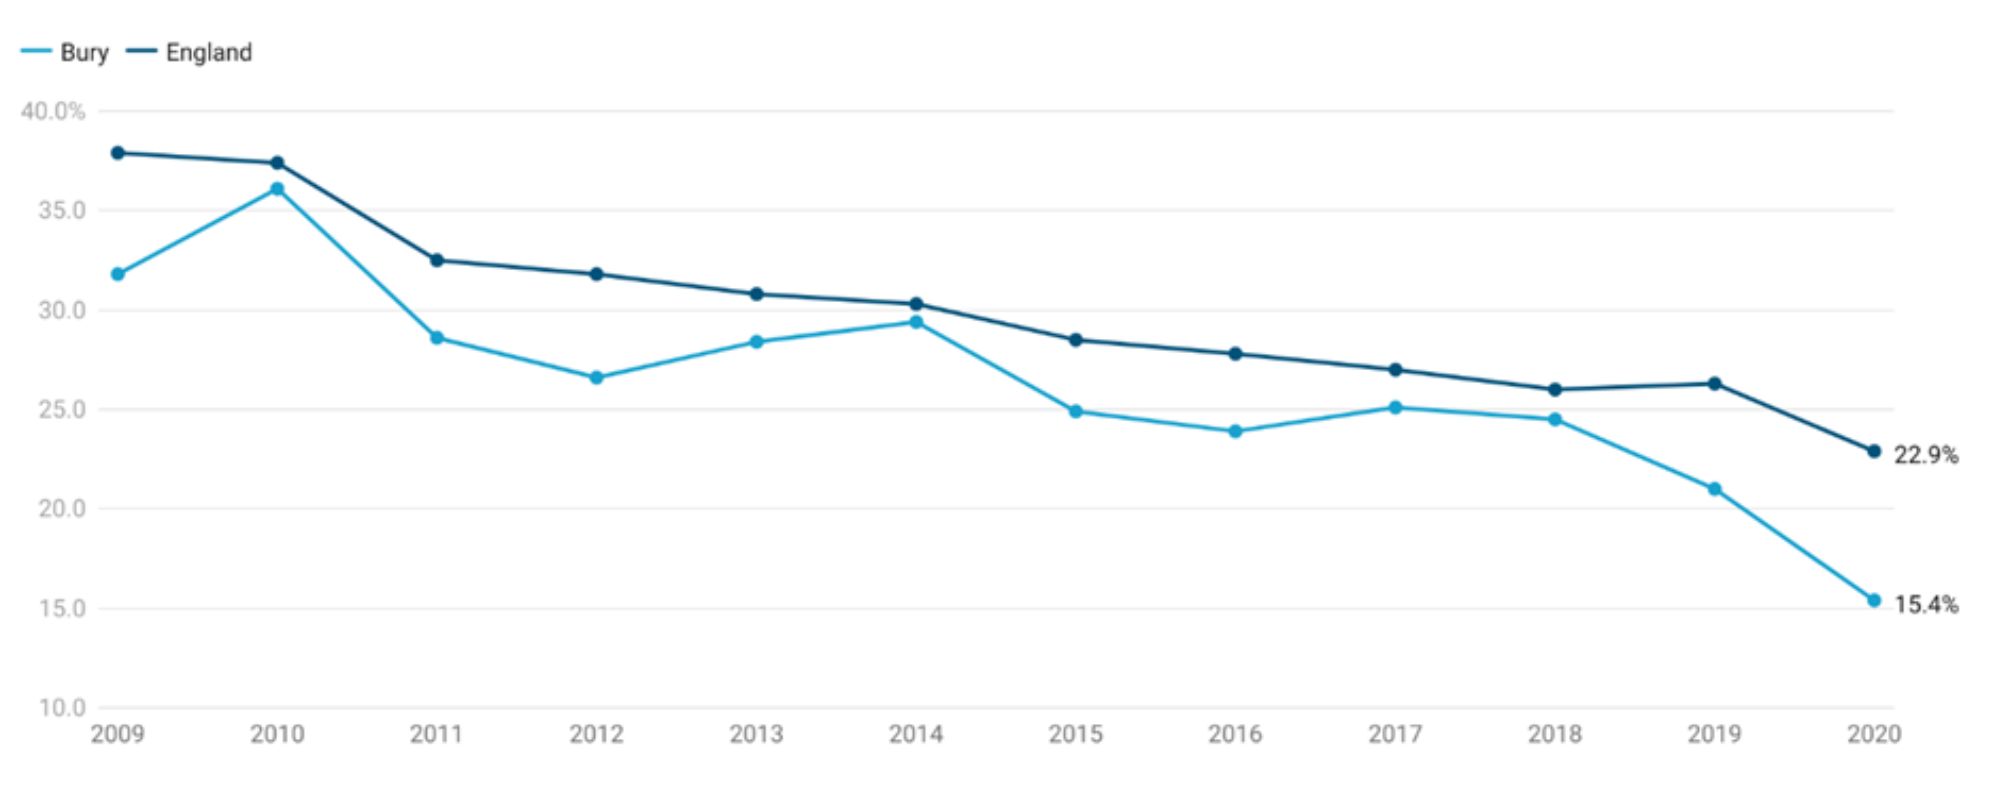
In Bury, circulatory disease contributes to 15.4% of all deaths in individuals aged 85 years and over in Bury, statistically below England’s average of 22.9% (Productive Healthy Ageing Profile, 2020). Recent trend based on the five most recent data points for Bury suggests that the percentage of deaths with circulatory disease as the underlying cause in those aged 85 years and over is decreasing (statistically significant). Examining data from 2009-2020, deaths (%) from circulatory disease in individuals aged 85 years and over has ranged from the lowest at 15.4% in 2020 to the highest at 36.1% in 2010.
Percentage of deaths from circulatory disease as the underlying cause in this age group in Bury increased from 31.8% in 2009 to 36.1% in 2020, before gradually declining with slight fluctuations to 15.4% in 2020. England saw a fairly similar trend with deaths (%) gradually declining to 37.9% in 2009 to 22.9% in 2020 (Figure 17).
Comparing Bury with England, the percentage of deaths from circulatory disease were generally slightly lower than England but statistically significant only for the years 2009, 2012, 2016 and the two most recent data points of 2019 and 2020.
Figure 17: Percentage of deaths in 85 years and over with circulatory disease as the underlying cause in Bury compared with England - 2009-2020
Bury has the lowest percentage of deaths with circulatory disease as the underlying cause in its group of similar local authorities, with the highest proportion of deaths in Dudley at 26.9%.
Data on inequalities in Bury are only available by age and have been described in the 65-74 years age group sub section earlier.
Respiratory disease
Respiratory disease is one of the top leading causes of premature mortality in England and smoking is the major cause of chronic obstructive pulmonary disease (COPD), one of the major respiratory diseases. Around 55% of these respiratory deaths are considered potentially preventable (OHID, 2021).
Under 75 years of age mortality from respiratory disease
Under 75 years of age mortality from respiratory disease (Persons) in Bury is 28.3 per 100,000 population in those aged under 75 years, similar to England average of 26.5 per 100,000 and lower than North West average of 35.3 per 100,000.
Data in inequalities are only available by sex for Bury with higher premature mortality from respiratory disease in males (34.3 per 100,000) compared with females (22.6 per 100,000). Data on deprivation is only available at England level that shows a sharp deprivation gradient with higher premature mortality in most deprived decile (decile 1) of 45.3 per 100,000 compared with 16.2 per 100,000 in the least deprived decile (decile 10).
Mortality rate from respiratory diseases, in persons over 65 years of age
This indicator is measured as age-standardised rate of mortality from respiratory disease in persons aged 65 and over per 100,000 population.
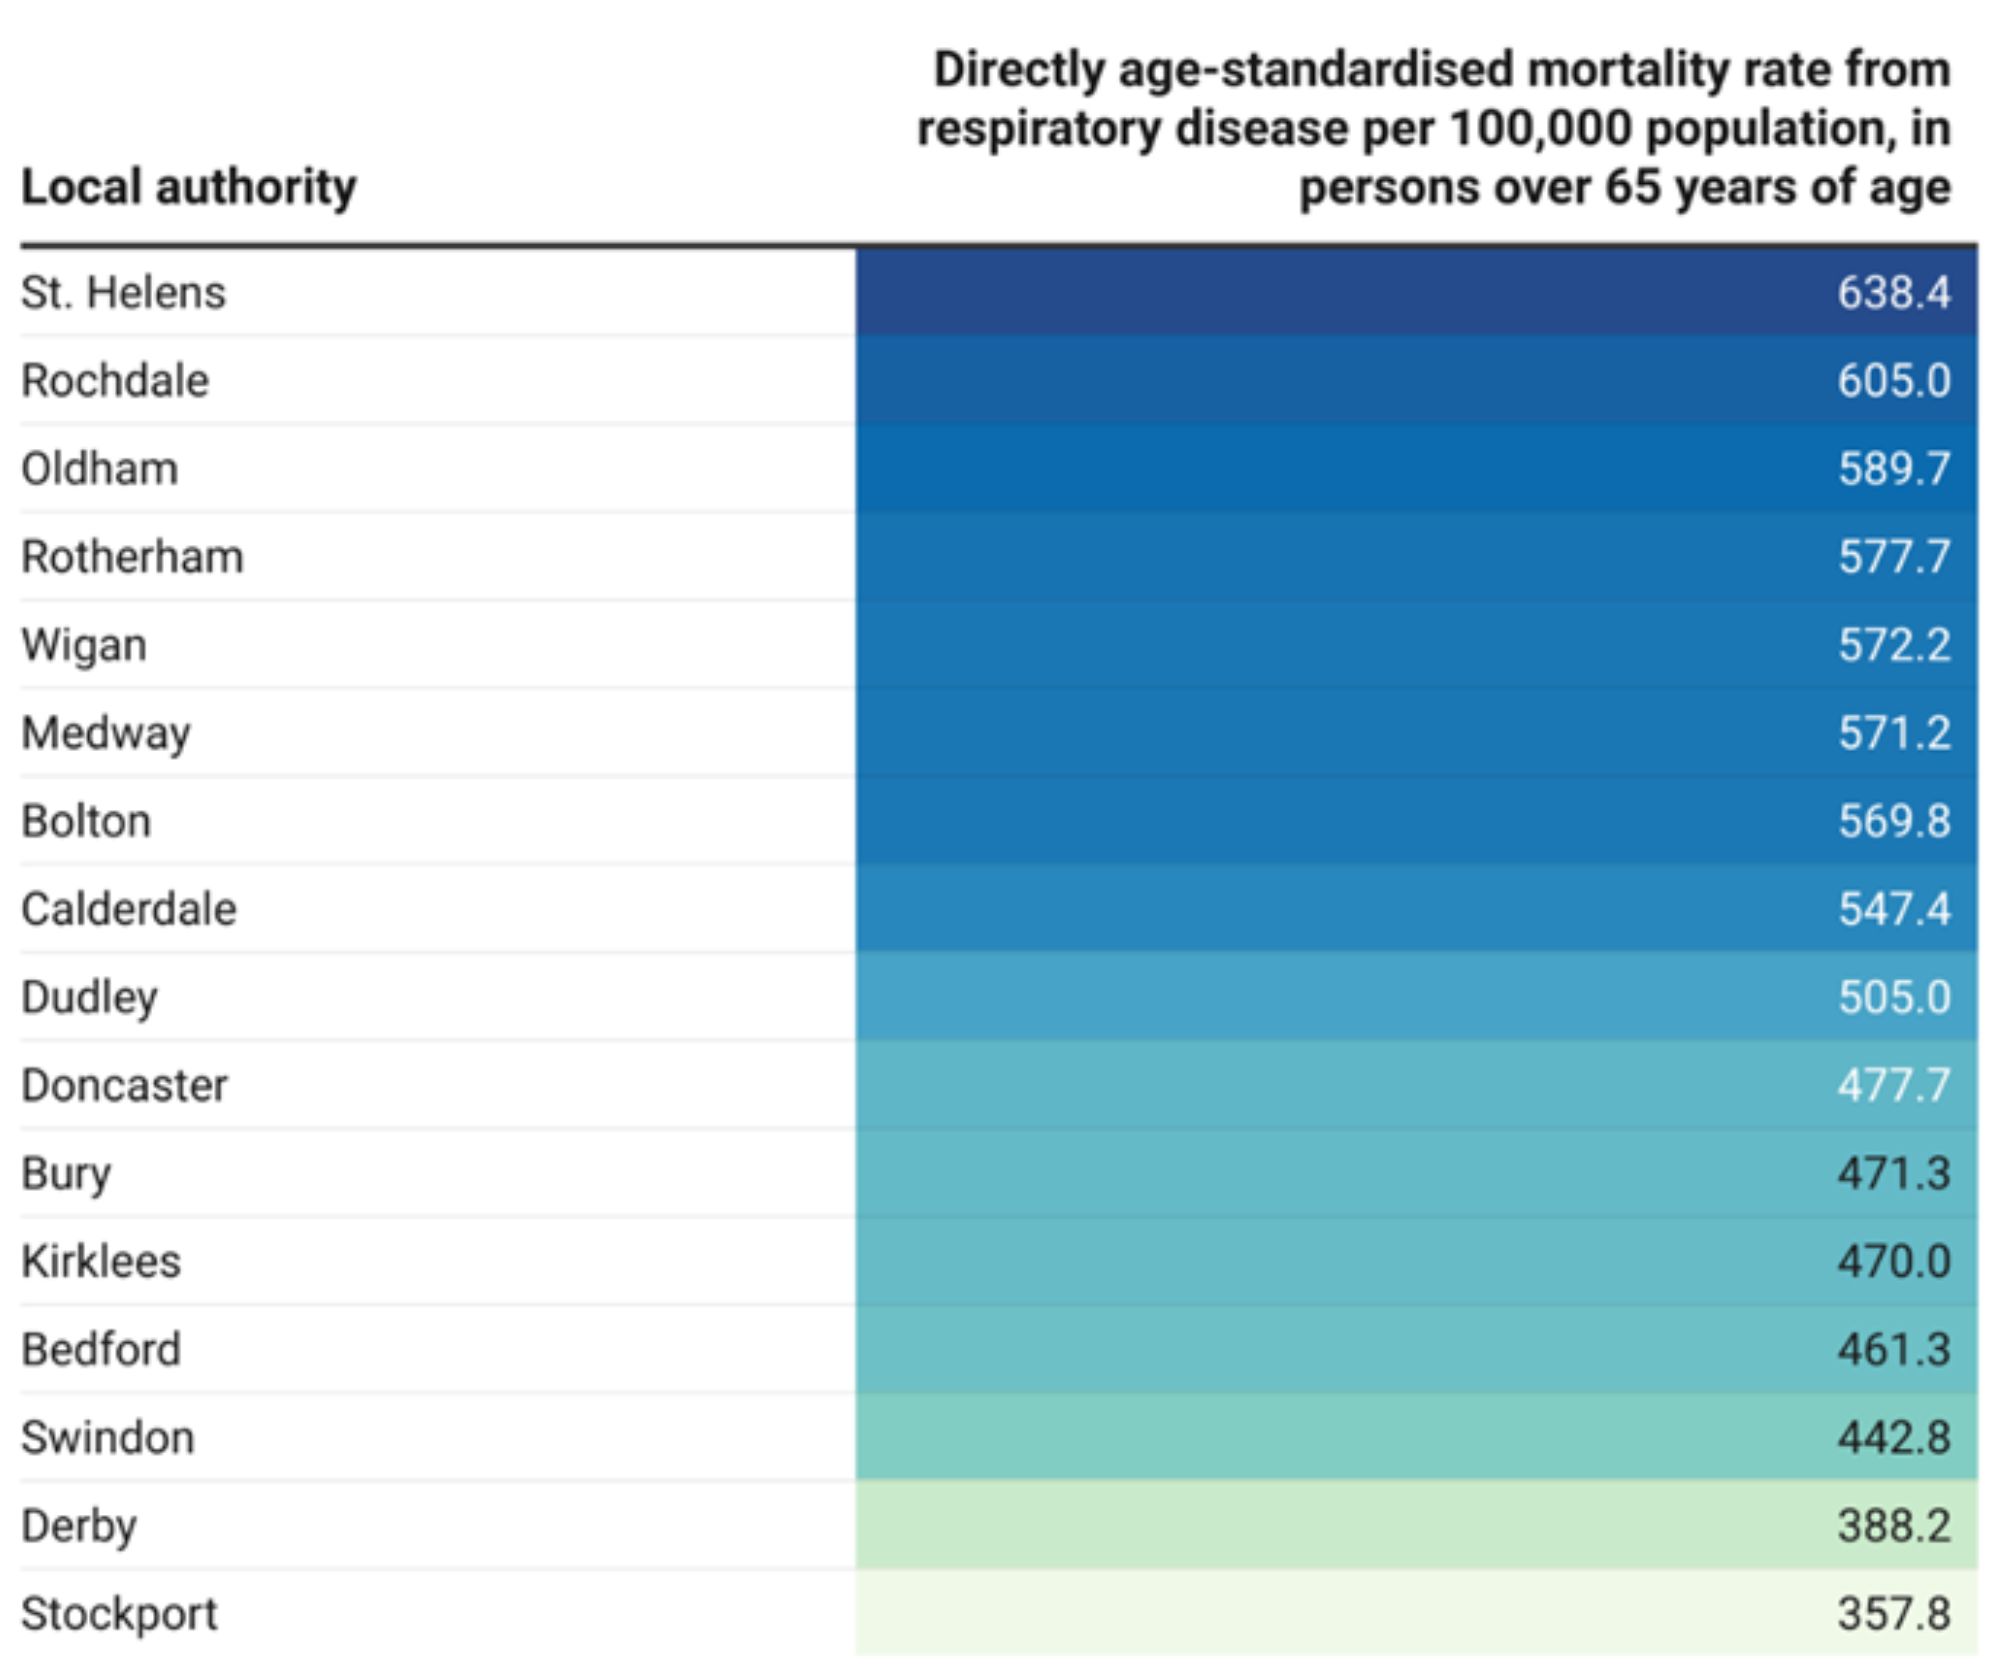
Mortality rate from respiratory disease, in persons over 65 years of age per 100,000 population for the year 2021 in Bury (471.3 per 100,000) is slightly higher than England average of 440.8 (although statistically similar) but lower than North West average of 529.2. Bury has the 6th lowest mortality from respiratory disease in its group of statistical neighbours with the highest mortality in St. Helens of 638.4 per 100,000 and lowest mortality in Stockport of 375.8 per 100,000 (Figure 18).
Figure 18: Directly age-standardised mortality rate from respiratory disease per 100,000 population, in persons over 65 years of age for Bury and its statistical neighbours
Data on inequalities in mortality rate from respiratory disease, in persons over 65 years of age are only available by sex in Bury, where respiratory disease mortality in males in 2021 is higher but statistically similar (578.7 per 100,000) compared with females (402.6 per 100,000). Data by sex for England suggest higher rates in males (544.7) compared with females (370).
Inequalities by deprivation are available for England only and suggests a social gradient, where adults over 65 years of age in the most deprived decile (579.9 per 100,000) have higher respiratory disease mortality rates compared with the least deprived decile (345.1 per 100,000).
Percentage of deaths with respiratory diseases as the underlying cause
This indicator presents the annual percentage of registered deaths where respiratory diseases are the underlying cause of death within the age range specified below. This information can assist local stakeholders including policy makers in identifying the impact of respiratory disease on mortality in Bury.
Aged 65-74 years
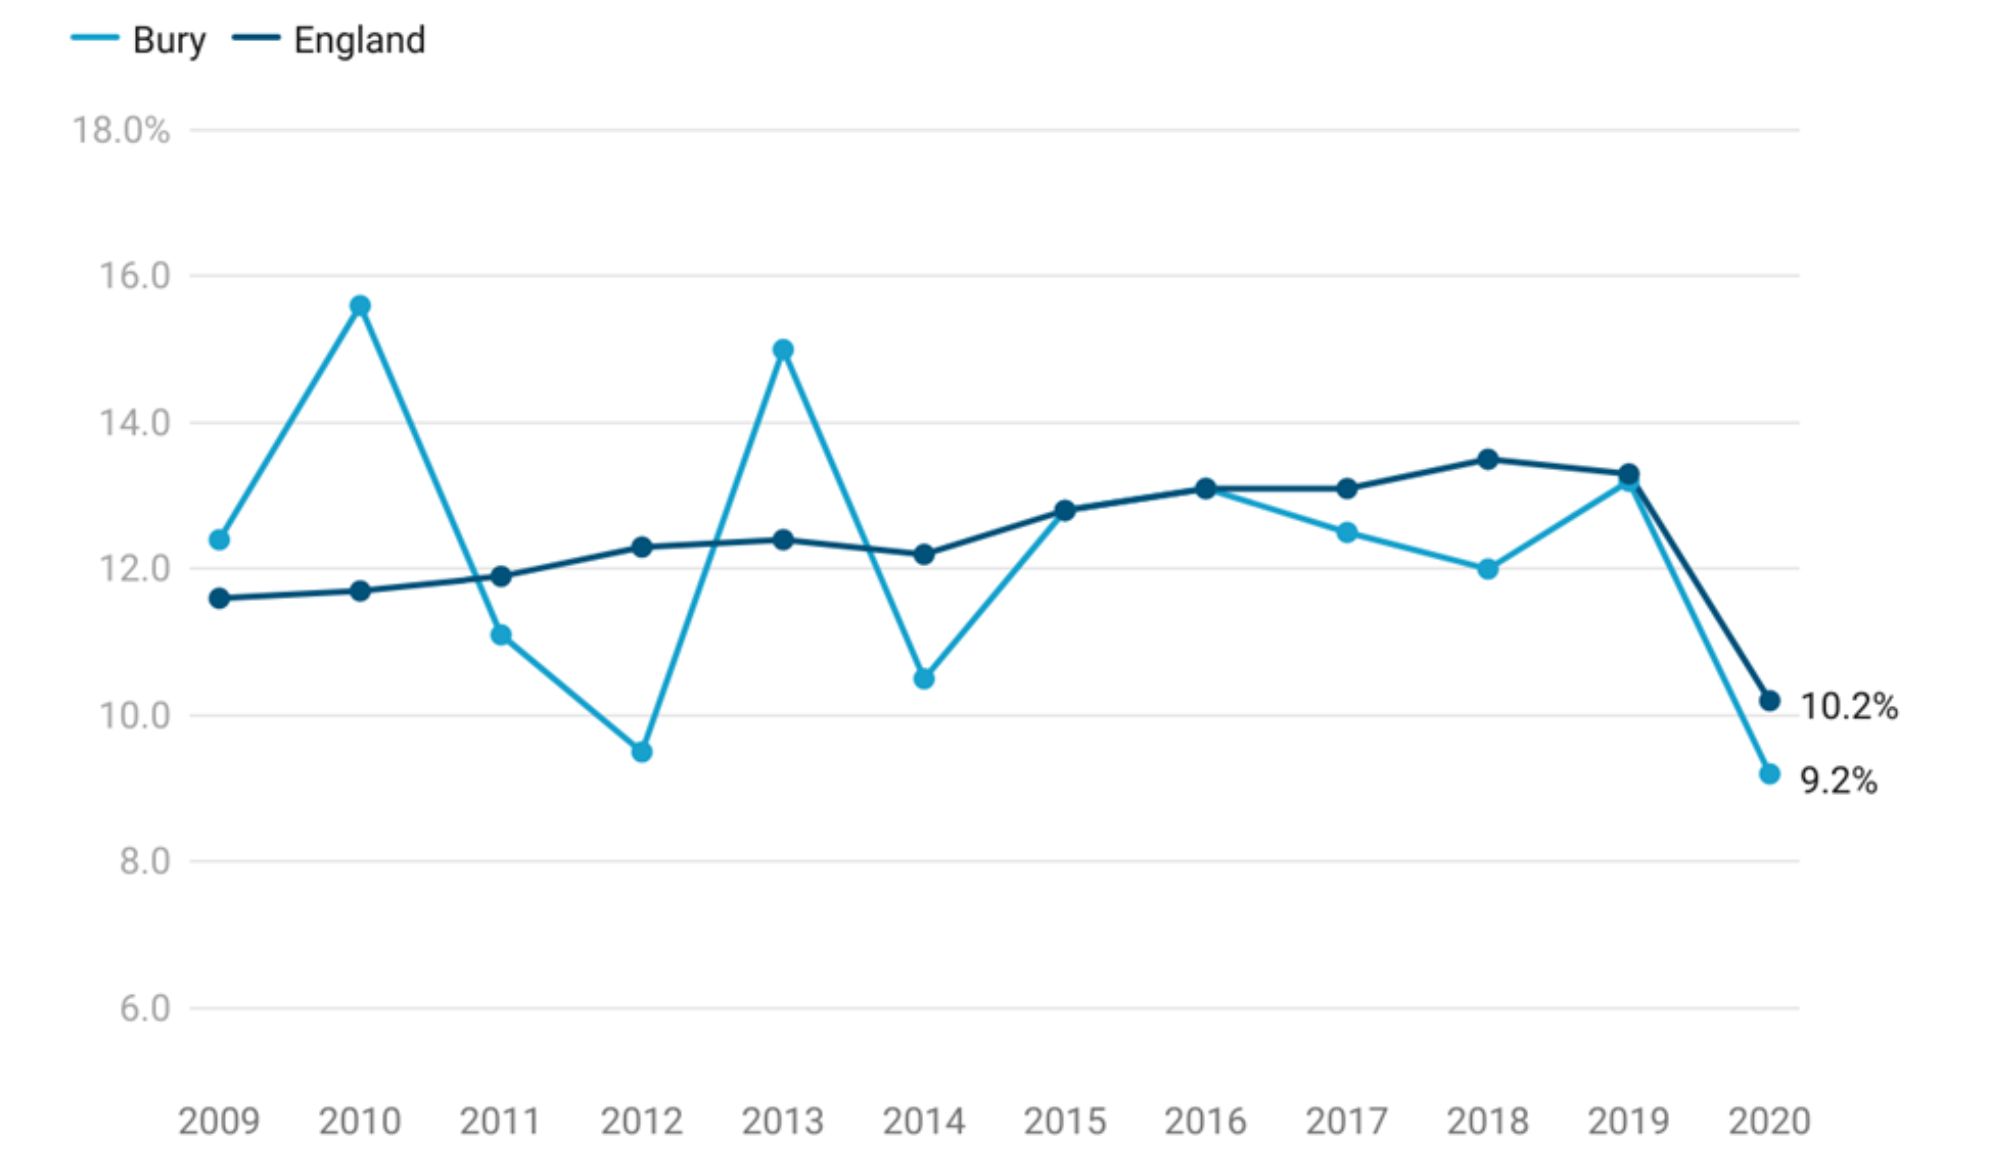
Respiratory diseases account for 9.2% of all deaths in Bury's population of 65- 74 year olds, which is statistically comparable to England's average of 10.2% (Productive Healthy Ageing Profile, 2020). Based on the five most recent data points, there is no significant change in trend for Bury. According to data from 2009 to 2020, deaths (percent) due to respiratory diseases among people aged 65 to 74 ranged from the lowest at 9.2% in 2020 to the highest at 15.6% in 2010.
In Bury, the percentage of deaths with respiratory illnesses as the primary cause in this age group rose sharply from 12.4% in 2009 to 15.6% in 2010. Following this, the percentage of deaths remained fairly stable until 2015 (12.8%) with some fluctuations including a slight decline in 2012 to 9.5% and a peak in 2013 to 15%. The percentage of deaths in England increased from 11.6% in 2009 to 13.3% in 2019 before sharply declining to 10.2% in 2020.
The percentage of deaths from respiratory illnesses in Bury were statistically similar to England average throughout the observed period, with the exception of 2010, where the percentage of deaths in Bury (15.6%) were statistically higher than England average of 11.7% (Figure 19).
Figure 19: Percentage of deaths in 65-74 years of age with respiratory diseases as the underlying cause in Bury compared with England - 2009-2020
Bury has the 10th highest percentage of deaths with respiratory diseases as the underlying cause in its group of similar local authorities, with the highest proportion of deaths in Rotherham at 15.2% and lowest in Oldham at 7%.
Data on inequalities in Bury are only available by age with higher proportion of deaths in 65-74 years age group (12.3%) and lowest in 65-74 years (9.2%) (Productive Healthy Ageing Profile, 2020). Similarly, data for England are also available by age only with statistically higher percentage of deaths with respiratory diseases as the underlying cause in those aged 75-84 years (11.1%) and 85 years and over (11%) (Productive Healthy Ageing Profile, 2020).
Aged 75-84 years
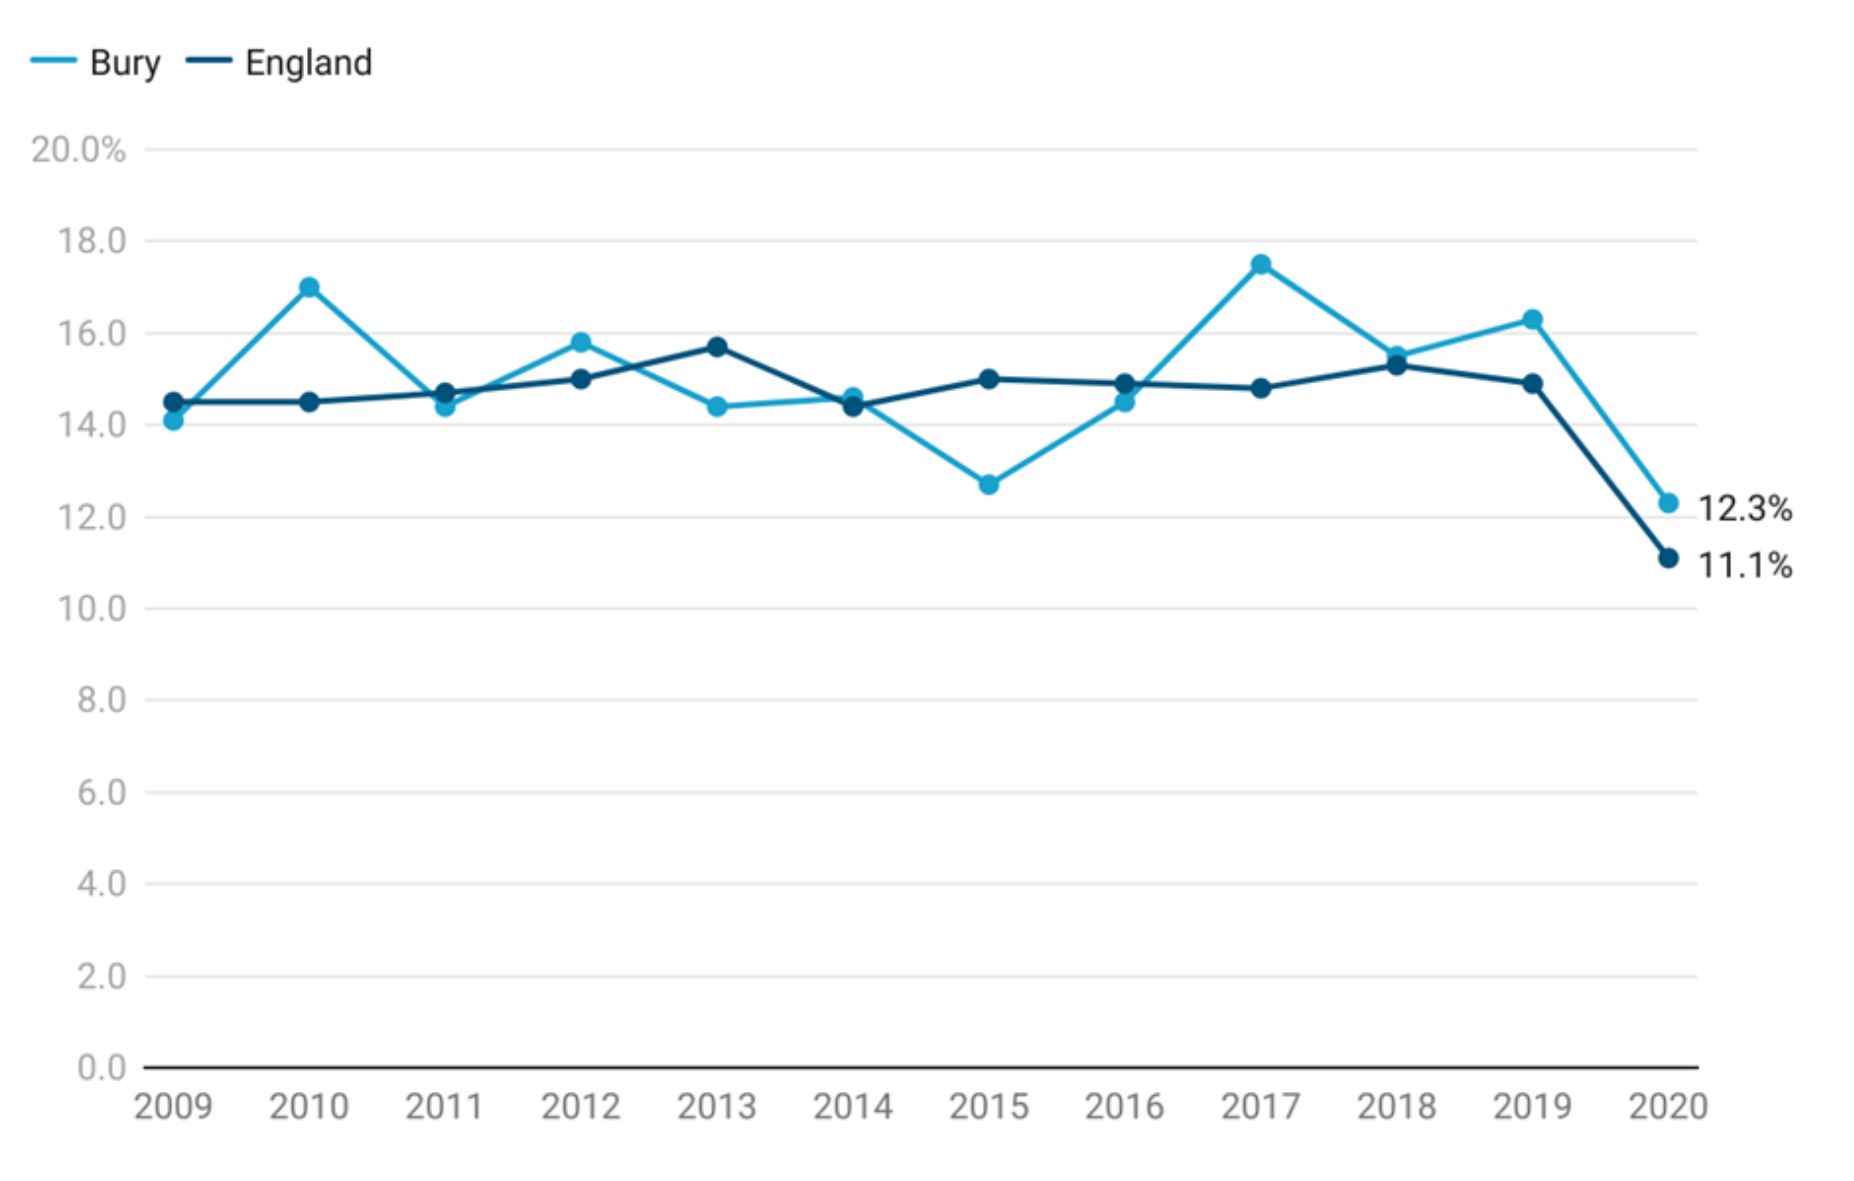
According to the most recent data for 2020, respiratory diseases account for 12.3% of all deaths in Bury's population aged 75 to 84, which is statistically comparable to England’s average of 11.1% (Productive Healthy Ageing Profile, 2020). According to data from 2009 to 2021, the percentage of deaths among people 75 to 84 years old that were caused by respiratory diseases ranged from the lowest 12.7% in 2015 to the highest 17.5% in 2017.
Data on respiratory disease deaths in Bury between 2009 and 2020 shows fluctuations with both increases and decreases. There is an initial increase from 14% in 2009 to 17% in 2010, then a decline to 14% in 2011. Following that, there were intermittent periods of minor increases and decreases until 2017, where there was sharp rise to 17.5% from 14.5% in 2016. The percentage of deaths then declined over the following years to 12.3% in 2020.There is no obvious trend in Bury according to the five most recent data points. The proportion of deaths in Bury remained stable from 2009 (14.5%) to 2019 (14.9%). In 2020, there was a sharp decline to 11.1% (Figure 13).
Comparing Bury with England, the percentage of deaths from respiratory diseases were generally slightly lower than England but not statistically significant for any year from 2009-2020.
Figure 20: Percentage of deaths in 75-84 years of age with respiratory as the underlying cause in Bury compared with England - 2009-2020
In a group of local authorities with similar demographics, Bury has the 7th highest percentage of deaths in those aged 75-84 years with respiratory diseases as the primary cause, with St. Helens having the highest percentage at 14.7% and Stockport having the lowest at 8.1%.
Only age-based data on inequalities in Bury are available (Productive Healthy Ageing Profile, 2020), and these have been described earlier in the 65-74 years sub-section.
Aged 85 years and over
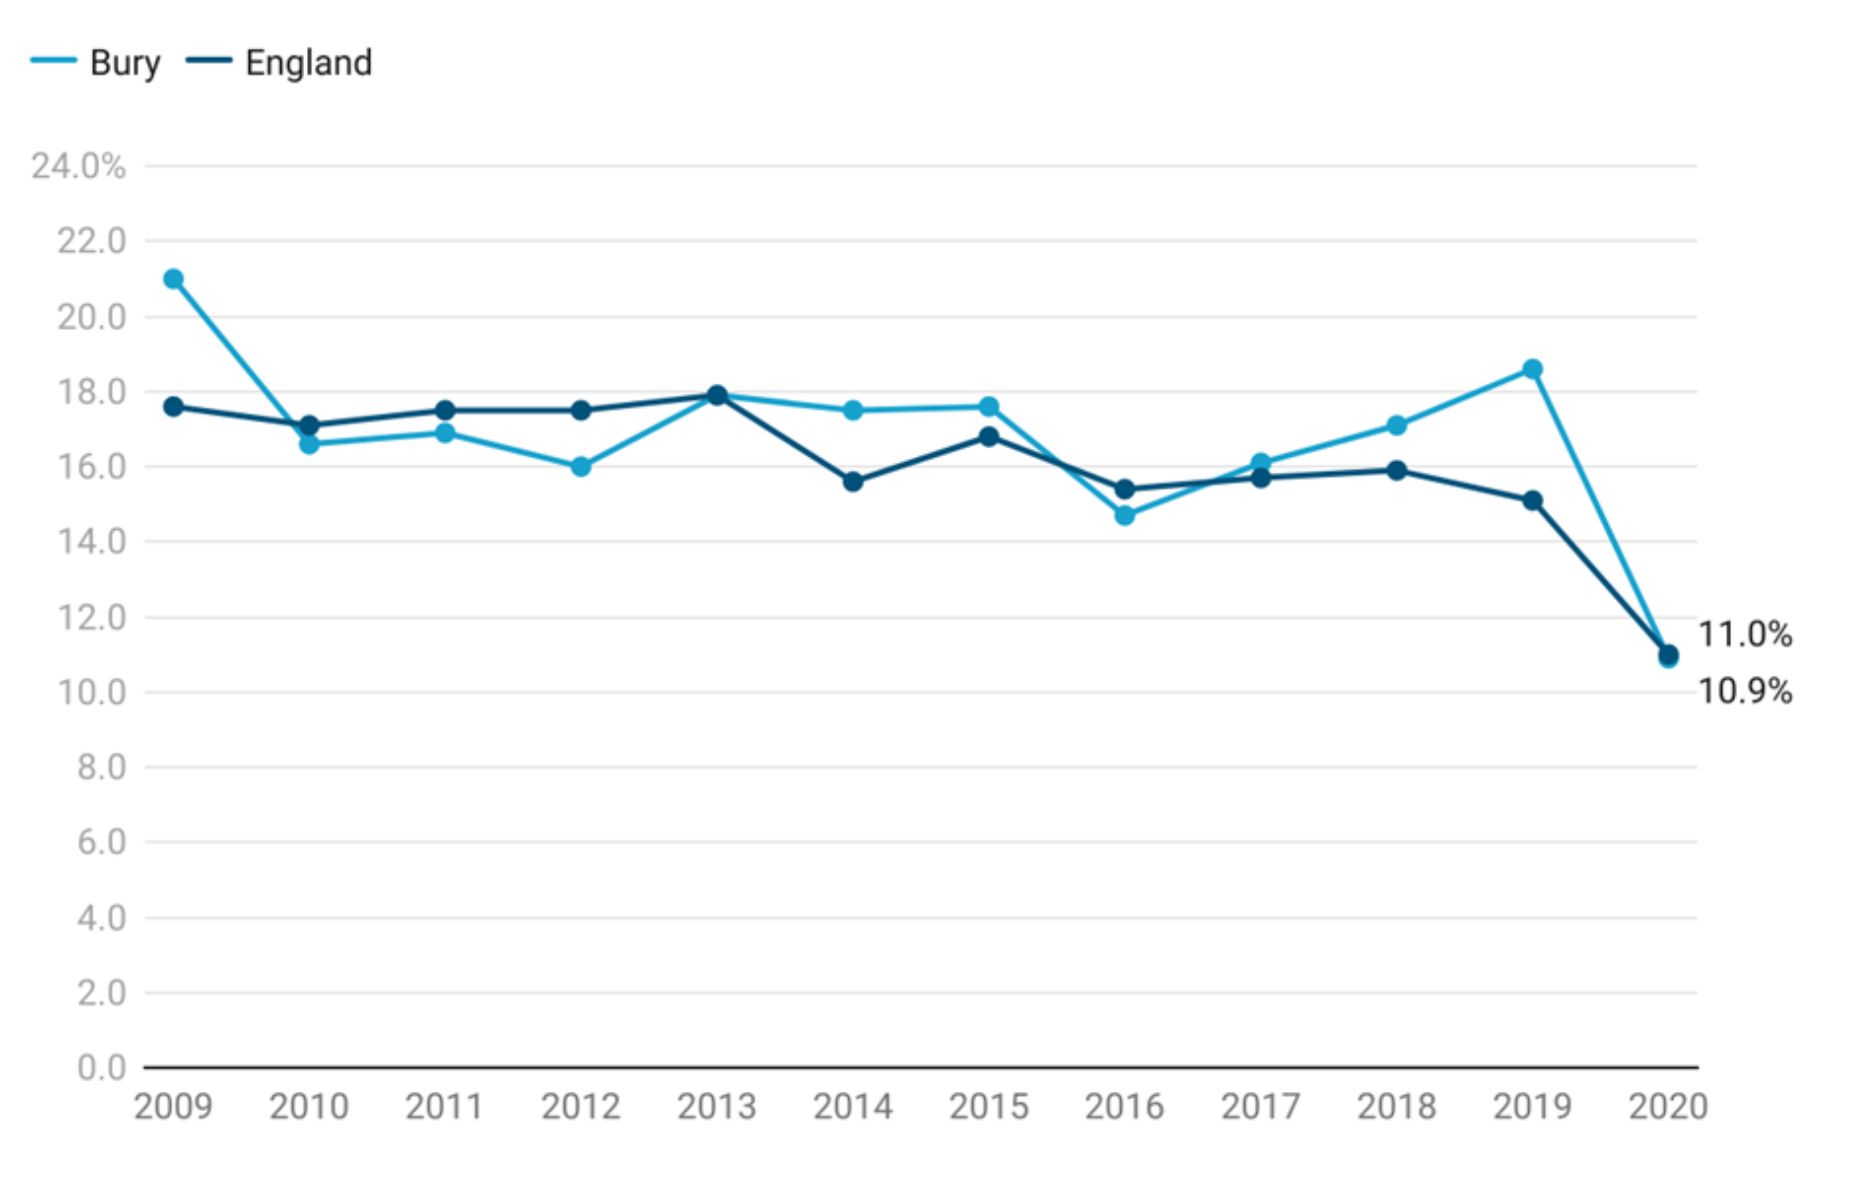
Respiratory diseases contribute to 10.9% of all deaths in individuals aged 85 years and over in Bury, statistically similar to England’s average of 11% (Productive Healthy Ageing Profile, 2020). Based on the five most recent data points, there is no discernible trend in Bury. Examining data from 2009-2020, deaths (%) from respiratory diseases in individuals aged 85 years and over have ranged from the lowest at 10.9% in 2020 to the highest at 21% in 2009.
Percentage of deaths from respiratory diseases as the underlying cause in this age group in Bury declined from 21% in 2009 to 16% in 2012. The proportion of deaths then increased sharply to 17.9% in 2013, before gradually declining to 14.7% in 2016. This was followed by a period of consistent increase to 18.6% in 2019 and a sharp decline to 10.9%. England saw a gradual decline in percentage of respiratory disease deaths in those aged 85 years and over from 17.6% in 2009 to 11% in 2020. The percentage fell to 13.8% in 2020 (Figure 13).
The percentage of deaths from respiratory diseases were generally similar to England average with the exception of the years 2009 and 2019, where they were higher (statistically significant) than England average.
Figure 21: Percentage of deaths in 85 years and over with respiratory diseases as the underlying cause in Bury compared with England - 2009-2020
Bury has the 5th lowest percentage of deaths with respiratory diseases as the underlying cause of deaths in its group of similar local authorities, with the highest proportion of deaths in St. Helens at 13.2% and lowest in Bedford at 9.1%
Data on inequalities in Bury are only available by age and have been described in the 65-74 years age group sub section earlier.
Dementia
Dementia is a syndrome (a group of related symptoms) associated with an ongoing decline of brain functioning. Research shows there are more than 850,000 people in the UK who have dementia. One in 14 people over the age of 65 have dementia, and the condition affects 1 in 6 people over 80. The number of people with dementia is increasing because people are living longer. It is estimated that by 2025, the number of people with dementia in the UK will be more than 1 million. Dementia is one of the leading causes of dependency and disability in older people around the world leading to increased cost in provision of health and social care services (approximately £35 billion). Dementia patients face significant health challenges and may have a mortality risk that is at least twice as high as those without the disease (Lancet, 2021).
Dementia is the leading cause of death for women. For men, the leading cause of death is ischaemic heart disease. Nearly double the number of women (42,000) than men (23,000) in the UK died of dementia in 2022.
Direct standardised rate of mortality: People with dementia (aged 65 years and over)
Mortality rate of people with dementia aged 65 years and over is measured as directly age standardised rate of mortality in persons (aged 65+) with a recorded mention of dementia or Alzheimer's per 100,000 population.
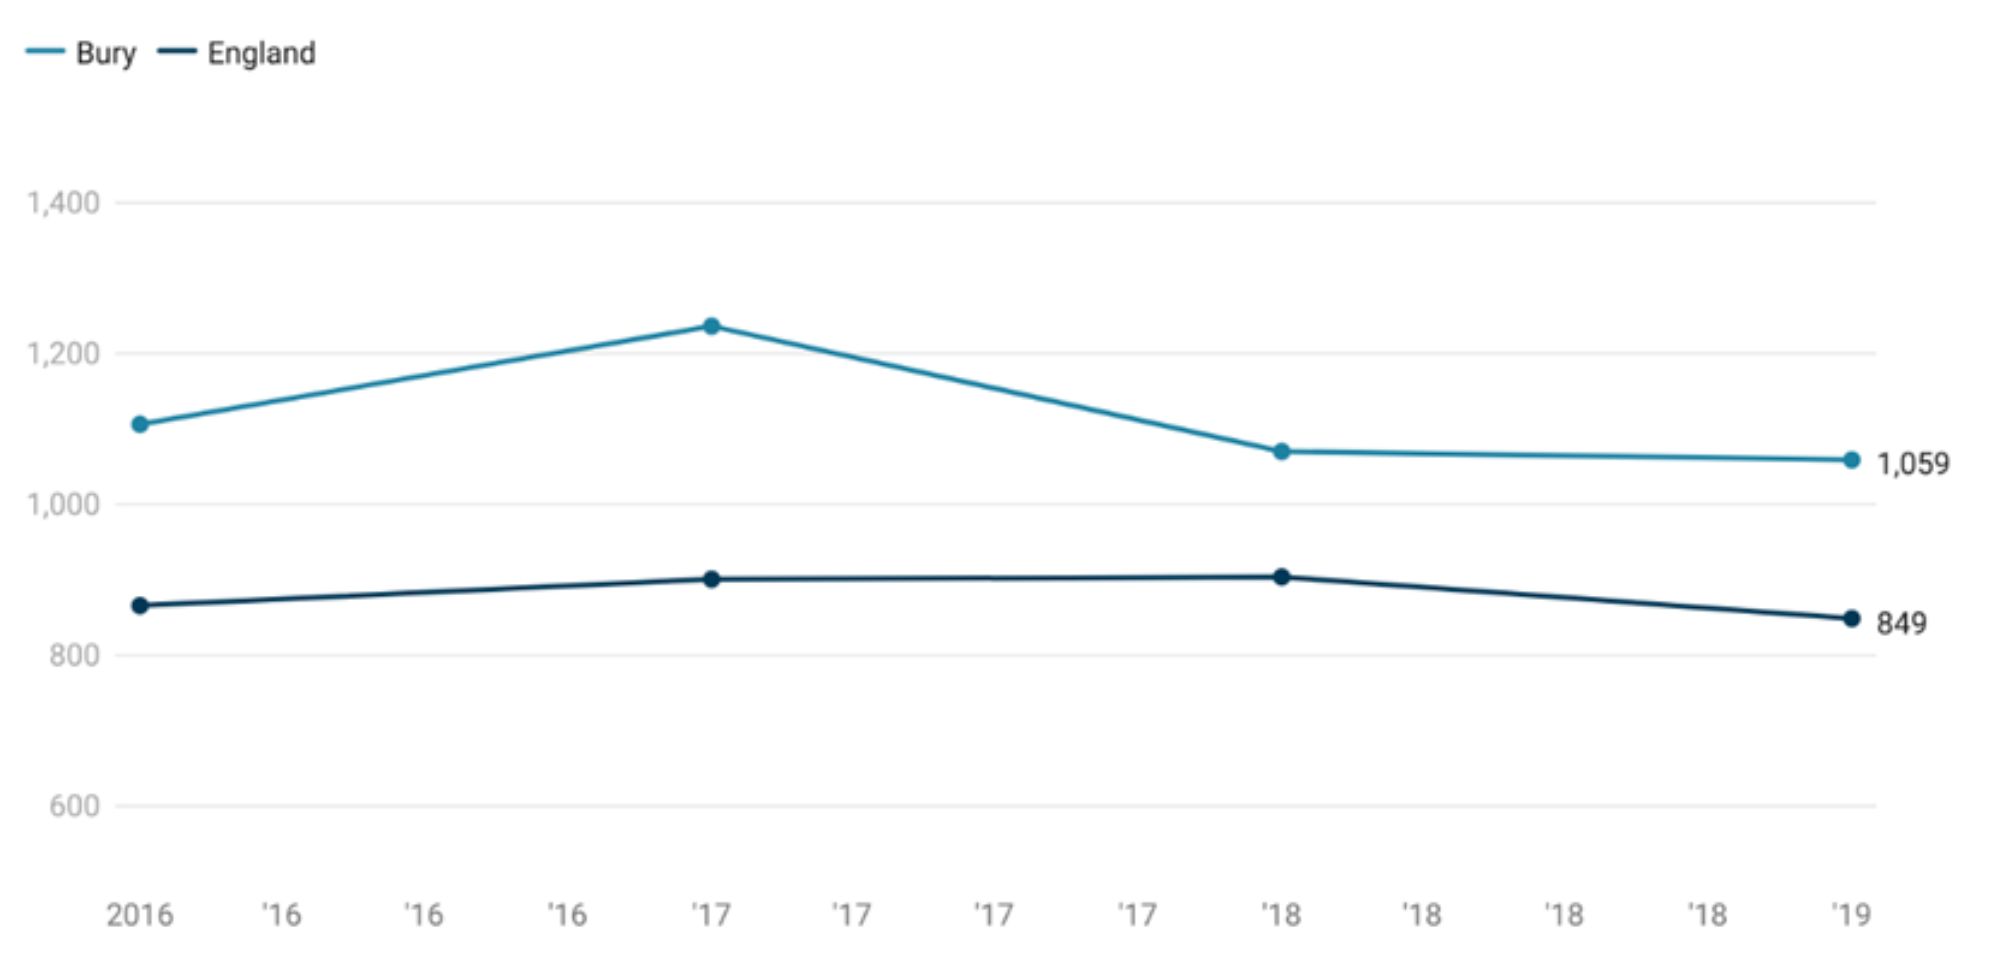
The mortality rate from dementia in Bury based on the most recent data in 2019 is 1,059 per 100,000, higher (statistically significant) than England average of 849 per 100,000 (Productive Healthy Ageing Profile, 2019).
Mortality rate in Bury increased from 1,106 per 100,000 in 2016 to 1,236 per 100,000 in 2017. However, in 2018, the mortality rate decreased to 1,070, and this trend continued in 2019 with a slight decrease to 1,059. Recent trend for Bury could not be calculated due to limited data points. Data for England suggests a slight increase from 866 in 2016 to 904 in 2018, followed by a slight decline to 849 in 2019. The mortality rate in Bury has remained higher (statistically significant) than England average throughout the years from 2016 to 2019 (Figure 22).
Figure 22: Directly age standardised rate of mortality in persons (aged 65+) with a recorded mention of dementia or Alzheimer's per 100,000 population in Bury compared with England from 2016-2019
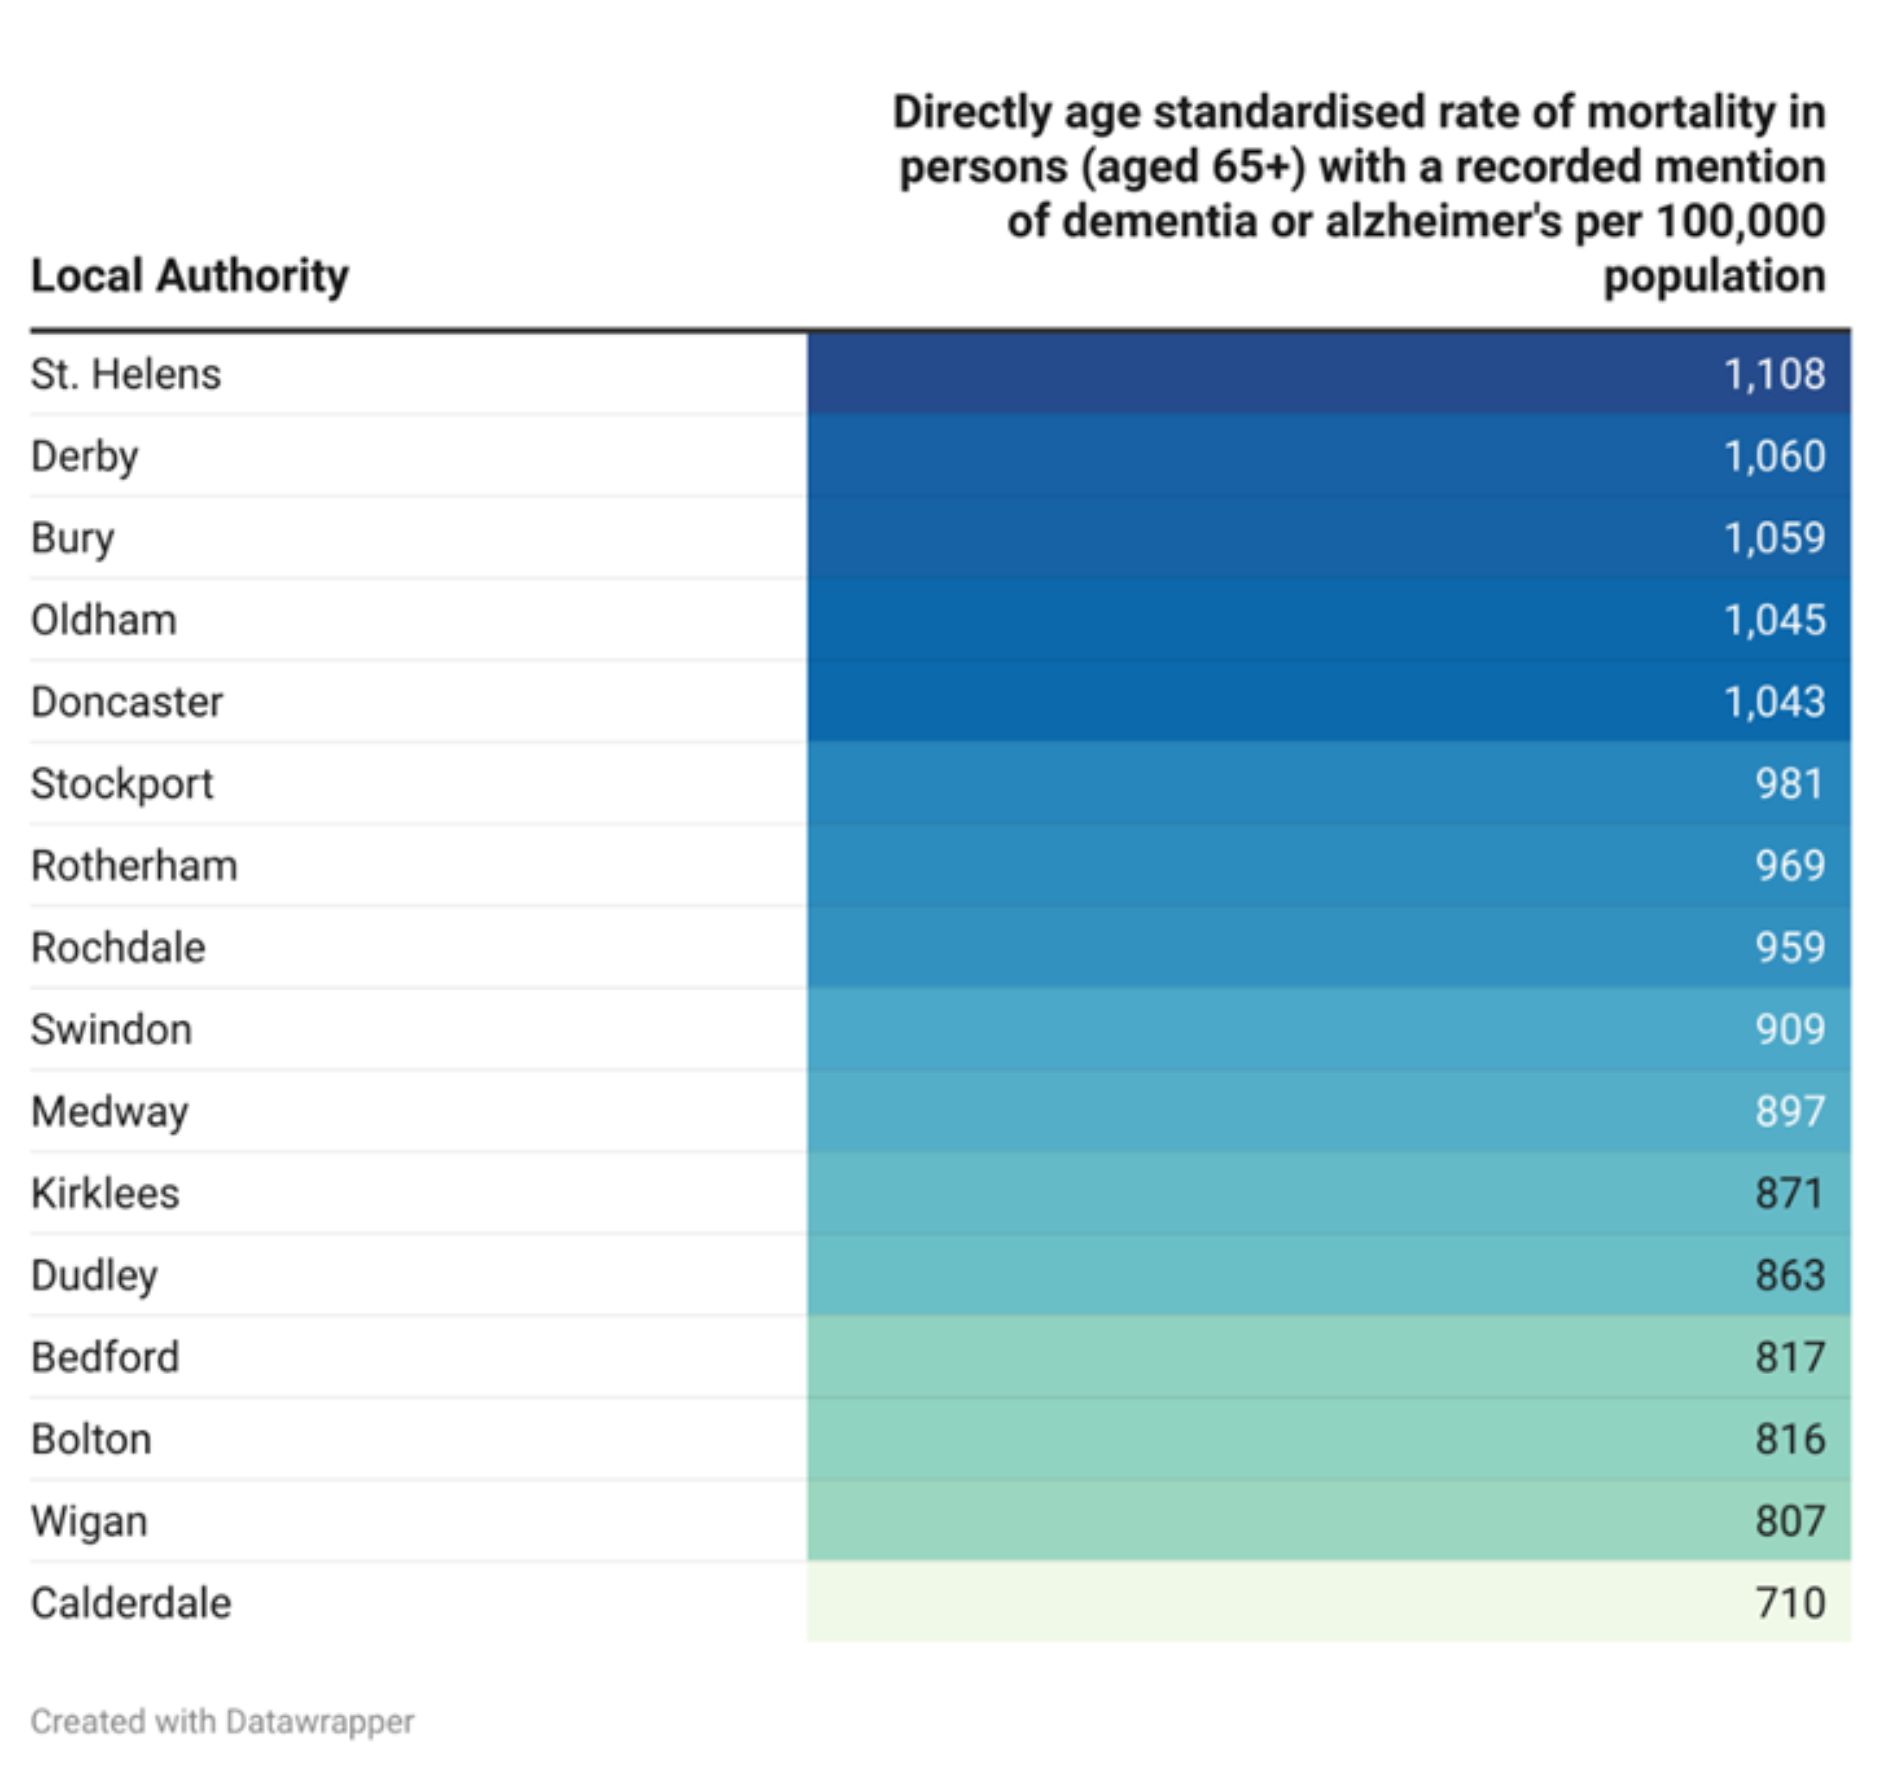
Bury has 3rd highest mortality rate from dementia in its group of statistical neighbours with the highest mortality in St. Helens of 1,108 per 100,000 and lowest mortality in Calderdale of 710 per 100,000 (Figure 23). It is worth noting that this could be due to better diagnosis of dementia rather than or as well as higher rates of death from dementia in Bury.
Figure 23: Directly age standardised rate of mortality in persons (aged 65+) with a recorded mention of dementia or Alzheimer's per 100,000 population for Bury and its statistical neighbours
There are no data on inequalities for Bury and England.
Winter mortality index (age 85 plus)
The purpose of the winter mortality measure is to compare the number of deaths that occurred in the winter period (December to March) with the average of the non-winter periods (August to November and April to July). Winter mortality is not solely a reflection of temperature, but of other factors as well. These include respiratory diseases and pressure on services, which have been more intense than usual during and following the height of the pandemic (ONS, 2023)
It is an important measure as it allows local stakeholders to assess whether policies are having an impact on mortality risks during the winter period. The majority of winter deaths occur amongst the older population (ONS, 2023).
The winter mortality index (WMI) is a measure expressed as a ratio of the difference in all cause mortality in those aged 85 and over during winter months (December to March) compared to the average in those aged 85 and over in the non-winter months (the preceding August to November and following April to July).
Winter mortality index in Bury demonstrates a mixed pattern of increases, decreases, and variations. In the most recent year, from August 2019 to July 2020, the WMI in Bury had a negative value of -9.80%, better (statistically significant) than England average of 6.8%. The negative value for Bury indicates a lower mortality rate during winter months (December to March) compared to the average mortality rate in the non-winter months (August to November and April to July) among individuals aged 85 and over (Productive Healthy Ageing Profile, 2020)
Examining trends in Bury, WMI fluctuated over the period Aug 2001 - Jul 2002 to Aug 2019 - Jul 2020. The WMI ranged from a high of 60.50% in August 2008 - July 2009 to a low of -6.60% in August 2011 - July 2012. From August 2001 to July 2009, the WMI generally increased, reaching its highest point at 60.50% in August 2008 - July 2009. Afterwards, from August 2009 to July 2012, the WMI experienced a mixed pattern, with both positive and negative values. Notably, in August 2011 - July 2012, the WMI was -6.60%, indicating a lower mortality rate during winter compared to non-winter months. From August 2012 to July 2019, the WMI showed further fluctuations, with varying differences in mortality rates between winter and non-winter periods.
The trend of the WMI in England also demonstrates fluctuations over the years. From August 2001 to July 2009, the WMI in England showed a mix of increases and decreases, ranging from 19.30% in August 2003 - July 2004 to a peak of 33.80% in August 2008 - July 2009. This indicates varying differences in mortality rates between winter and non-winter months during that period. Following this, from August 2009 to July 2014, the WMI generally remained lower, with values ranging from 15.80% in August 2013 - July 2014 to 28.20% in August 2012 - July 2013. From August 2014 to July 2018, the WMI experienced another mix of increases and decreases, reaching its highest point at 41.10% in August 2017 - July 2018, and its lowest point at 6.80% in August 2019 - July 2020.
WMI in Bury was fairly similar to England average for most years, with the exception of Aug 2008 - July 2009, where the proportion was statistically higher than England average and August 2011 - July 2012 and August 2019 - July 2020 where the proportions were lower than England average.
Figure 23: Winter Mortality Index (WMI) for 85 years and older adults in Bury compared with England from 2001-2020
-for-85-years-and-older-adults-.jpg)
Bury has the lowest WMI in its group of similar local authorities, with the highest in Rochdale at 13.8% (Productive Healthy Ageing Profile, 2020). Examining inequalities in Bury, Males have a slightly higher WMI (-6.6) compared with females (-11.6%), although the differences compared with Bury average are not statistically significant.
Similarly, Males in England have a slightly higher WMI at 7.4% compared with females at 6.3% but the differences are not statistically significant. Data on inequalities by deprivation are only available by England that suggests no social gradient.
However, individuals aged 85 years or over in the fourth most deprived decile have statistically higher WMI (10%) and those in second most deprived (2.5%) and second least deprived (3.4%) have statistically lower WMI compared with the average for England.
Well-being and Wider determinants of health
For older adults, wider social determinants of health such as access to housing, food, financial resources, climate change and transportation, as well as social connections, play a critical role not only in better health outcomes, but also in improving overall well-being.
Older people in poverty: Income deprivation affecting older people Index (IDAOPI)
The Income Deprivation Affecting Older People Index (IDAOPI) measures the proportion of all those aged 60 or over who experience income deprivation. It is a subset of the Income Deprivation Domain which measures the proportion of the population in an area experiencing deprivation relating to low income. The definition of low income used includes both those people that are out-of-work, and those that are in work but who have low earnings (and who satisfy the respective means tests).
Although there are no national targets the Government aims to tackle poverty and promote greater independence and well-being in later life. People living in more deprived areas have a greater need for health services.
Income Deprivation Affecting Older People Index (IDAOPI) in Bury for the year 2019 is 14.5%, statistically higher than England average of 14.2% (Productive Healthy Ageing Profile, 2019). There are no trend data available for Bury and England.
Bury has the 11th highest IDAOPI in its group of similar 16 local authorities (Figure 24), with the highest proportion in Rochdale at 20.3% and lowest in Bedford at 11.5% (Productive Healthy Ageing Profile, 2019).
Figure 24: Income deprivation affecting older people Index (IDAOPI) (60 years and over) for Bury and its statistical neighbours
-.jpg)
Homelessness - households owed a duty under the Homelessness Reduction Act (main applicant 55+ yrs)
Homelessness is associated with severe poverty and is a social determinant of health. It can often result from a combination of events such as debt, relationship breakdown, adverse experiences in childhood and through ill health. In recent years there has been a significant increase in homelessness experienced by older people. Households are increasingly living in the growing private rented sector, and loss of assured shorthold tenancy is the main cause of statutory homelessness. Many older households also live in poverty.
Homelessness is associated with poor health, and existing health conditions are exacerbated by homelessness. For example, older people experiencing homelessness are more likely to suffer from depression and dementia. (LGA, 2017)
The Homelessness Reduction Act (HRA) introduced new homelessness duties which meant significantly more households are being provided with a statutory service by local housing authorities than before the Act came into force in April 2018. The HRA introduced new prevention and relief duties, that are owed to all eligible households who are homeless or threatened with becoming homeless, including those single adult households who do not have ‘priority need’ under the legislation.
This indicator is defined as households owed a prevention or relief duty under the Homelessness Reduction Act, where the main applicant is aged 55 years and over, crude rate per 1,000 estimated households where the household reference person is aged 55 years and over.
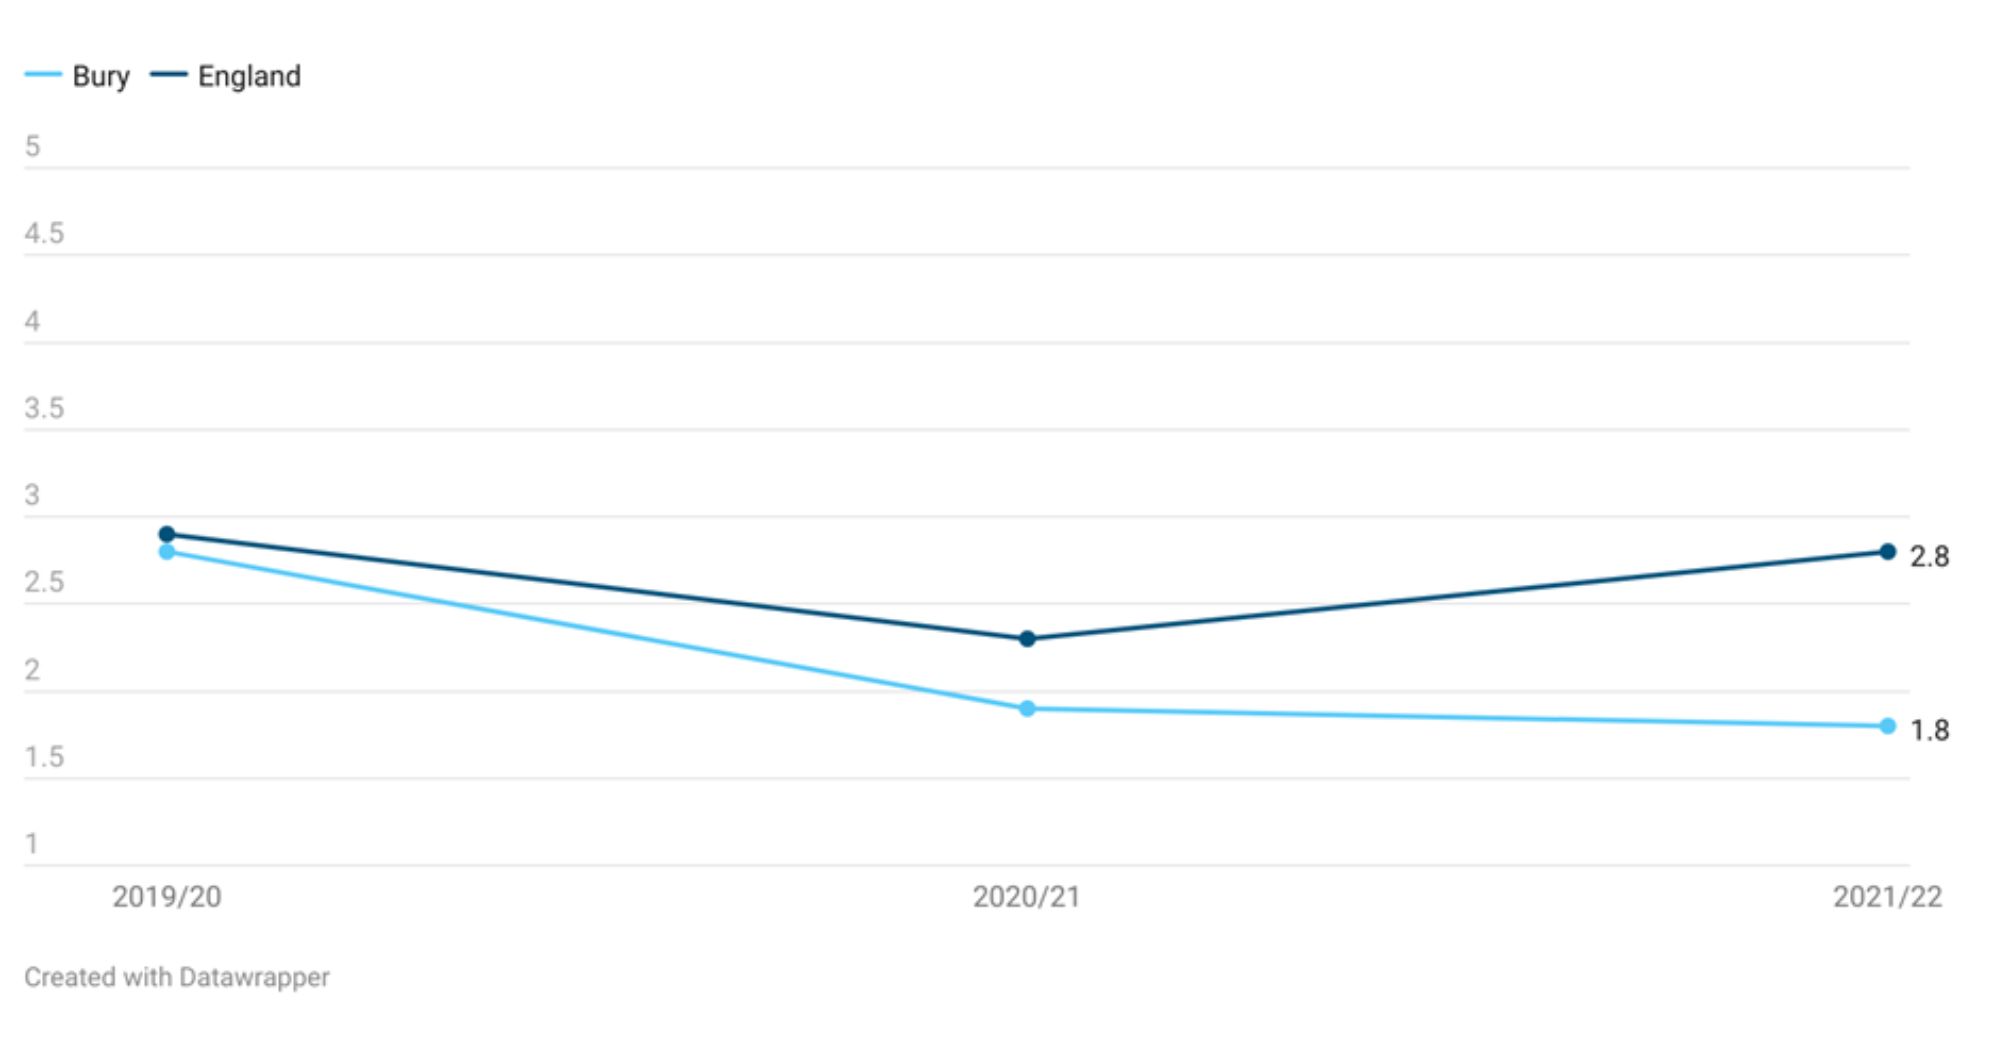
The crude rate for households owed a duty under the Homelessness Reduction Act (main applicant 55+ yrs) in Bury for the year 2021/22 was 1.8 per 1,000 households, statistically better than England average of 2.8 per 1,000 households.
Data for Bury from the period 2019/20 to 2021/22 suggests that the rate in Bury has declined over time with 2.8 per 1,000 households owed a duty under the HRA in 2019/20, reducing to 1.9 in 2020/21 and 1.8 in 2021/22. England rates are fairly stable with 2.9 per 1,000 households owed a duty under HRA in 2019/20, declining slightly to 2.3 in 2020/21 before increasing to 2.8 in 2021/22 (Productive Healthy Ageing Profile, 2022). Recent trend for Bury could not be calculated.
Figure 25: Crude rate per 1,000 households owed a duty under the Homelessness Reduction Act (main applicant 55+ yrs) in Bury compared with England from 2019/20-2021/22
Bury has the 5th lowest crude rate per 1,000 households owed a duty under the Homelessness Reduction Act (main applicant 55+ yrs) in its group of similar 16 local authorities (Figure 24), with the highest proportion in Medway at 3.8 and lowest in St. Helens at 1.5 (Productive Healthy Ageing Profile, 2022).
There are no data on inequalities for Bury. Data for England are available by deprivation only with higher rates than England average in the top 5 most deprived deciles (highest in 4th more deprived decile at 4.3) and lower than England average rates in the 5 least deprived deciles (lowest in the least deprived decile at 2).
Winter fuel payments
Winter Fuel Payments were introduced in 1997 to help older people meet the costs of heating their homes in winter. They are paid in a lump sum each winter. People will usually receive the Winter Fuel Payment automatically if they meet certain eligibility criteria and receive the State Pension or another social security benefit. If eligible, people should receive a letter in October or November of the year. People who didn't receive a letter, but think they are eligible, can also make a claim for the payment.
The Winter Fuel Payment count can be used as a proxy measure for the proportion of individuals of pensionable age living in private households. However, particularly low values for this indicator will highlight areas with high levels of migration/transient populations and/or possible problems with the payment system (though noting that the proportion of residents in care homes/long-term NHS settings will also affect the measure). The indicator can also be used for impact assessment of changes to or maintenance of winter fuel payments policy.
Winter fuel payments are measured as the percentage of people aged 66+ receiving winter fuel payments.
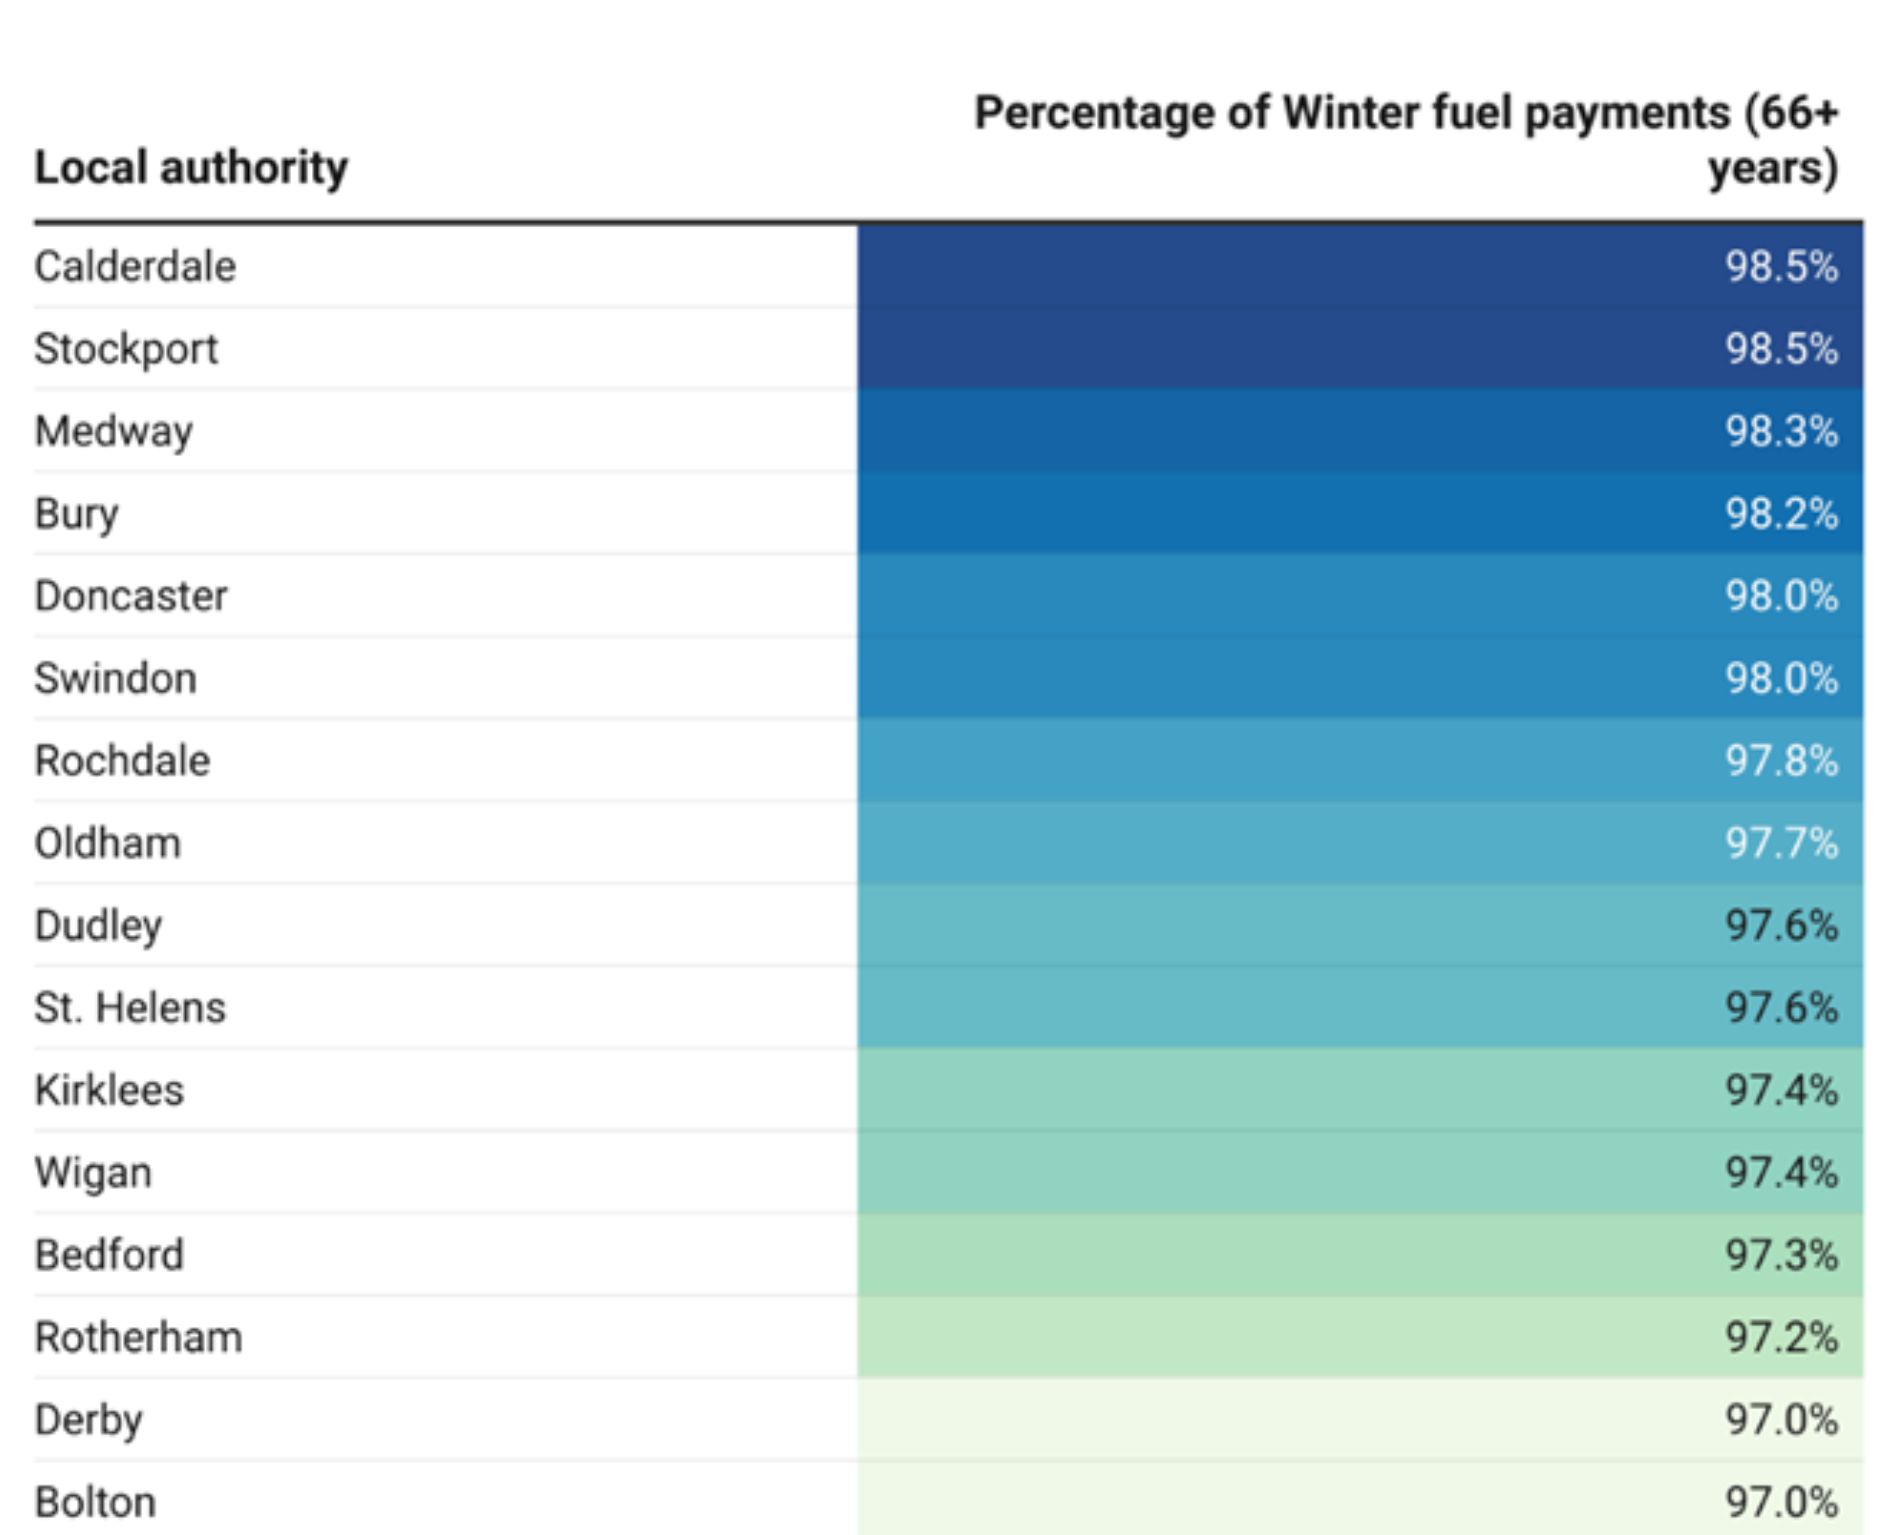
Winter fuel payment (%) in Bury for the year 2021/22 was at 98.2%, statistically higher than England average of 97.4% (Productive Healthy Ageing Profile, 2022). There are no trend data available for Bury and England.
Bury has the 4th highest winter fuel payments (%) in its group of 16 statistically similar local authorities, with the higher proportion in Calderdale and Stockport (both at 98.5%) and lowest in Bolton at 97% (Productive Healthy Ageing Profile, 2022).
Figure 26: Percentage of people aged 66+ receiving winter fuel payments for Bury and its statistical neighbours
There are no inequalities data available for Bury but England data suggests a slight deprivation gradient with the lowest proportion of payments in the most deprived decile (96.8%) and highest in the top four least deprived deciles (all at 97.6%).
Older people living alone (65 years and over)
Social isolation, loneliness and higher levels of deprivation are all linked with pensioners who live alone. There is a clear link between loneliness and poor mental and physical health. Although the links between isolation and loneliness are complex, for older people there is a strong correlation between isolation and loneliness. A key element of the Government's vision for social care, set out in the Care and Support White Paper, is to tackle loneliness and social isolation, supporting people to remain connected to their communities and to develop and maintain connections to friends and family. The White Paper sets out steps to support these aims, and makes a commitment to develop, with local government, suitable measures of loneliness and isolation for inclusion in the Adult Social Care Outcomes Framework (ASCOF) and the Public Health Outcomes Framework (PHOF).
This indicator is defined as the number of over 65 year olds living alone as a percentage of the total number of over 65 year old respondents to the census question. Data are not available on Fingertips and have been sourced from NOMIS.
According to the 2021 census data, the percentage of older individuals living alone in Bury has decreased to 30%, which is lower than the 32.7% reported in the 2011 census. Similar shift in the living arrangements of older individuals have been observed in England, with percentage of older people living alone decreasing from 31.5% in 2011 to 28.9% in 2021.
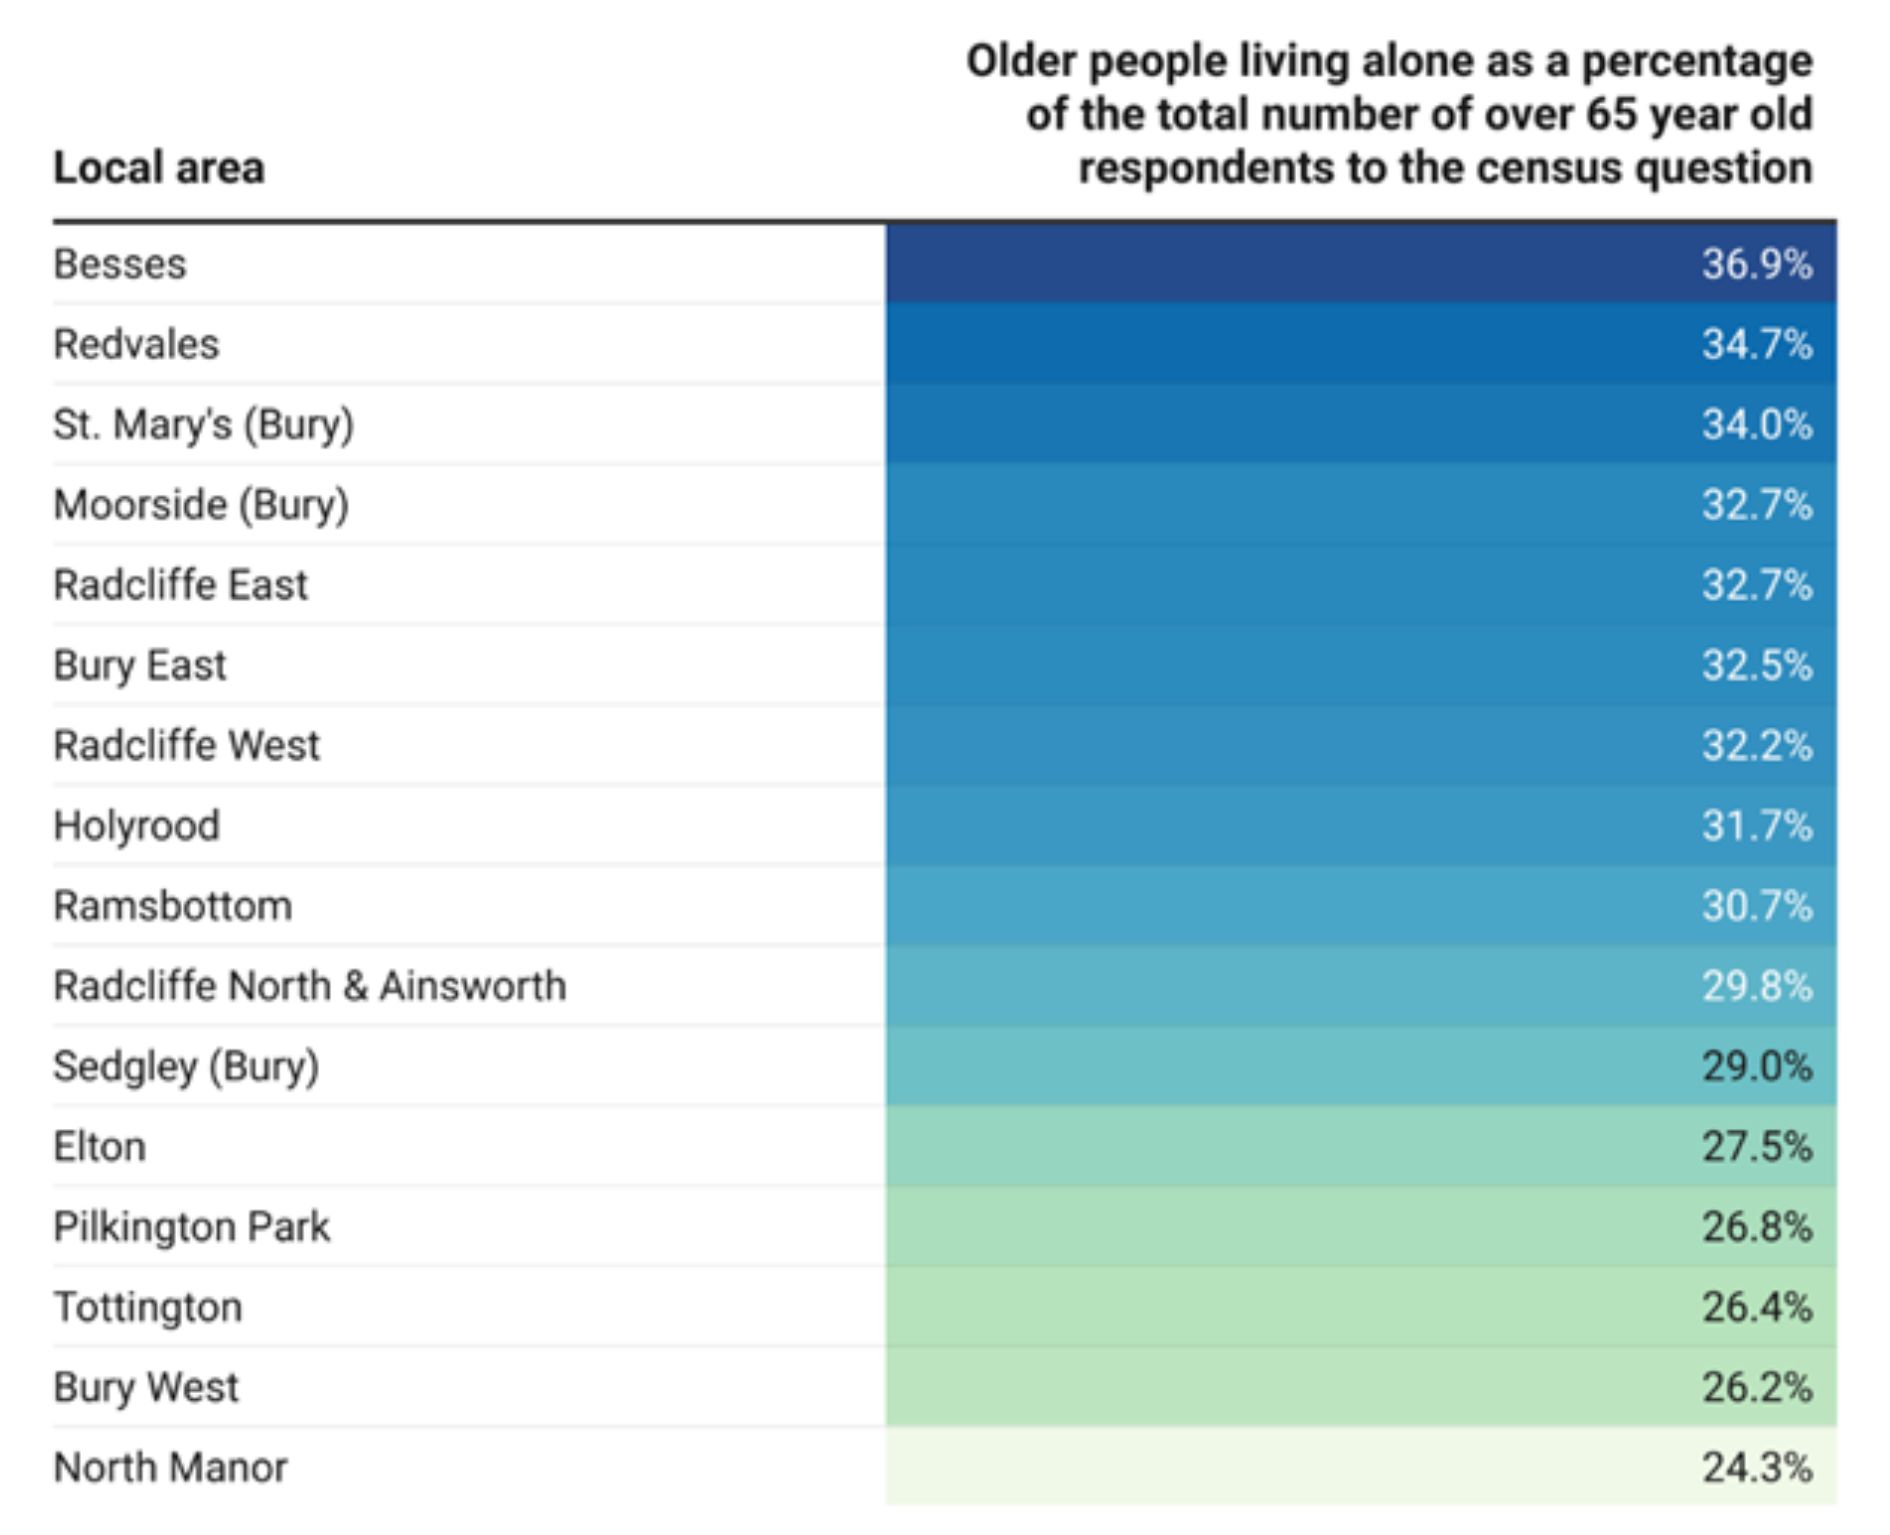
Ward level data are also available from Census 2021 for the percentage of older individuals living alone in Bury. The highest proportion of older people who live alone are in Besses (36.9%), Redvales (34.7%) and St. Mary’s (34%) and lowest proportion are in North Manor (24.3%).
Figure 27: Percentage of older people living alone as a percentage of the total number of over 65 year old respondents to the census question by Bury wards
Social isolation: percentage of adult carers who have as much social contact as they would like (65 plus years)
A strong correlation exists between loneliness and poor mental and physical health, particularly among older individuals. While the relationship between isolation and loneliness is intricate, it is evident that isolation is closely associated with feelings of loneliness in the elderly.
This indicator is measured as the percentage of respondents to the Personal Social Services Survey of Adult Carers in England who responded to the question "Thinking about how much contact you have had with people you like, which of the following best describes your social situation?" with the answer "I have as much social contact I want with people I like".
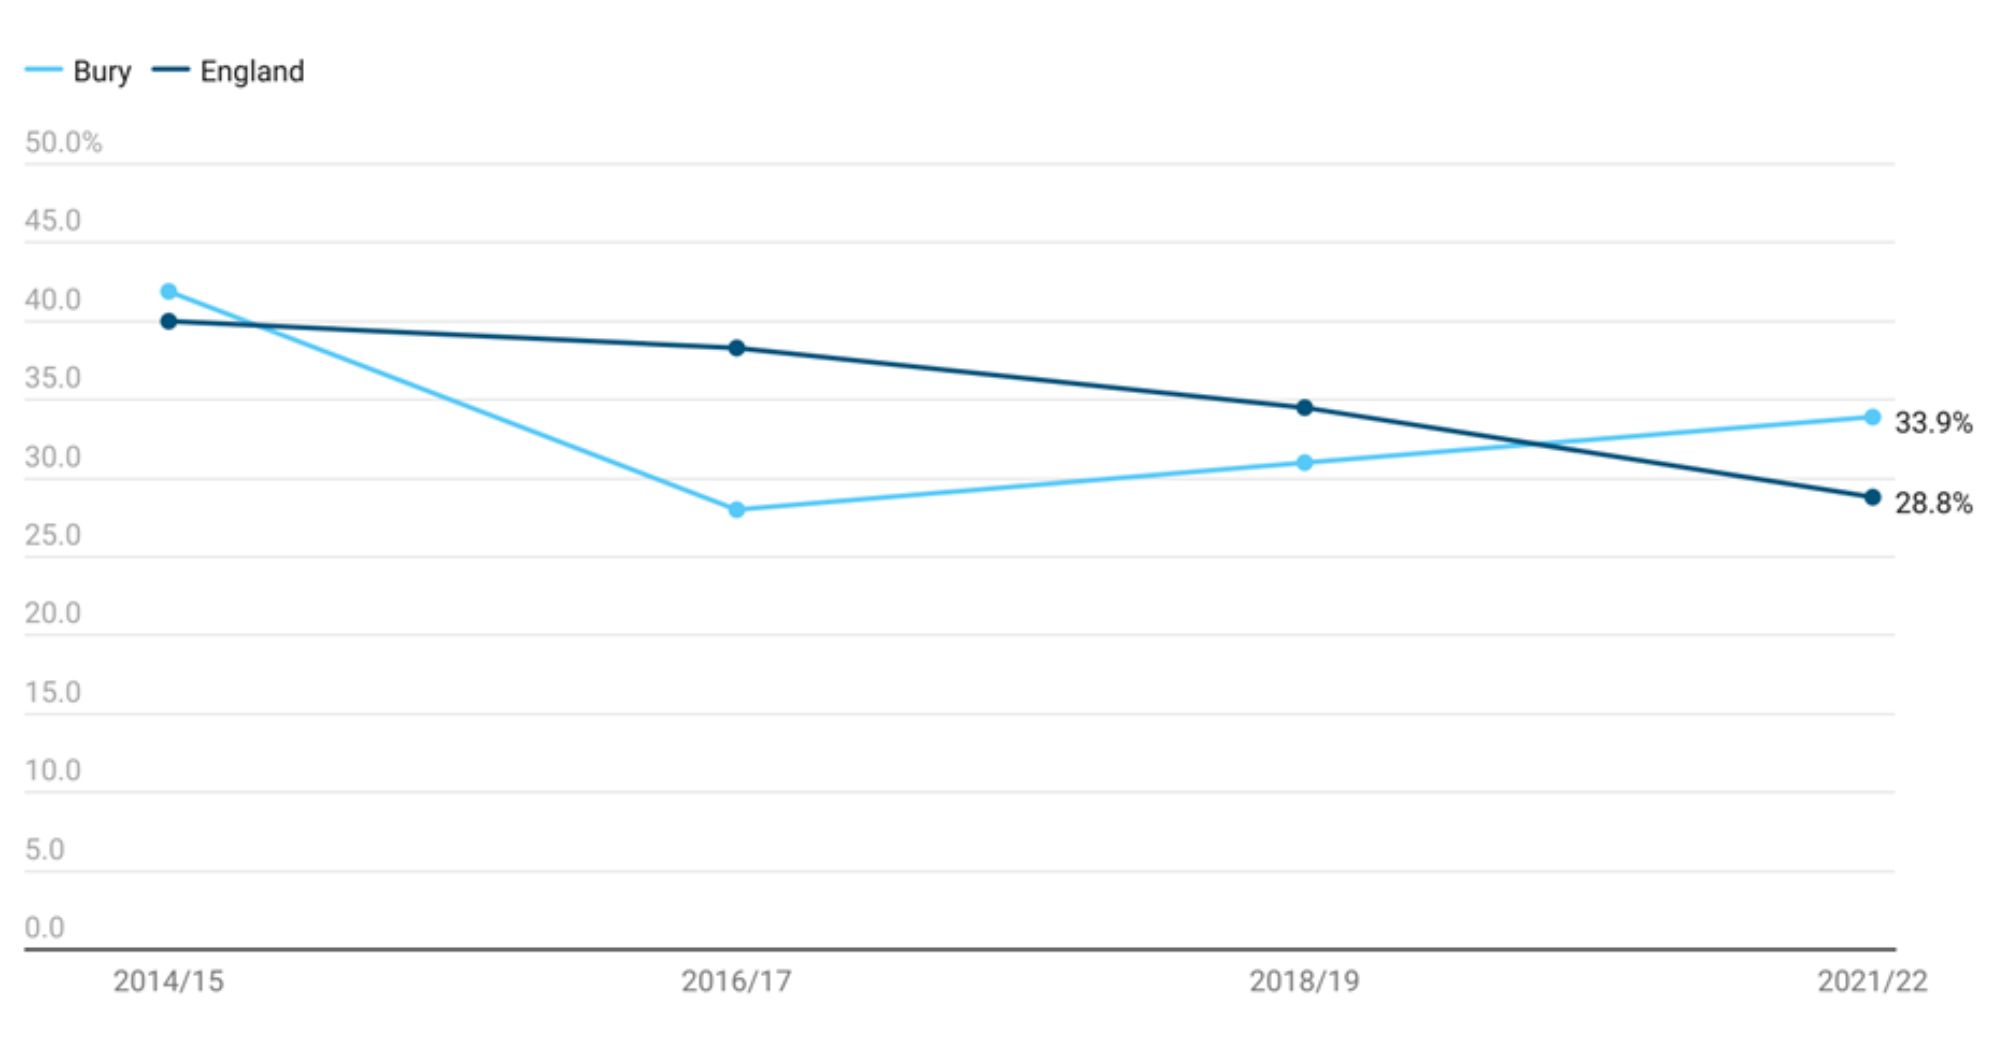
% of adult carers aged 65 years and over reported having as much social contact as they would like, lower but statistically similar to England average of 28.8% (Productive Healthy Ageing Profile, 2022).
Examining data from 2014/15 to 2021/22, the percentage of adult carers aged 65 years and over reporting having as much social contact as they would like declined sharply from 41.9% in 2014/15 to 28% in 2016/17. This was followed by a rise to 31% in 2018/19 and 33.9% in 2021/22. Data for England suggests that the percentage has steadily declined from 40% in 2014/15 to 28.8% in 2021/22.
Comparing Bury with England, apart from 2016/17 (where the percentage was statistically lower than England average), the proportion of adult carers aged 65 years and over reporting having as much social contact as they would like has been statistically similar.
Figure 28: Percentage of adult carers who have as much social contact as they would like (65 plus years) in Bury compared with England from 2014/15-2021/22
Bury ranks 4th highest in its group of 16 similar local authorities, with the highest proportion in Swindon at 43.7% and lowest in Wigan at 21.1%.
There are no data on inequalities available for Bury. Data for England by age suggests that the highest percentage of adult carers reporting having as much social contact as they would like in the 85+ years age group (32.6%), followed by 65-74 years (28.3%) and 75-84 years (28.2%). Examining data by deprivation for England, the highest proportion of adult carers aged 65 years and over reporting having as much social contact as they would like is in most deprived decile (32.4%) and lowest in the second least deprived decile (24.2%).
Long-term conditions
The most important economic, health, and social challenge we face today is the phenomenon of the ageing population. Moreover, the rise in chronic and degenerative diseases is one of the most significant epidemiologic trends of our time (Maresova et al, 2019). Ageing population tends to have a higher prevalence of chronic diseases that require a long period of treatment leading to increase in demand for healthcare services and changes its nature. This need for long-term care can also lead to a decline in the quality of life of older age individuals.
There are limited publicly available data on long-term conditions limited to this age group as most indicators cover wider age groups and have been described in the Living Well section. Available data specific to older adults are presented below.
Blind or partially sighted
Promoting the prevention of vision impairment is crucial for enabling individuals to maintain their independence and minimising their reliance on social care support in case of permanent sight loss. Research conducted by the Royal National Institute for Blind People (RNIB) indicates that timely detection and treatment could prevent approximately 50% of blindness and severe sight loss cases. The main causes of preventable sight loss are untreated cataracts and uncorrected refractive errors. However, the research suggests that there is a lower-than-expected uptake of sight tests, particularly in socially deprived areas. This low participation in sight tests often leads to delayed identification of treatable conditions and increased sight loss due to late intervention.
Preventable sight loss is widely recognised as a significant public health issue that can be addressed. The World Health Organization's global initiative for the elimination of avoidable blindness, "Vision 2020 The Right to Sight”, to which the UK is a signatory, emphasises the priority of preventing avoidable sight loss. This objective is also a key focus for Vision UK. Given the ageing population, this issue becomes even more critical.
According to the Law Commission report, it is recommended that local authorities maintain a register of individuals who are blind or partially sighted (Paragraphs 12.15 to 12.18). The Department of Health and Social Care Ministers have accepted this recommendation. The registration process with a local authority and access to services start with the completion of a Certificate of Visual Impairment (CVI) by a consultant ophthalmologist.
People aged 65-74 registered blind or partially sighted
This indicator is measured as a crude rate of the number of people aged 65-74 registered blind or partially sighted with local authorities in England as at the 31st March per 100,000 population aged 65 to 74 years.
The crude rate in Bury for the period 2019/20 was 364 per 100,000 population aged 65-74 years, significantly below England average of 536 per 100,000 population aged 65-74 years.
Four data points are available for Bury from 2010/11 to 2019/20. The rates in Bury declined from the highest rate of 930 per 100,000 in 2010/11, to 471 per 100,000 for both 2013/14 and 2016/17, before declining further to 364 per 100,000. No recent trend could be calculated for Bury. Data for England shows a gradual decline from 637 per 100,000 in 2010/11 to 569 per 100,000 in 2013/14, 555 per 100,000 in 2016/17 to the lowest rate of 536 in 2019/20.
Figure 29: Crude rate of the number of people aged 65-74 registered blind or partially sighted with local authorities in England as at the 31st March per 100,000 population aged 65 to 74 years in Bury compared with England from 2010/11-2019/20
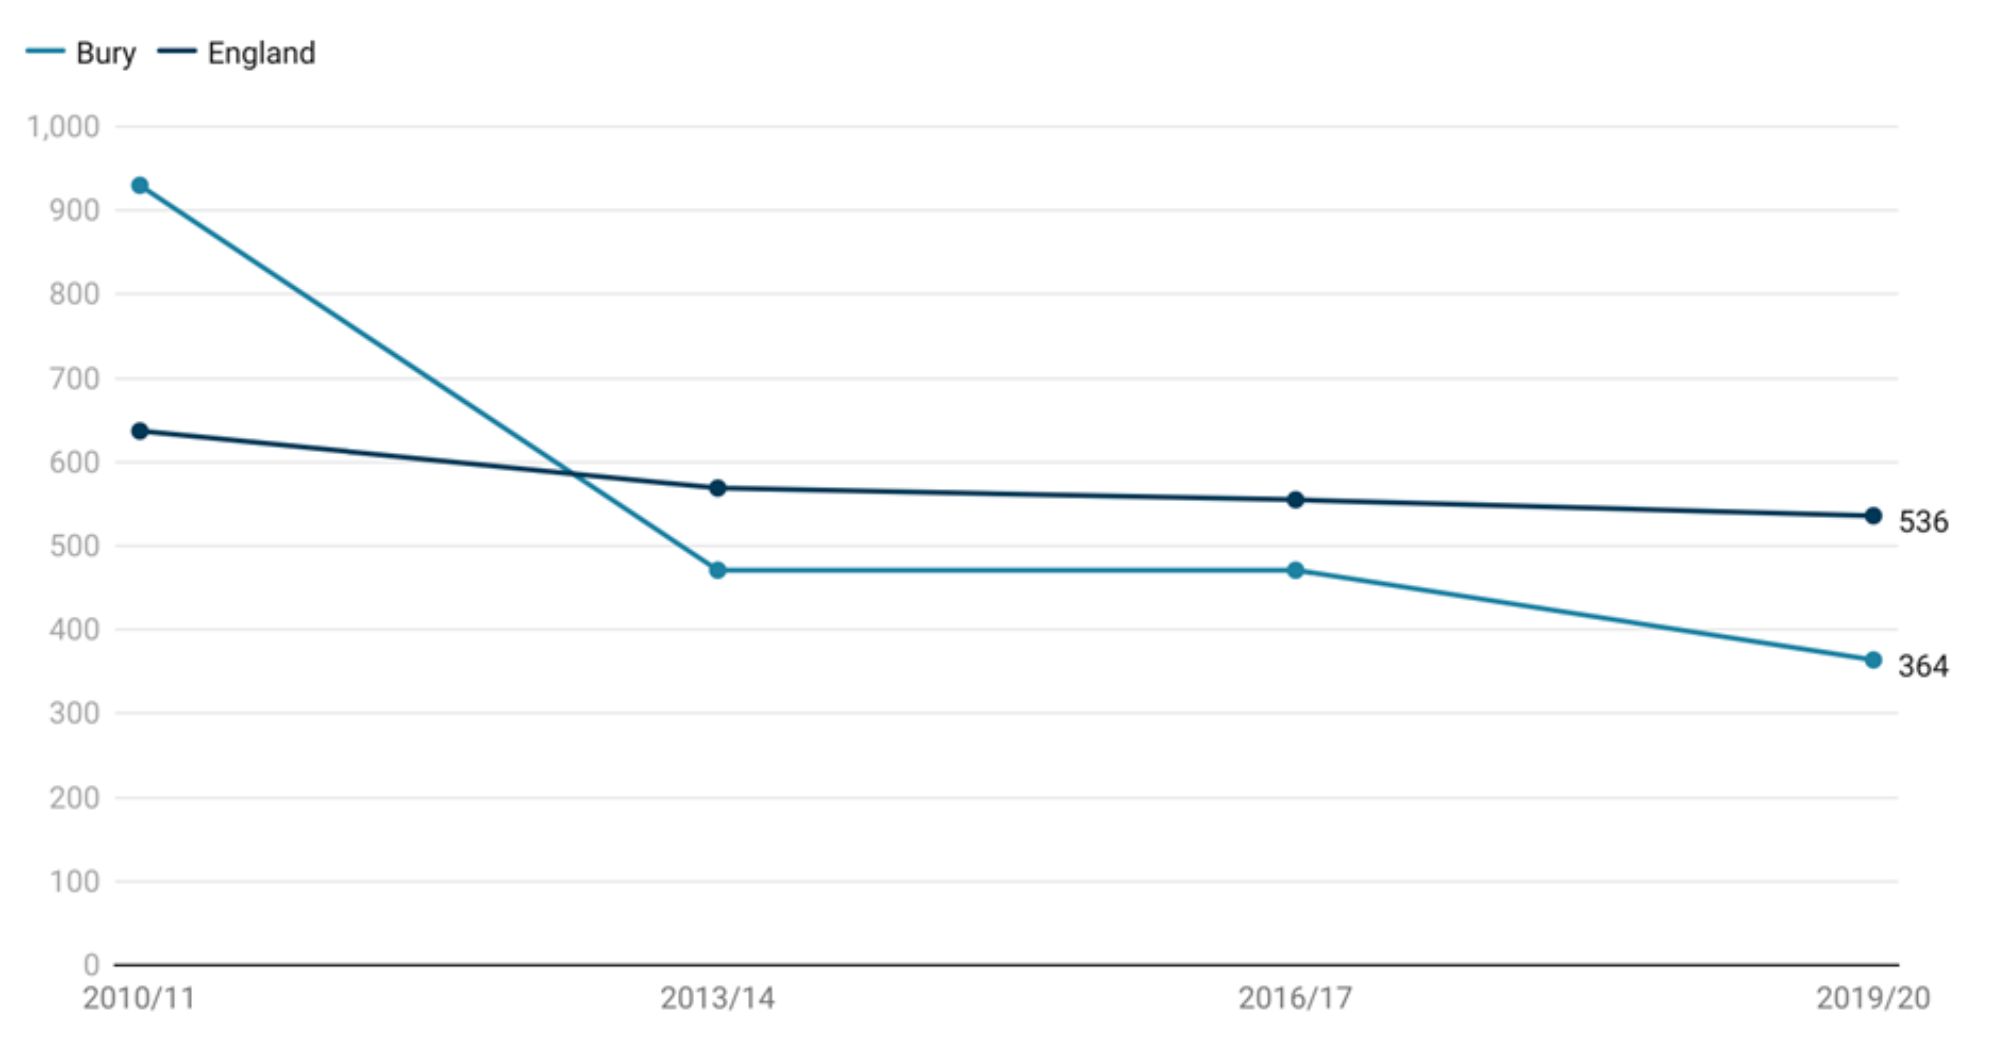
The crude rate in Bury for the period 2019/20 is the lowest in its group of similar local authorities with the highest rate in Rotherham (822 per 100,000).
There are no data on inequalities for Bury. England level data suggests a social gradient with the highest rate in most deprived decile at 790 per 100,000 population aged 65-74 years and the lowest rate in the least deprived decile at 371 per 100,000 population aged 65-74 years (Productive Healthy Ageing Profile, 2020).
People aged 75+ registered blind or partially sighted
This indicator is measured as a crude rate of the number of people aged 75+ years registered blind or partially sighted with local authorities in England as at the 31st March per 100,000 population aged 75 years and over.
The crude rate in Bury for the period 2019/20 was 2,409 per 100,000 population aged 65-74 years, significantly below England average of 3,429 per 100,000 population aged 65-74 years.
In Bury, there are four data points available spanning from 2010/11 to 2019/20 (Figure 30). The rates of registered blind or partially sighted individuals in Bury showed a decline over this period, starting from the highest rate of 5,942 per 100,000 in 2010/11. The rates then decreased to 4,416 per 100,000 in 2013/14 and further to 4,045 per 100,000 in 2016/17, before experiencing a sharp decline to 2,409 per 100,000. It is important to note that no recent trend could be calculated based on the available data for Bury.
For England as a whole, the data indicates a gradual decline in rates from 4,752 per 100,000 in 2010/11 to 4,255 per 100,000 in 2013/14. The rates continued to decrease to 3,961 per 100,000 in 2016/17 and reached the lowest rate of 3,429 per 100,000 in 2019/20.
Figure 30: Crude rate of the number of people aged 75+ years registered blind or partially sighted with local authorities in England as at the 31st March per 100,000 population aged 75 years and over in Bury compared with England from 2010/11-2019/20
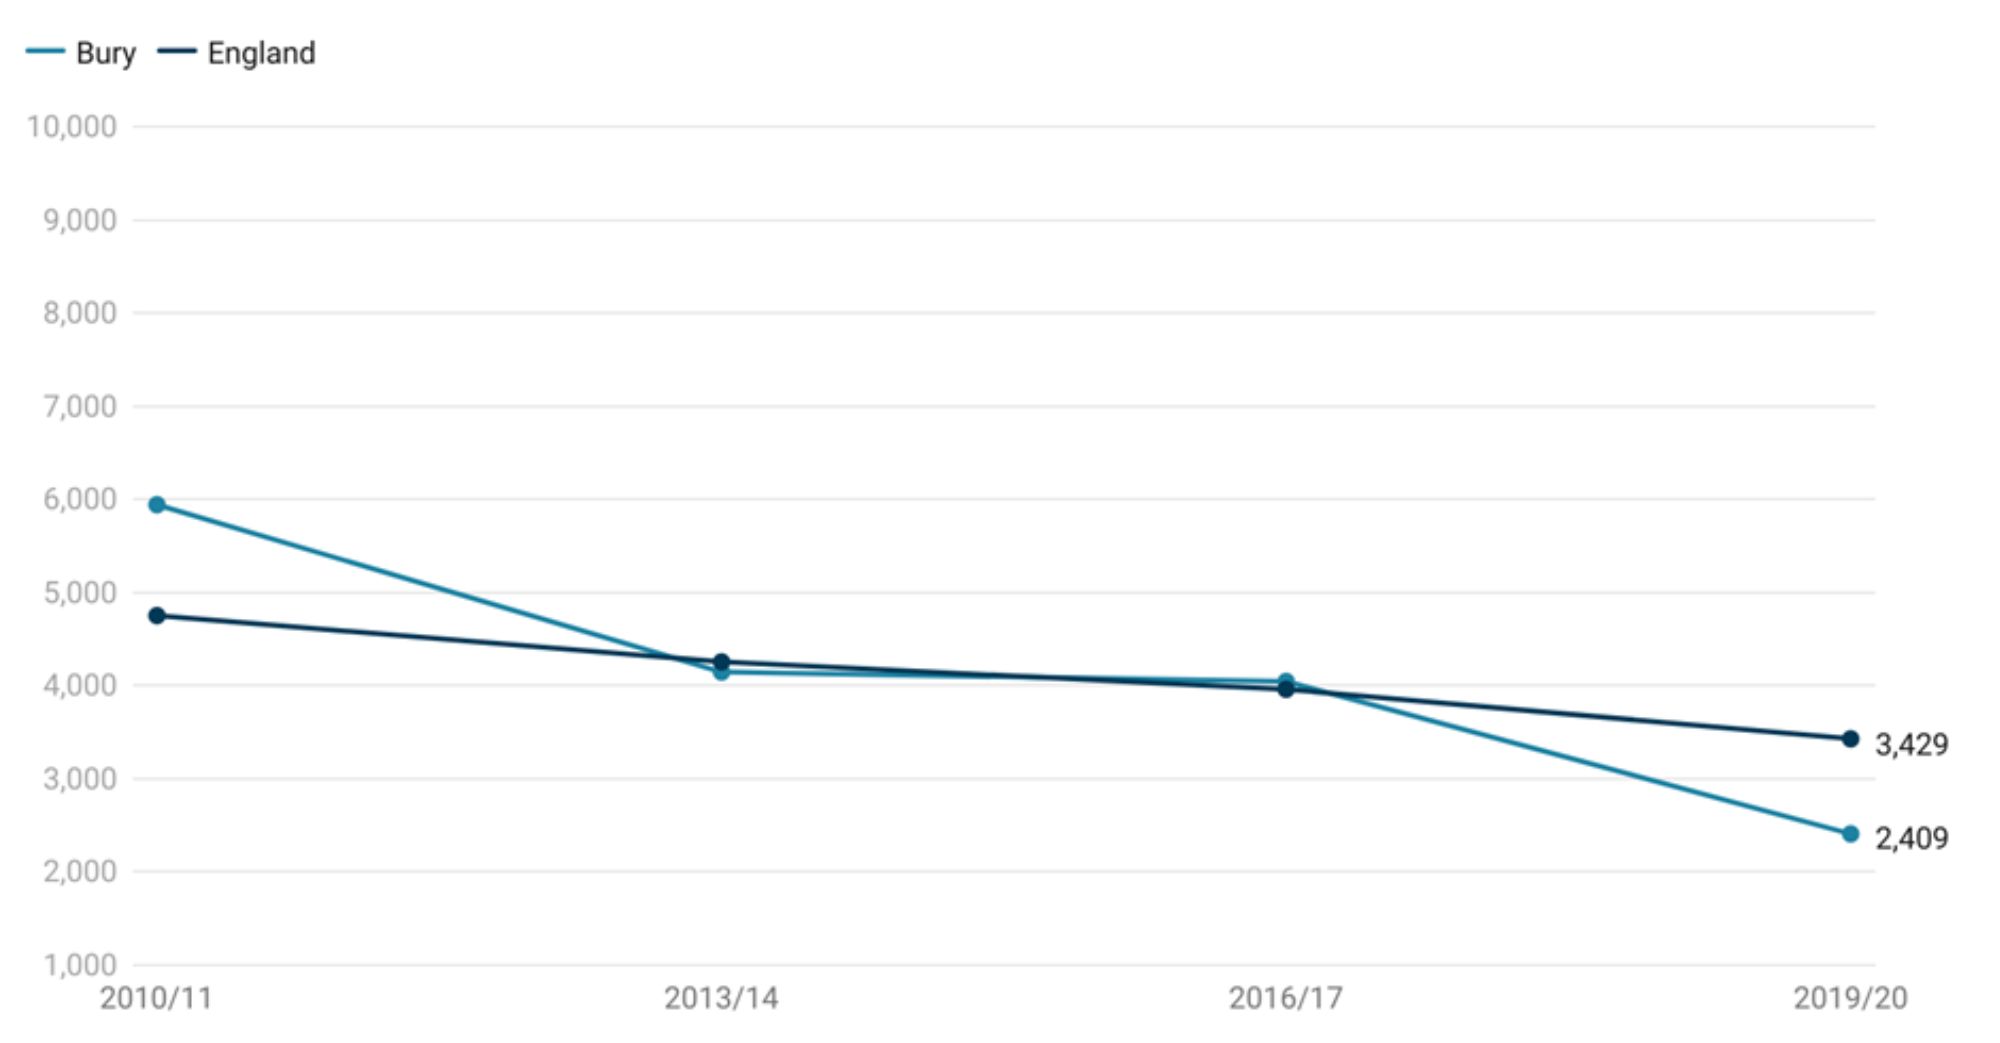
The crude rate in Bury for the period 2019/20 is the 4th lowest in its group of similar local authorities with the highest rate in Rotherham (6,138 per 100,000) and lowest in Swindon (2,404 per 100,000) (Productive Healthy Ageing Profile, 2020).
There are no data on inequalities for Bury. England level data suggests a social gradient with the highest rate in most deprived decile at 790 per 100,000 population aged 65-74 years and the lowest rate in the least deprived decile at 371 per 100,000 population aged 65-74 years (Productive Healthy Ageing Profile, 2020).
Common mental health disorders
This indicator is measured as estimated prevalence of common mental disorders: % of population aged 65 & over. It offers local health and care systems an estimation of the prevalence of common mental disorders (CMD) within their area. Its purpose is to aid in the planning of preventative mental health interventions, as well as mental health care and services, including access to psychological therapies through the Improving Access to Psychological Therapies (IAPT) programme
While there may be some local-level estimates for specific CMDs, there are no other validated estimates available for the prevalence of all CMDs. This indicator aims to fill this gap by providing a reliable estimate of local CMD prevalence using national survey data applied to local demographics.
The primary audience for this indicator includes local health and care policymakers, practitioners, and intelligence specialists involved in the provision, planning, and commissioning of services aimed at reducing mental illness and enhancing mental health care for individuals with CMD. By offering estimates of absolute and relative need, this indicator enables policymakers and service providers to take action to improve the mental health and quality of life for those living with CMD. It will also assist national IAPT leads in future planning cycles for the IAPT programme.
There are no recent estimates for Bury and England, with the latest available data for the year 2017. The estimated prevalence of common mental disorders in Bury for the year 2017 was at 10.7%, statistically similar to England average of 10.2%. There are no trend data for Bury and England (Productive Healthy Ageing Profile, 2017).
Bury had the 9th highest prevalence in its group of 16 similar local authorities with the highest prevalence in Rochdale (12.1%) and lowest in Swindon (6.5%) (Productive Healthy Ageing Profile, 2017).
There are no inequalities data available for Bury and England.
Dementia
Dementia is a key contributor to dependence and disability among older individuals in the UK and globally. Individuals with dementia encounter substantial health challenges and may face a mortality risk that is at least twice as high as those without the condition.
Prevalence of dementia (aged 65 years and over)
Prevalence of dementia is defined as the percentage of individuals aged 65 and above who have received a diagnosis of dementia (as recorded on all open and active GP practice disease registers). Objective two of the National Dementia Strategy (2009) emphasises the importance of ensuring that all individuals with dementia have access to appropriate treatment, care, and support following their diagnosis.
The recorded prevalence of dementia provides an insight into the concentration of individuals aged 65 and older within a population who have been diagnosed and are currently living with the condition. This indicator serves as a valuable tool for informing local service planning, helping determine the level of services required to provide necessary treatment, care, and support to enable individuals with dementia to live well with the condition.
Based on the most recent data from 2020, prevalence of dementia in Bury is at 4.63%, significantly above England average of 3.97%. This could be caused by higher prevalence or by better diagnosis and recording, or some combination of the two.
Recent trend for Bury could not be calculated but data from 2017 shows a steady slight decline over the 2017-2020 period (Figure 31). In 2017, the recorded prevalence of dementia was 5.19%, which slightly decreased to 5.12% in 2018 and further declined to 5.09% in 2019. The most recent data from 2020 indicates a prevalence rate of 4.63%. The prevalence of dementia in England follows a similar trend to that of Bury, but with lower prevalence (statistically significant) for all years. In 2017, the recorded prevalence of dementia in England was 4.33%, which remained relatively stable at 4.32% in 2018. It then increased slightly to 4.34% in 2019. The most recent data from 2020 indicates a prevalence of 3.97% for England (Productive Healthy Ageing Profile, 2020).
Figure 31: Recorded prevalence of dementia (aged 65 years and over) in Bury compared with England from 2017-2020
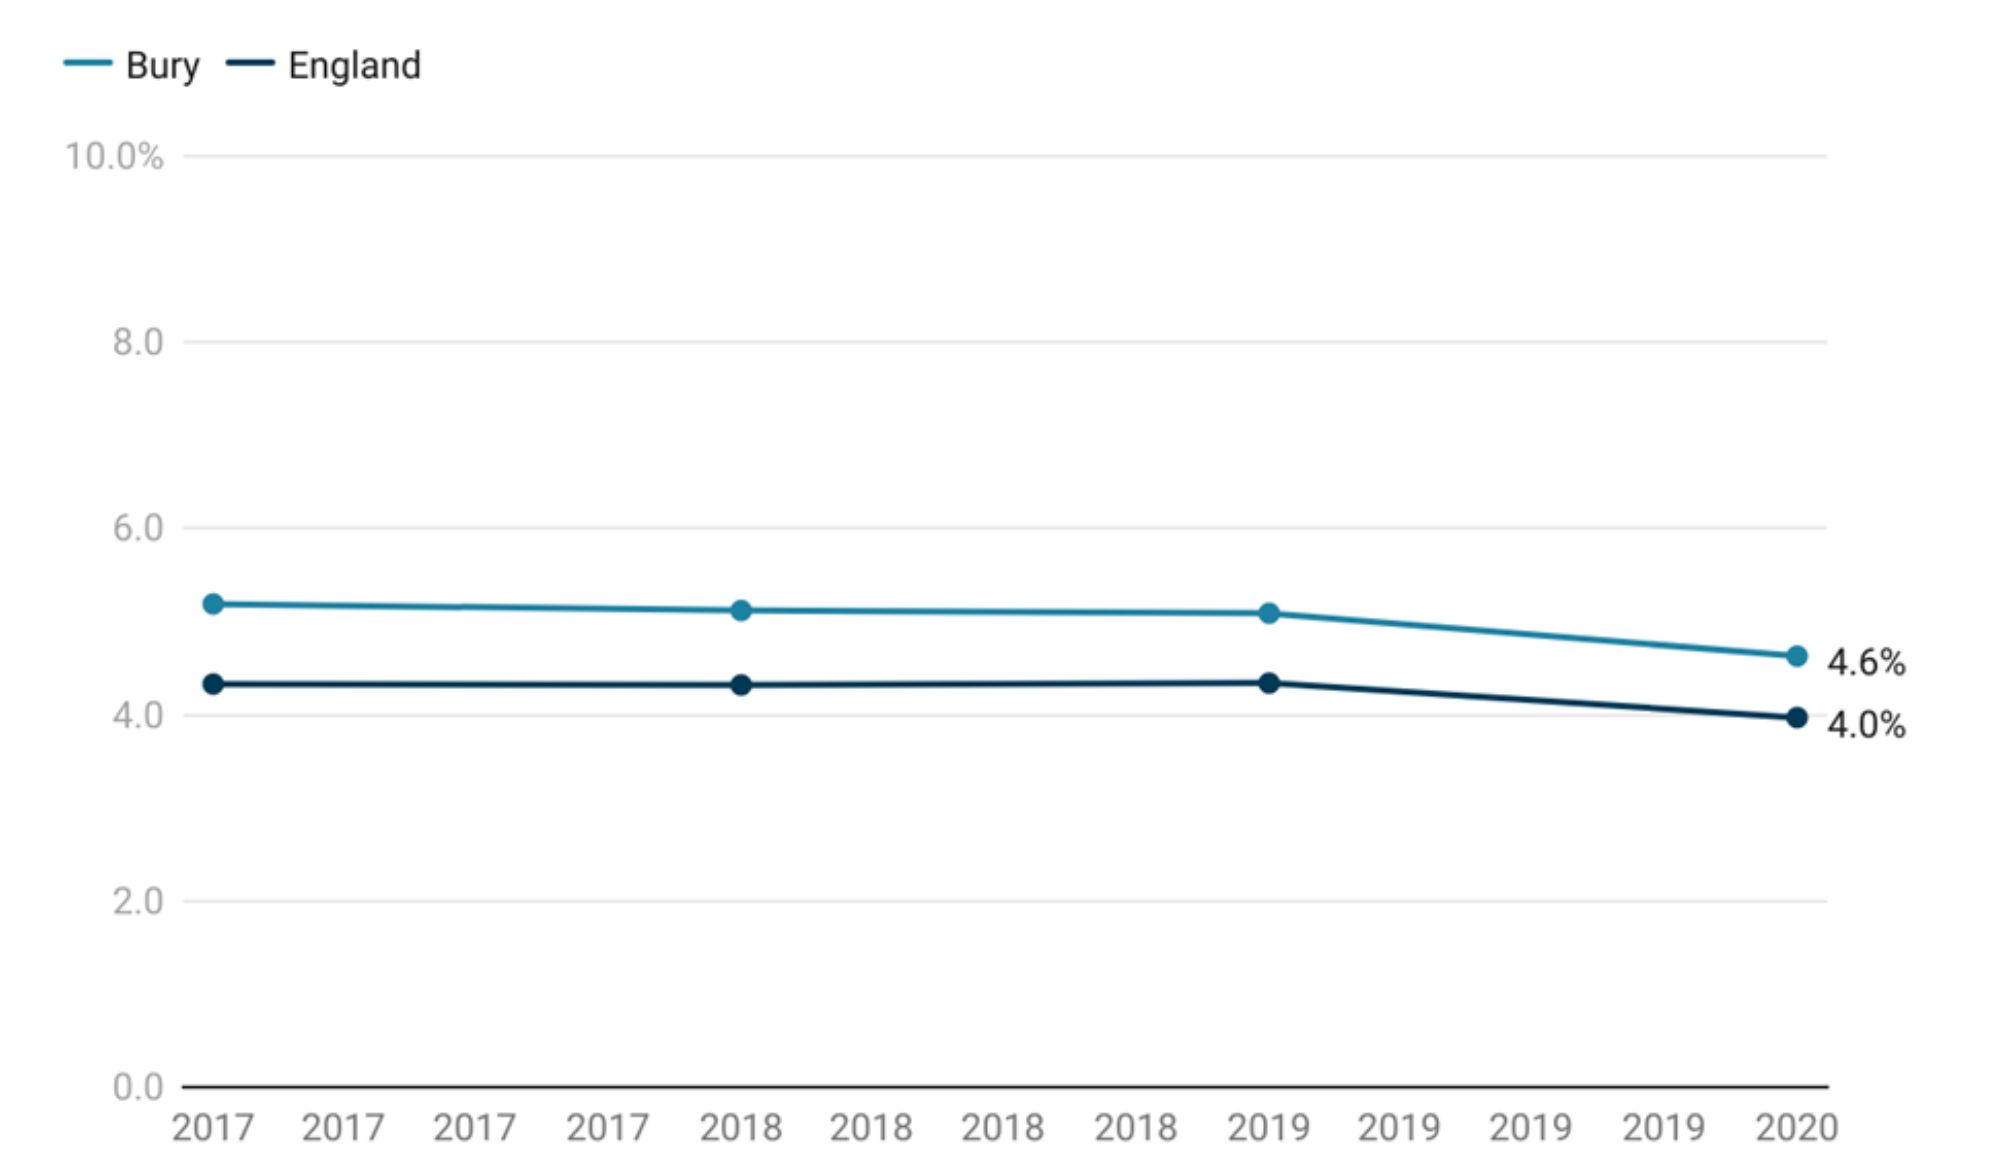
The prevalence of dementia in Bury for the year 2020 is the highest in its group of similar local authorities with the lowest prevalence in Medway at 2.91% (Productive Healthy Ageing Profile, 2020).
There are no data on inequalities for Bury. Data for England are available by deprivation only with highest prevalence in the most deprived decile at 4.16 and lowest in the least deprived (3.89) and most deprived decile (3.81).
Estimated dementia diagnosis rate (aged 65 and over)
The prime minister’s challenge for dementia included a commitment to increase the number of people living with dementia who have a formal diagnosis. The rationale being that a timely diagnosis enables people living with dementia, their carers and healthcare staff to plan accordingly and work together to improve health and care outcomes.
This indicator is defined as ‘The rate of persons aged 65 and over with a recorded diagnosis of dementia per person estimated to have dementia given the characteristics of the population and the age and sex specific prevalence rates of the Cognitive Function and Ageing Study II, expressed as a percentage with 95% confidence intervals. Significance is determined by the nonoverlapping of confidence intervals with the 66.7% benchmark.’
Estimated dementia diagnosis rate (aged 65 and over) in Bury for the year 2022 is at 73.9%, statistically similar to the benchmark goal of 66.7%. The rate in England for the same year is at 62%.
Examining trend data for Bury, estimated dementia diagnosis rate (aged 65 and over) has been declining with slight fluctuations from the highest rate of 85.3% in 2017 to 73.9% in 2022. The rates slightly increased to 86.1% in 2018 from 85.3% in 2017. However, there was a decline in 2019 to 81.9%. The rate remained relatively stable at 82.0% in 2020 before experiencing a notable drop to 74.9% in 2021 and further declining to 73.9% in 2022.
Rates in England remained fairly stable between 2017 (67.9%) and 2020 (67.4%) before sharply declining to 61.6% in 2021 and then stabilising at 62% in 2022 (Figure 32).
Comparing Bury with the benchmark goal of 66.7%, the rates were significantly greater than the benchmark goal from 2017-2020 and then similar from 2021 to 2022. Recent trend data based on the five most recent data points in Bury do not suggest any significant trend for Bury.
Figure 32: Estimated dementia diagnosis rate (aged 65 and over) expressed as a percentage in Bury compared with England from 2017-2022
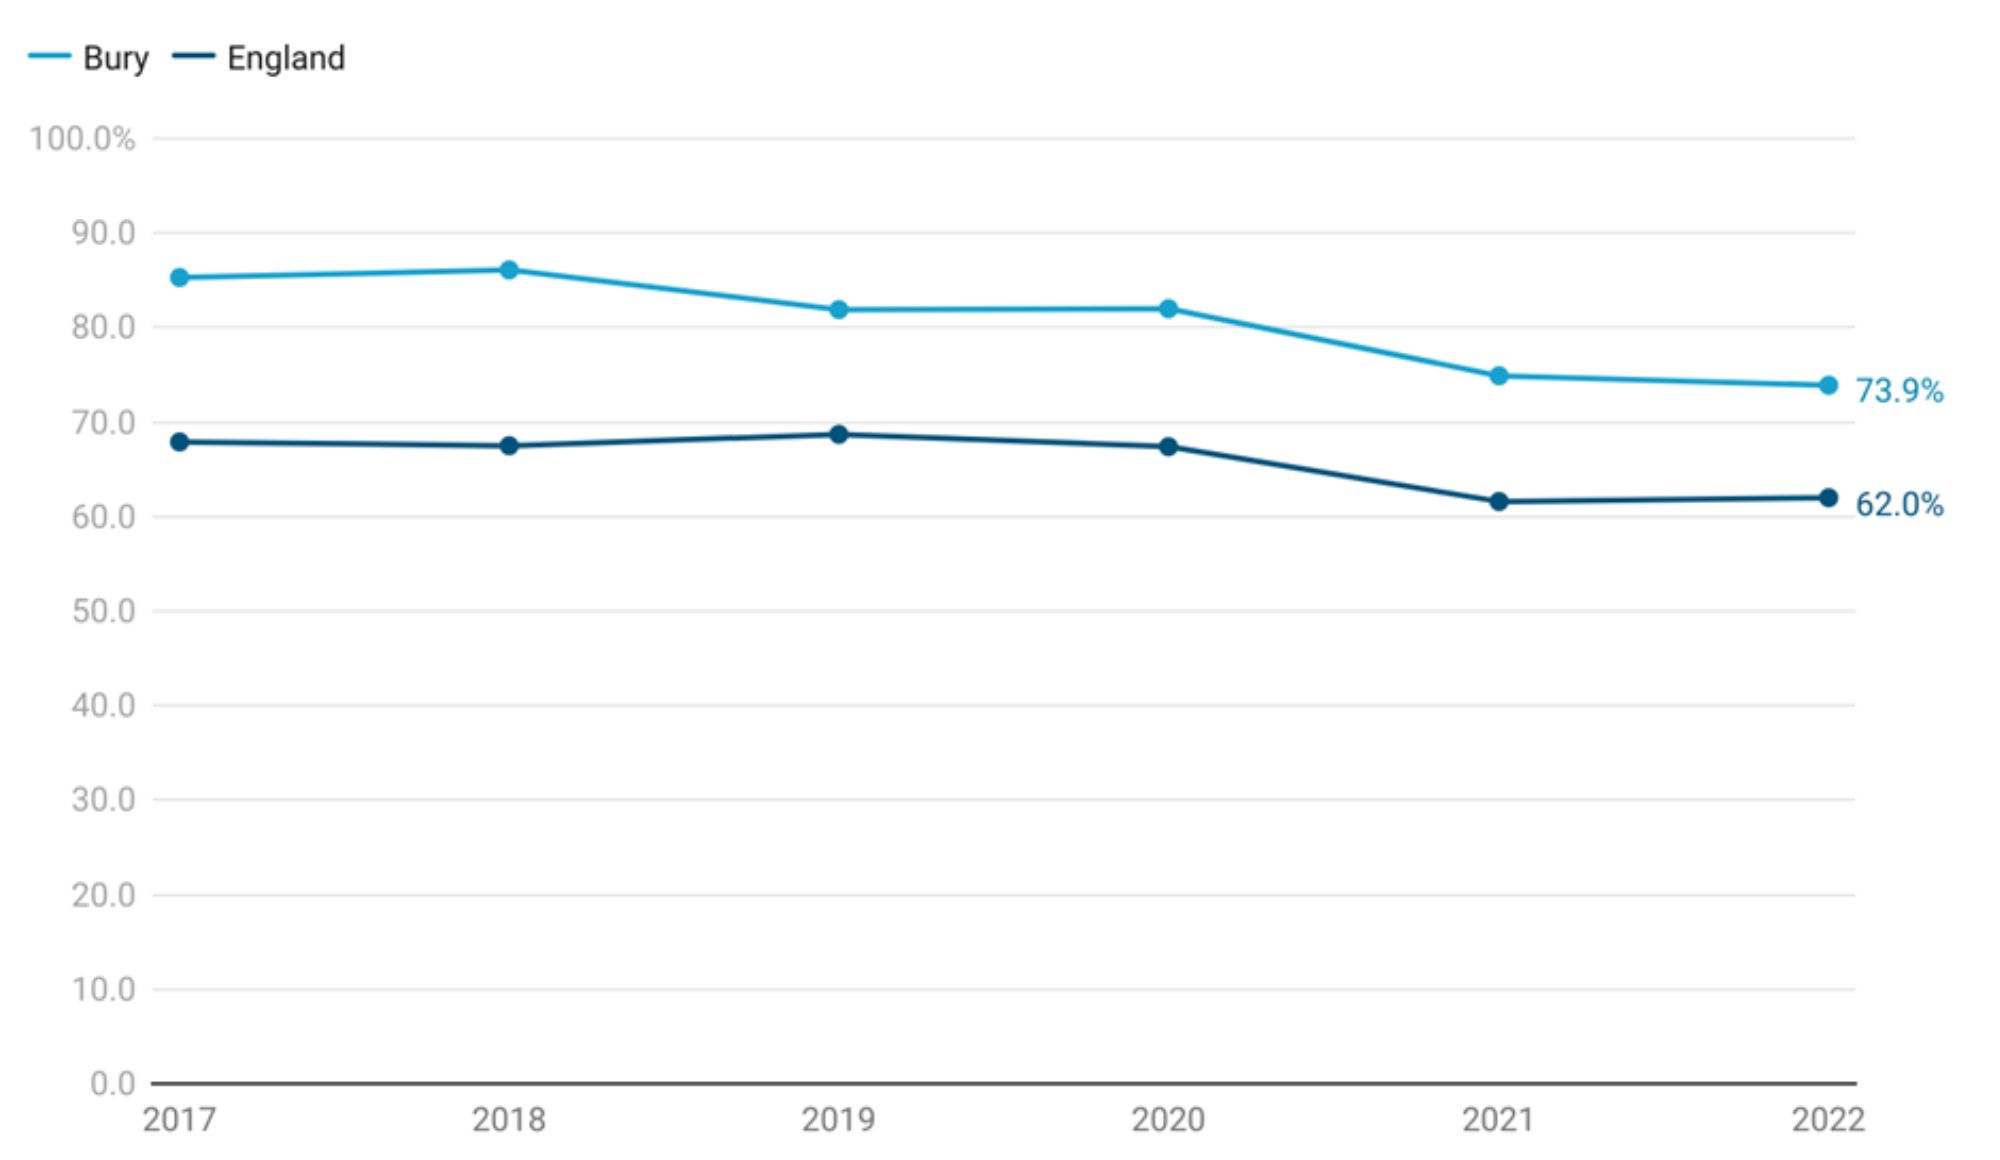
Bury has the 2nd highest estimated dementia diagnosis rate (aged 65 and over) for the year 2022 in its group of similar local authorities with the highest rate in Rotherham at 75.6% and the lowest in Medway at 52.3% (Productive Healthy Ageing Profile, 2022).
Direct standardised rate of emergency admissions for people with dementia (aged 65 years and over)
This indicator plays a significant role in the developmental approach to comprehending the differences in dementia care provision throughout England. It highlights the disparities across the country in terms of emergency admissions for individuals aged 65 and above with dementia or Alzheimer's disease. By identifying areas with both higher and lower rates than the national average, this indicator serves as a valuable tool for further investigation.
Higher-rate areas can shed light on underlying causes and areas for improvement, while lower-rate areas can provide insights into best practices.
This indicator is measured as directly age standardised rate of emergency inpatient hospital admissions for people with a mention of dementia or Alzheimer’s in any of the diagnosis code positions (aged 65+) per 100,000 population.
Based on the most recent data from 2019/20, directly age standardised rate of emergency inpatient hospital admissions for people with a mention of dementia or Alzheimer’s in Bury is at 4,067 per 100,000 significantly above England average of 3,517 per 100,000.
The emergency admission rates for people with dementia (aged 65 years and over) in Bury have shown some fluctuations over the observed period of 2016/17 to 2019/20. In 2016/17, the rate was 3,563 per 100,000 population. This increased slightly to 3,818 admissions in 2017/18. The rate remained relatively stable at 3,800 admissions in 2018/19 before experiencing a slight rise to 4,076 admissions in 2019/20. Minimal fluctuation has been observed in England for this period. In 2016/17, the rate was 3,365 per 100,000 population. This slightly increased to 3,471 in 2017/18 and remained relatively stable at 3,480 in 2018/19. By 2019/20, the rate saw a slight rise to 3,517.
Bury generally had statistically higher rates compared to the national average for England except for 2016/17 where the rates were similar to England’s average (Figure 33).
Figure 33: Direct standardised rate of emergency admissions for people with dementia (aged 65 years and over) in Bury compared with England from 2016/17-2019/20
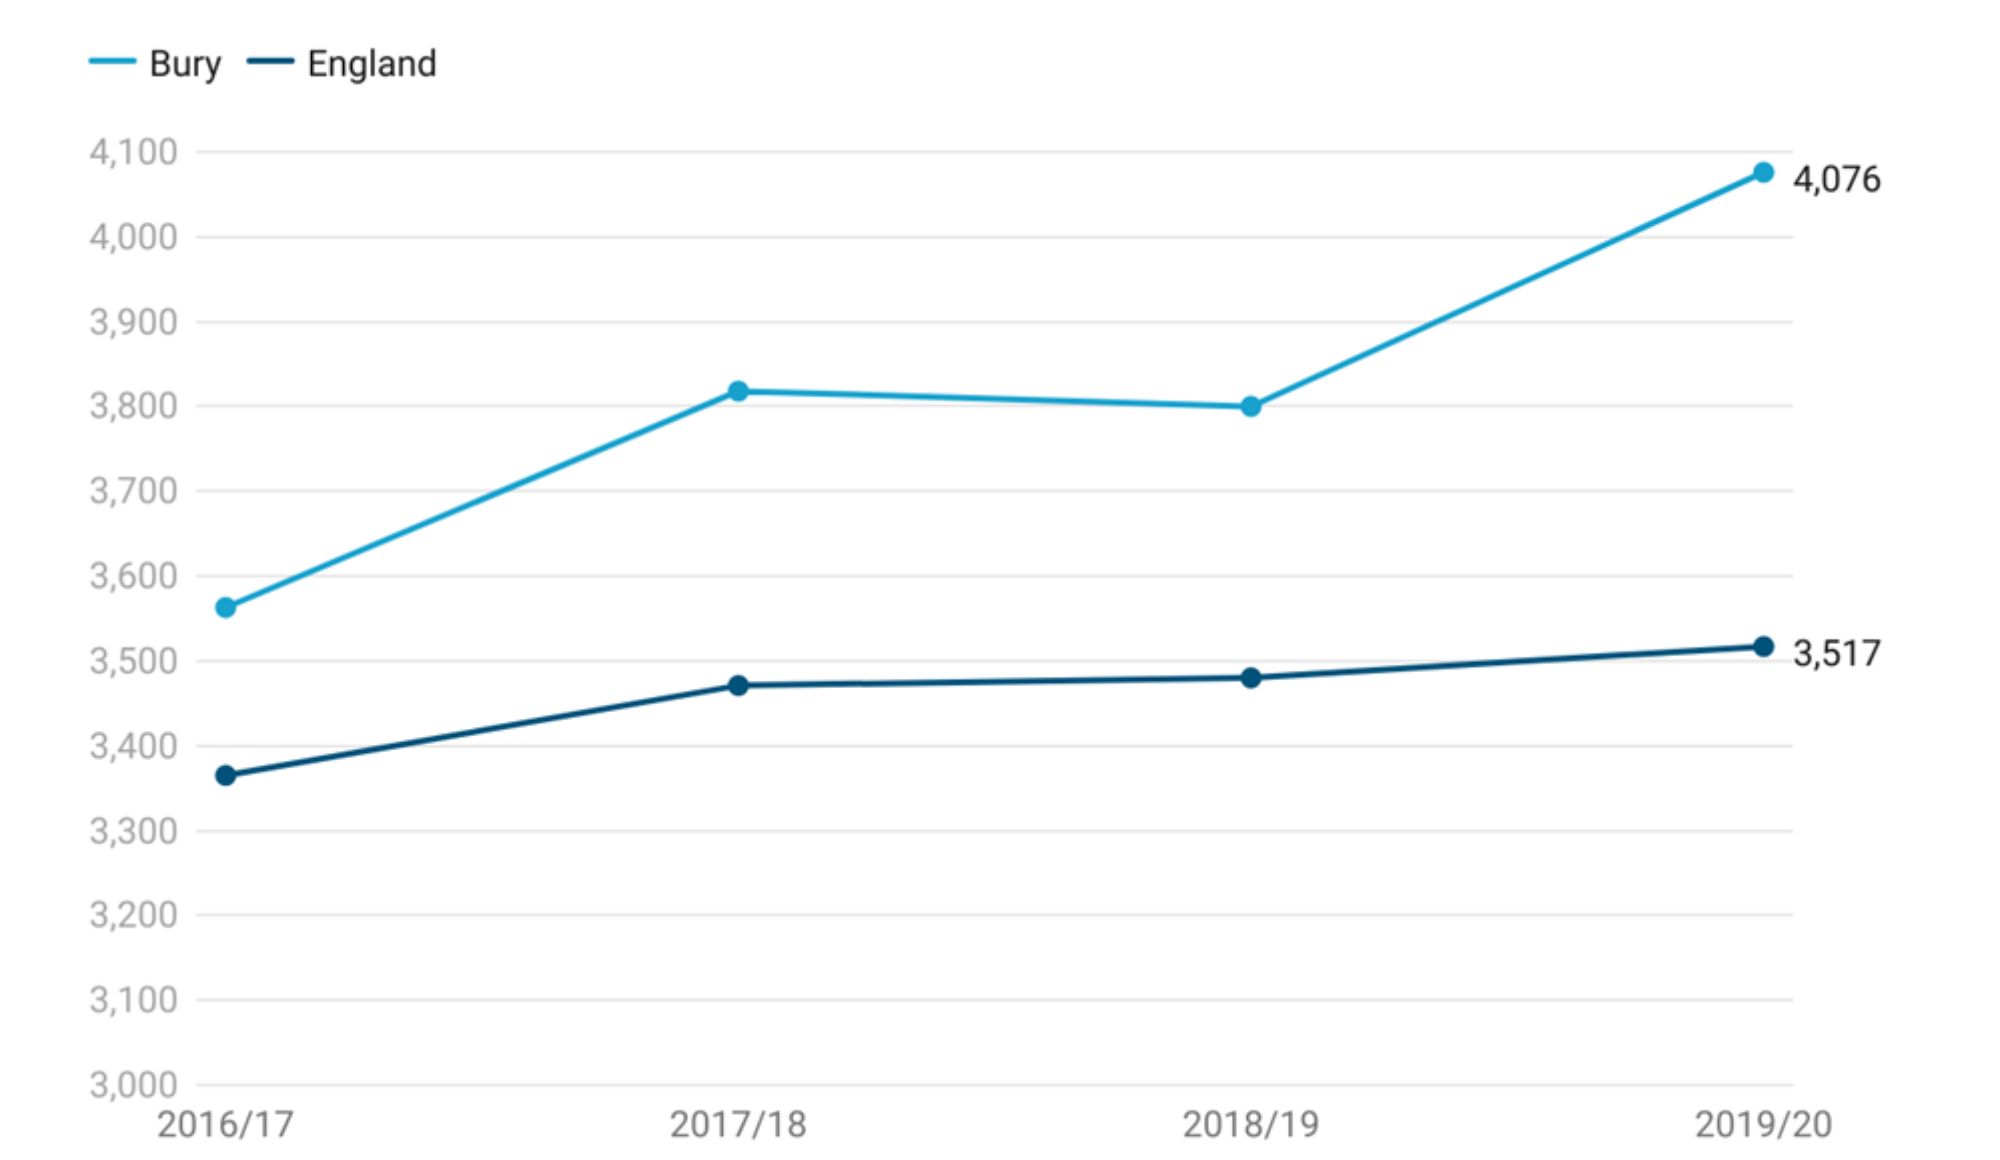
Bury had the 5th highest rate in its group of 16 similar local authorities with the highest rate in Derby (2,550) and lowest in Medway (1,085) (Productive Healthy Ageing Profile, 2020).
There are no inequalities data available for Bury and England.
Dementia care plan
If a patient with dementia does not already have a care plan or an advanced care plan in place, it is expected that the general practice will develop one for them. During a face-to-face care plan or advanced care plan review, the focus is on assessing the support needs of the patient and their caregiver. The review should address several key issues, including conducting a comprehensive physical, mental health, and social review for the patient, documenting the patient's future wishes, establishing communication and coordination arrangements with secondary care if necessary, and identifying the patient's caregiver(s).
In addition, the following steps should be taken:
Obtaining appropriate permissions to authorise the practice to directly communicate with the nominated caregiver(s) and providing them with details of support services available to the patient and their family, if applicable. This includes addressing the caregiver's information needs based on the stage of the illness and their own health and social care needs.
Involving the caregiver, as appropriate, in the care plan or advanced care plan discussions.
Assessing the impact of caregiving on the caregiver.
Offering the caregiver a health check to address any physical and mental health impacts and referring them to relevant services to support their overall health and well-being.
Patients diagnosed with dementia should be offered annual face-to-face appointments specifically to review their diagnosis and/or their care plan or advanced care plan. The content and duration of the review consultation is agreed upon between the practice, the patient, and their caregiver. In some cases, extended consultations of up to 30 minutes are required. Ideally, the first such appointment should take place within six months of the diagnosis.
Starting from April 1st, 2019, exception reporting has been replaced by Personalised Care Adjustments (PCAs). PCAs can be implemented for various specific reasons and are typically determined by either the patient or the general practitioner (GP) on a personal basis. Some examples of PCAs include a patient or caregiver refusing a particular treatment, a patient cancelling or failing to attend a scheduled appointment, or a GP advising against the simultaneous administration of two types of medication or treatment methods.
To obtain a more accurate representation of the rate at which interventions are provided, the percentage of patients receiving the intervention (denominator) now includes Personalised Care Adjustments (PCAs). In other words, it encompasses all patients on the register, regardless of their PCA status. This measure is considered more relevant from a public health perspective, as it covers the entire patient population to which the indicator applies.
The dementia care plan indicator measures the percentage of patients diagnosed with dementia whose care plan has been reviewed in a face-to-face review in the preceding 12 months. For the period 2020/21, only 26% of patients diagnosed with dementia had their care plan reviewed in Bury, significantly worse than England average of 39.7%.
Examining trend data for Bury from 2017/18 to 2020/21, there was an increase in care plan review from 82.0% in 2017/18 to 83.9% in 2018/19, followed by a slight decrease to 79.9% in 2019/20. The most significant decline occurred in 2020/21, with only 26.0% of dementia patients receiving care plan reviews. Similar trend was observed for England, with an increase from 77.5% in 2017/18 to 78% in 2018/19, followed by a slight decrease to 75% in 2019/20 and then a sharp decline in 2020/21 to 39.7%. The decline observed in 2020/21 may be attributable to the impact of COVID-19 on the health services.
Bury generally had statistically higher percentages of care plan reviews compared to the national average for England, with the exception of 2020/21, where the percentage was below England’s average (Figure 33). No recent trend data for Bury could be calculated.
Figure 33: Proportion of dementia care plan reviewed in the last 12 months (denominator incl. PCAs) in Bury compared with England from 2017/18-2020/21
.jpg)
Bury had the 6th lowest proportion of dementia care plan reviews in its group of 16 similar local authorities in 2020/21 with the highest proportion of reviews in Bolton (48.2%) and lowest in Dudley (3.4%) (Productive Healthy Ageing Profile, 2021).
There are no inequalities data available for Bury. Data by deprivation are available for England only with higher proportion of reviews in the most deprived decile (42.5%) compared with the least deprived decile (37.6%) (Productive Healthy Ageing Profile, 2021).
Falls, Frailty and Mobility
As individuals age, the process of ageing can introduce barriers that hinder their ability to live a healthy and safe life within the community. These barriers often manifest as difficulties in performing activities of daily living (ADLs), which encompass various aspects of daily functioning. Specifically:
Mobility: This refers to the capacity to move independently or with the aid of assistive devices within an environment (Weber et al, 2010). Difficulties with mobility can include tasks such as navigating stairs, walking along a road, or moving around one's own home
Personal care: This involves undertaking tasks necessary to maintain personal hygiene, including activities like washing, toileting, and medication administration.
Domestic care: This encompasses activities aimed at maintaining a healthy living environment, such as cooking meals and cleaning.
It is important to note that older individuals may experience a progression of difficulties, where they may struggle with domestic tasks while still maintaining independence in personal care. However, these challenges can be further exacerbated by issues related to frailty, which can impact an individual's overall ability to cope with daily tasks.
The ageing process presents a range of challenges for older individuals, including frailty, illnesses, and age-related conditions such as dementia. Consequently, some older people may require support from social care services to address their specific needs, particularly when they struggle with basic self-care tasks.
Frailty is characterised by low energy, slower walking speeds, and poor strength, and it is not an inevitable outcome of the ageing process (BGS, 2017). However, the prevalence of frailty tends to increase with age, with women being more likely to be affected compared to men. The severity of frailty also tends to escalate significantly in the year leading up to death (Steptoe A et al, 2013).
The impact of ageing and the loss of independence can have adverse effects not only on an individual's life but also on the broader health and social care system. This is due to the increased demand for costly and intensive support services. These services are guided by the statutory obligations outlined in the Care Act 2014, which places a responsibility on Local Authorities to prioritise person-centred care that considers the physical, mental, and emotional well-being of individuals. The goal is to achieve this through the implementation of strengths-based and preventative care and support services. This approach is crucial because many age-related conditions that worsen mobility and personal care challenges can be mitigated, delayed, or even prevented through early lifestyle adjustments and targeted interventions.
Emergency hospital admissions due to falls in people aged 65 and over
Falls are the leading cause of emergency hospital admissions among older individuals, significantly impacting their long-term outcomes. For instance, falls often serve as a major factor leading individuals to transition from their own homes to long-term nursing or residential care settings (DOH, 2012).
The risk of falls is most pronounced among those aged 65 and above. It is estimated that a substantial proportion of individuals in this age group experience at least one episode of falling each year, including approximately 30% (2.5 million) of those living at home and around 50% of those residing in residential care or continuing to live at home at the age of 80 and above (NICE, 2017). Falls resulting in injuries can have severe consequences, with approximately 1 in 20 older adults in the community experiencing fractures or requiring hospitalisation as a result of falls. In England alone, falls and fractures among individuals aged 65 and above account for over 4 million bed days per year, generating an estimated cost of £2 billion (RCP, 2011).
To address the issue of falls, the National Institute for Health and Clinical Excellence (NICE) has developed a quality standard that focuses on assessing and preventing further falls (secondary prevention) in older people living in the community and during hospital stays. This standard aims to drive measurable improvements across three dimensions of quality: patient safety, patient experience, and clinical effectiveness (NICE, 2017).
It is important to note that this measure should be understood in the context of assessing health service utilisation rather than determining individual need. Not all injurious falls lead to emergency admissions, and it should not be used as a sole indicator of falls prevention service effectiveness. Various underlying conditions, such as osteoporosis, can increase susceptibility to injuries, and the treatment of such conditions falls under the purview of other healthcare services.
Emergency hospital admissions for falls injuries in persons aged 65 and over is measured as a directly age standardised rate per 100,000. Data from 2021/22 shows that Bury’s rate of 1,857 per 100,000 was significantly better than England average of 2,100 per 100,000. No trend data are available for Bury and England (Productive Healthy Ageing Profile, 2022).
Bury has the 5th lowest rate of emergency hospital admissions for falls injuries in persons aged 65 and over in its group of 16 similar local authorities with the highest rate in Wigan at 3,272 and lowest in Doncaster at 1,736 (Productive Healthy Ageing Profile, 2022).
Data on inequalities in Bury are only available by sex with statistically higher admission rates (2,1333) compared to Bury average in females and statistically lower rates (1,431) compared to Bury average in males. Similar inequalities are seen in England with statistically higher than the average rates in females (2,360) and lower (1,750) rates in males. Data by levels of deprivation are available at England only with higher rates in the three most deprived deciles and lower rates in the four least deprived deciles.
Hip Fractures
Hip fracture is a debilitating condition that has significant implications for individuals' independence. Only one in three individuals who experience a hip fracture are able to regain their former levels of independence, while one in three end up leaving their own homes and transitioning to long-term care. The prevalence of hip fractures is nearly as common and costly as strokes, and the incidence of these fractures is on the rise. In the UK, approximately 75,000 hip fractures occur annually, resulting in an estimated health and social cost of around £2 billion per year.
The average age of individuals experiencing hip fractures is approximately 83 years, and the majority of fractures, about 73%, occur in women. Moreover, there is a high prevalence of comorbidity in individuals with hip fractures. According to the National Hip Fracture Database mortality rates associated with hip fractures are substantial, with approximately one in ten individuals with a hip fracture passing away within one month and approximately one in three within twelve months (NHFD, 2013).
Hip fractures are measured as directly age standardised Emergency Hospital Admission rate for fractured neck of femur in persons aged 65 and over per 100,000. Interventions aimed at recently retired and active older individuals are expected to differ in terms of provision and uptake compared to interventions for frailer older people. Consequently, this indicator includes sub-indicators that specifically focus on age groups of 65 to 79 years and 80 years and above, with further disaggregation by sex. Examining indicators by the age groups promotes the prioritisation of interventions targeted towards these specific populations, acknowledging the varying needs and circumstances of older individuals.
Emergency Hospital Admission rate for fractured neck of femur in persons aged 65 and over per 100,000
Data from 2021/22 shows that Bury’s rate of 559 per 100,000 was statistically similar to England average of 551 per 100,000. No trend data are available for Bury and England (Productive Healthy Ageing Profile, 2022).
Bury has the 8th highest rate of emergency hospital admissions for hip fractures in persons aged 65 and over in its group of 16 similar local authorities with the highest rate in Oldham at 630 and lowest in Derby at 494 (Productive Healthy Ageing Profile, 2022).
Data on inequalities in Bury are only available by sex with statistically higher admission rates (701) in females and statistically lower rates (361) in males compared to Bury average. Similar inequalities are seen in England with statistically higher than the average rates in females (661) and lower (401) rates in males. Data by levels of deprivation for England shows a deprivation gradient with increasing rates of falls with higher levels of deprivation. The highest rates are in the most deprived decile (595) and lowest in least deprived decile (513).
Emergency Hospital Admission rate for fractured neck of femur in persons aged 65 to 79 per 100,000
According to data from 2021/22, the rate of emergency hospital admissions for hip fractures in persons aged 65-79 in Bury was 237 per 100,000 population, which was statistically similar to the average rate of 236 per 100,000 in England. No trend data are available for Bury or England to assess changes over time (Productive Healthy Ageing Profile, 2022).
Bury ranks 10th highest for emergency hospital admissions for hip fractures among individuals aged 65 and over in its group of similar 16 local authorities. The highest rate was observed in Calderdale at 302 per 100,000 population, while the lowest rate was in Rotherham at 196 per 100,000 population (Productive Healthy Ageing Profile, 2022).
Data on inequalities in Bury are available by sex only. The rates in females are higher (313) compared with males (153) in Bury but there are no statistically significant differences for both sexes when compared with Bury average. Data by sex for England shows statistically higher rates in females (294) and lower rates in males (170) compared to the average rate for England.
Additionally, data based on levels of deprivation in England demonstrate a deprivation gradient, where rates of falls increase with higher levels of deprivation. The highest rates are found in the most deprived decile (269), while the lowest rates are observed in the least deprived decile (210).
Emergency Hospital Admission rate for fractured neck of femur in persons aged 80 and over per 100,000
Based on data from 2021/22, the rate of emergency hospital admissions for hip fractures among individuals aged 80 years and over in Bury was 1,493 per 100,000 population, which was statistically similar to the average rate of 1,466 per 100,000 in England. There are no available trend data for Bury or England to evaluate changes over time (Productive Healthy Ageing Profile, 2022).
When compared to Bury’s group of 16 similar local authorities, Bury ranks 8th highest in terms of emergency hospital admissions for hip fractures among individuals aged 80 and over. Medway recorded the highest rate at 1,708 per 100,000 population, while Bedford had the lowest rate at 1,260 per 100,000 population (Productive Healthy Ageing Profile, 2022).
Data on inequalities in Bury are only available by sex. The admission rates for females (1,826) are higher compared to males (964) in Bury. Males have statistically lower admission rates when compared to Bury average. Examining data by sex for England suggests that there are statistically higher admission rates (1,726) in females and statistically lower rates (1,071) in males compared to Bury average. Additionally, data based on levels of deprivation in England demonstrate a deprivation gradient, where rates of falls increase with higher levels of deprivation. The highest rates are observed in the most deprived decile (1,541), while the lowest rates are found in the least deprived decile (1,390).
Adult Social Care Outcomes
The Adult Social Care Outcomes Framework (ASCOF) measures how well care and support services achieve the outcomes relevant to the service users and their carers. The ASCOF is used both locally and nationally to set priorities for care and support and measure progress against a set of social care indicators (NHS Digital, 2022). This section reports Bury’s performance on ASCOF indicators.
Reablement services - Percentage of people aged 65 and over offered reablement services following discharge from hospital.
This indicator measures the benefit to individuals from reablement, intermediate care and rehabilitation following a hospital episode, by determining whether an individual remains living at home 91 days following discharge – the key outcome for many people using reablement services. It captures the joint work of social services and health staff and services commissioned by joint teams, as well as adult social care reablement.
For the year 2021/22, 1.4% percentage of people aged 65 and over in Bury were offered reablement services following discharge from hospital statistically worse than England average of 2.8%.
Trend data for Bury suggests an overall decreasing trend (statistically significant) with the highest proportion of 4.4% in 2010/11 and lowest in 2020/21 of 1.2%. In 2010/11, the percentage was 4.4%, which increased to 5.9% in 2011/12. However, there was a decline to 4.0% in 2012/13, followed by a slight rise to 4.6% in 2013/14. This was followed by a significant drop to 2.8% in 2014/15 and a further decrease to 2.1% in 2015/16. The trend showed a slight increase to 3.0% in 2016/17, and from 2017/18 to 2019/20, the percentage remained relatively stable at around 2.9% to 3.5%. However, there was a notable decline to 1.2% in 2020/21, followed by a slight increase to 1.4% in 2021/22.
England showed some fluctuations over the specified period. In 2010/11, the percentage was 3.0%, which increased slightly to 3.2% in 2011/12 and remained stable at 3.2% in 2012/13. There was a slight rise to 3.3% in 2013/14, followed by a decrease to 3.1% in 2014/15. The trend continued downward to 2.9% in 2015/16 and further dropped to 2.7% in 2016/17. The percentage increased slightly to 2.9% in 2017/18, and from 2018/19 to 2019/20, it remained relatively stable at around 2.8% to 2.6%. There was a slight increase to 3.1% in 2020/21, followed by a decrease to 2.8% in 2021/22 (Figure 34).
Comparing Bury with England, the proportion in Bury were statistically better than England average from 2010/11 through to 2013/14 and in 2019/20 and statistically worse in the period 2015/16 and the two most recent years 2020/21 and 2021/22.
Figure 34: Percentage of people aged 65 and over offered reablement services following discharge from hospital in Bury compared with England from 2010/11-2021/22
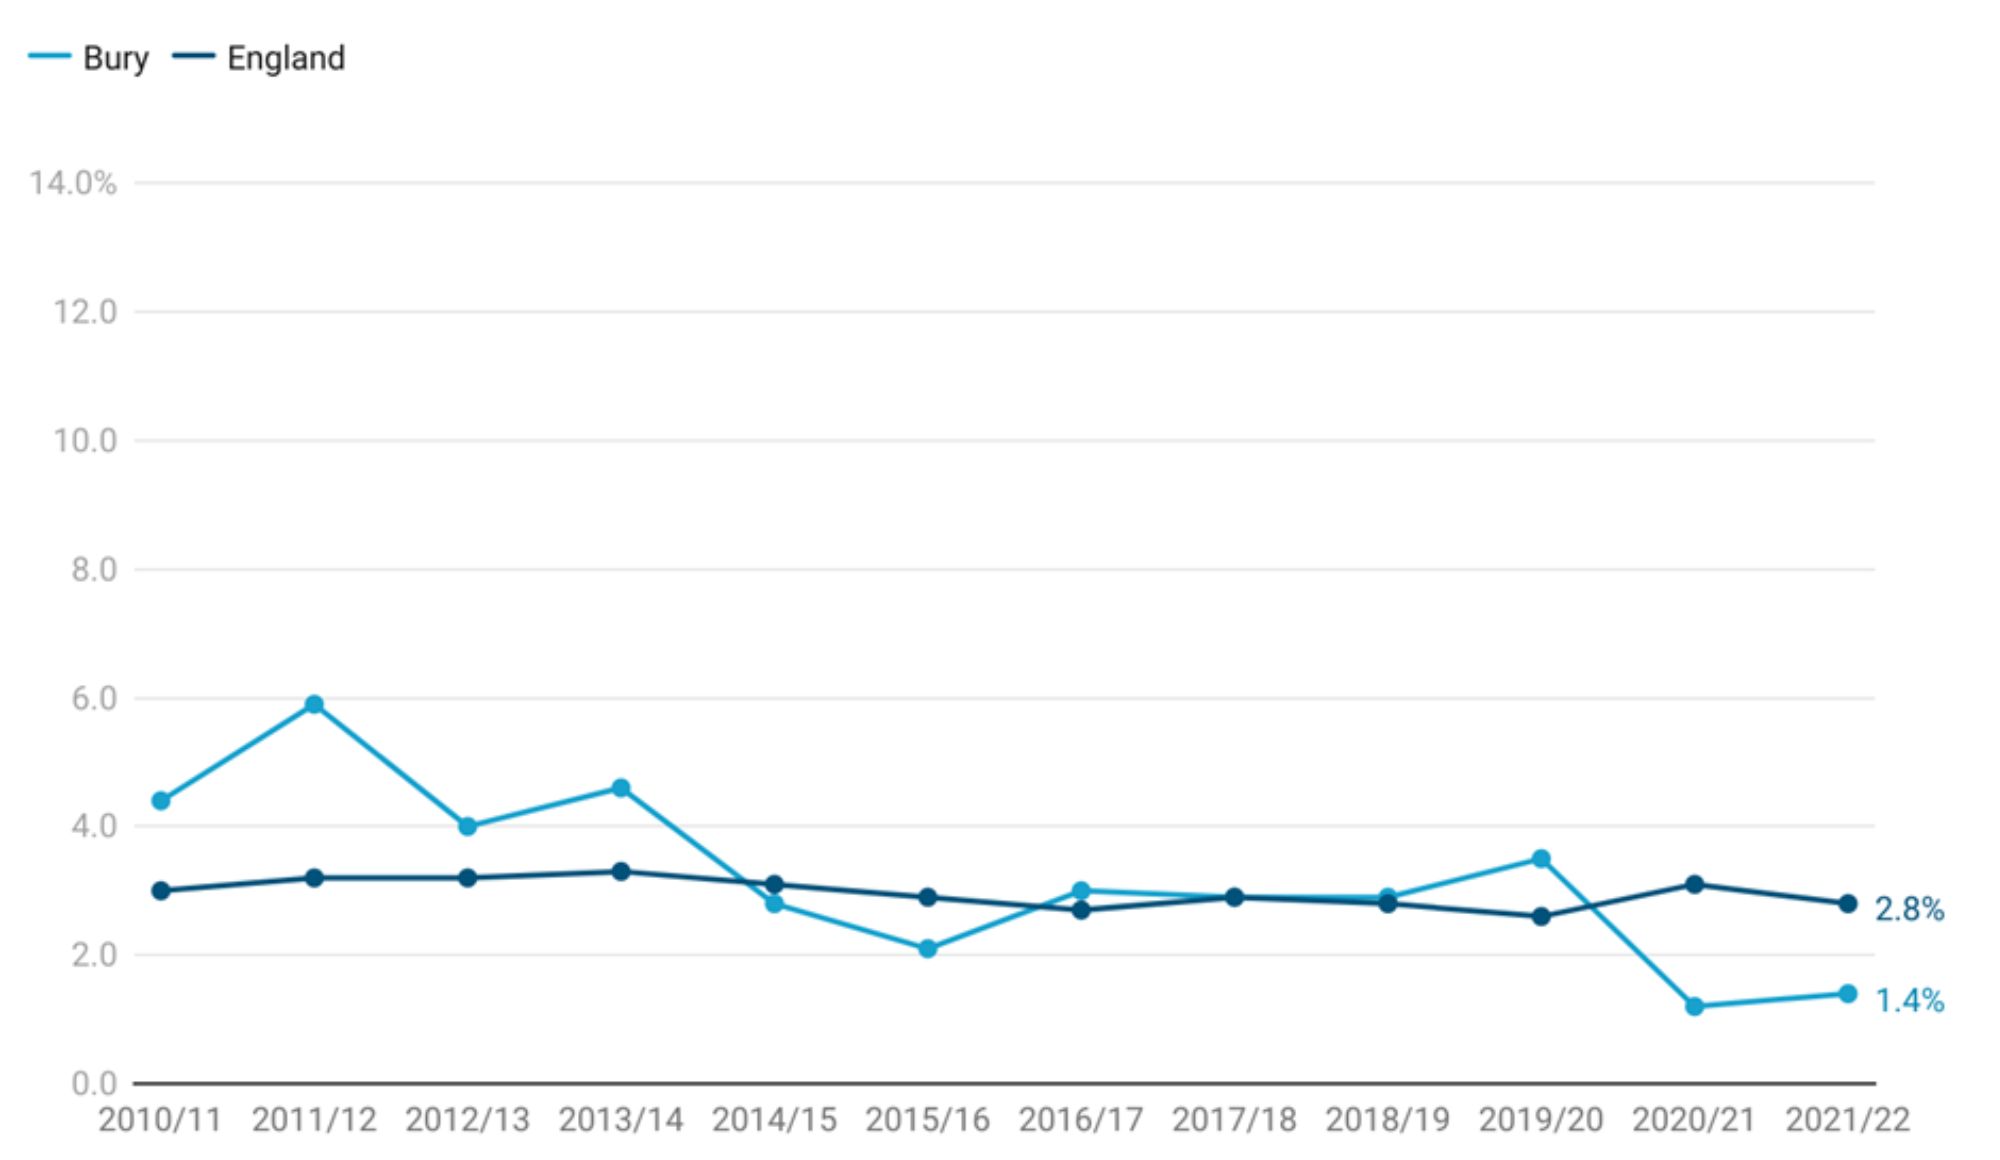
When compared to Bury’s group of 16 similar local authorities, Bury has the lowest percentage of people aged 65 and over offered reablement services following discharge from hospital with the highest proportion in Medway at 75% (Productive Healthy Ageing Profile, 2022).
There are no inequalities data for Bury. Data for England are available by deprivation only with highest percentage of people aged 65 and over offered reablement services following discharge from hospital (3.9%) in the most deprived decile and lowest in the least deprived decile (2.5%), second and fourth less deprived (both at 2.3%) and fifth less deprived decile (2%).
Reablement services - Percentage of people aged 65 and over who were still at home 91 days after discharge from hospital into reablement services
The percentage of people aged 65 and over who were still at home 91 days after discharge from hospital into reablement services in Bury for the period 2021/22 is 87.3%, statistically similar to England average of 81.8%.
The trend for Bury has shown fluctuations with no statistically significant change based on the five most recent data points. The percentage increased significantly from 76.9% in 2010/11 to 86.7% in 2011/12. There was a slight decline in subsequent years, followed by a notable increase to 89.0% in 2014/15. The trend then displayed slight decreases, ranging from 86.3% in 2015/16 to 81.0% in 2017/18. From 2018/19 to 2019/20, the percentage remained relatively stable, ranging from 82.5% to 81.3%. However, in 2020/21, the percentage returned to the same level as 2010/11, at 76.9% before increasing to 87.3% in 2021/22 (Figure 35).
Comparing Bury with England, the proportion in Bury were statistically similar to England average for all years with the exception of 2014/15, where the proportion (89%) was better than England average (81.8%).
Figure 35 - Percentage of people aged 65 and over who were still at home 91 days after discharge from hospital into reablement services in Bury compared with England from 2010/11-2021/22
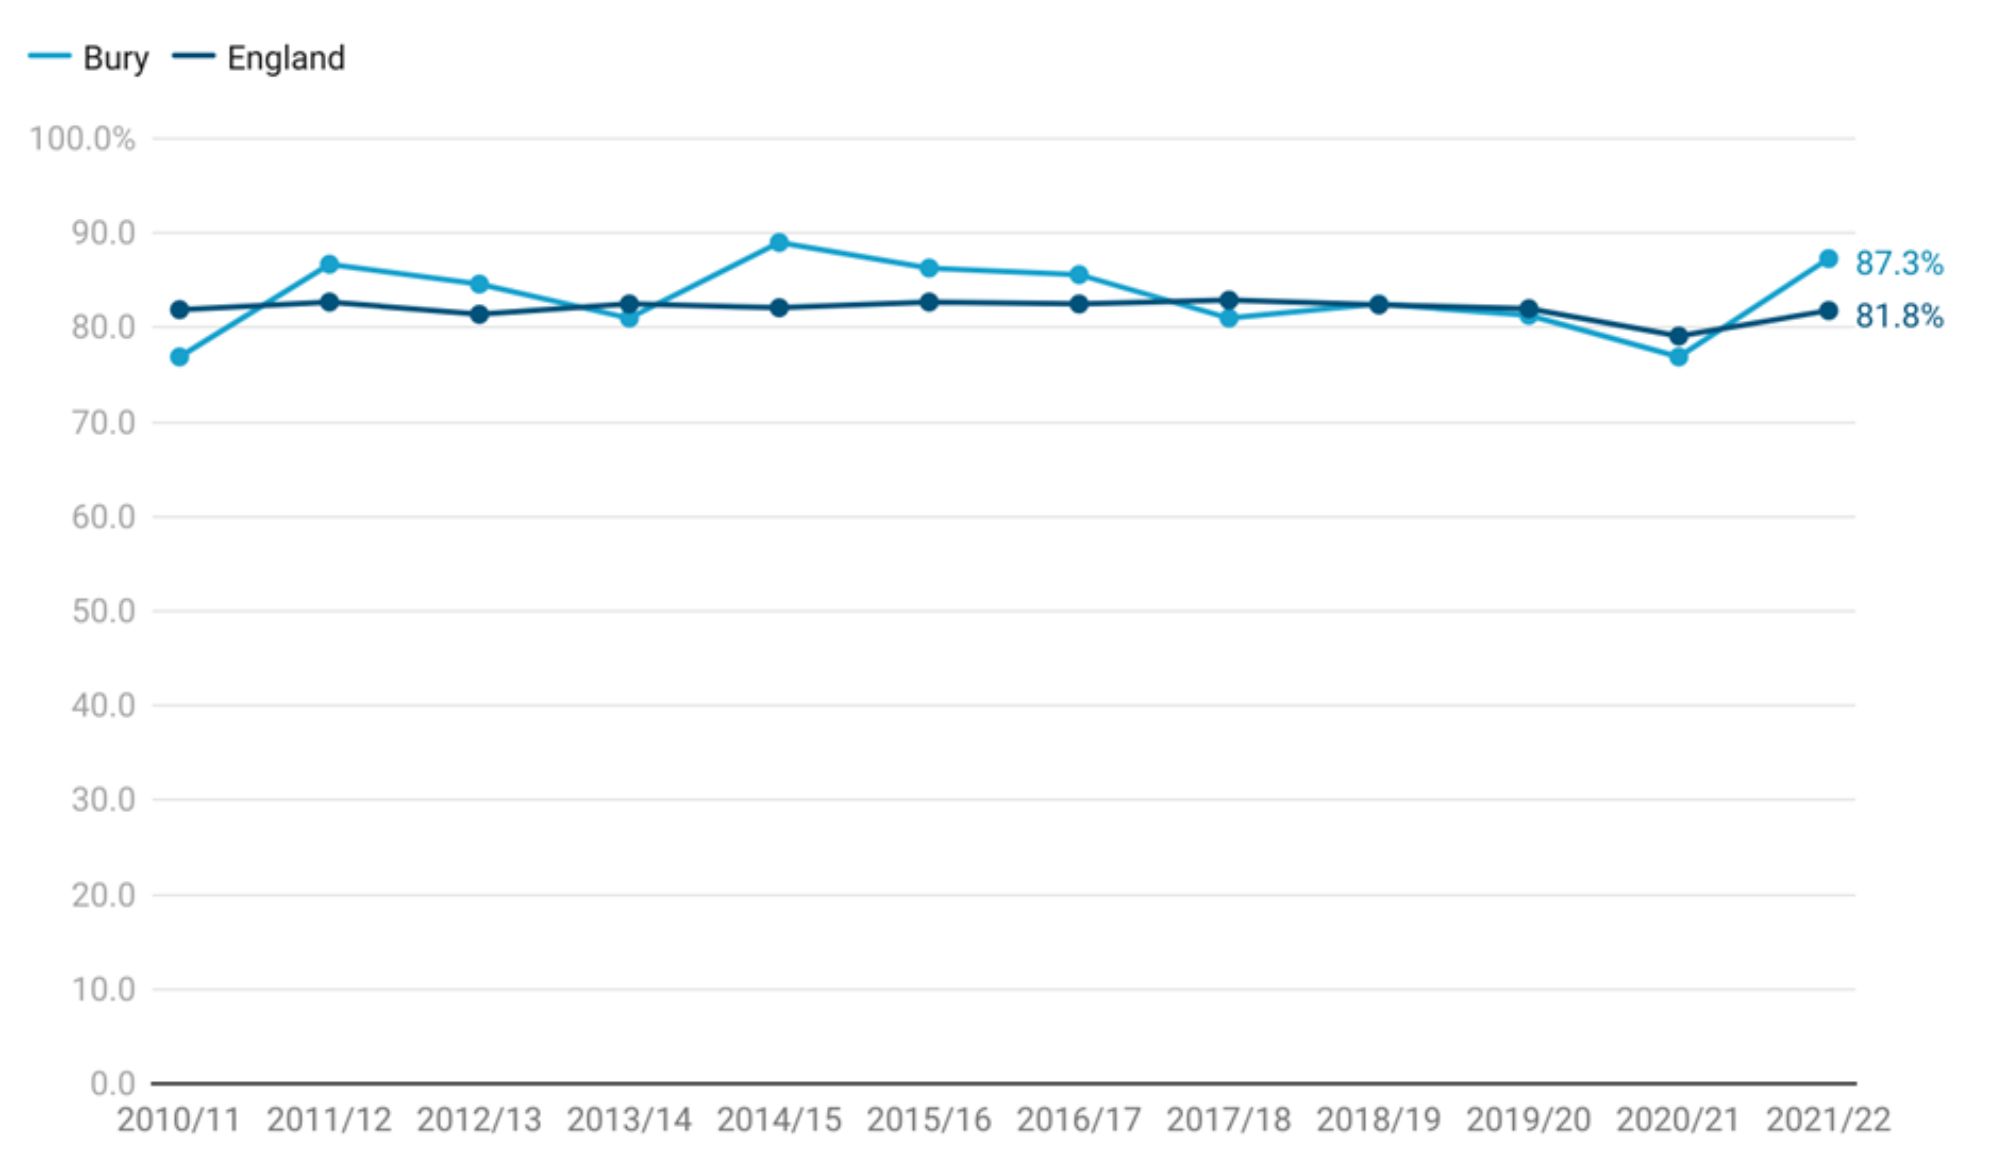
When compared to Bury’s group of 16 similar local authorities, Bury has the 7th highest percentage of people aged 65 and over who were still at home 91 days after discharge from hospital into reablement services, with the highest proportion in Stockport at 90.3% and lowest in Medway at 61.7% (Productive Healthy Ageing Profile, 2022).
There are no inequalities data for Bury. Data for England are available by deprivation only with highest percentage of people aged 65 and over who were still at home 91 days after discharge from hospital into reablement services (3.9%) in the fourth most deprived decile (84.2%) and lowest in the 2nd most deprived decile (77.5%).
Social isolation - percentage of adult social care users who have as much social contact as they would like
This indicator is measured as the percentage of respondents to the Adult Social Care Survey (service users 65 years and over) who responded to the question "Thinking about how much contact you've had with people you like, which of the following statements best describes your social situation?" with the answer "I have as much social contact as I want with people I like". This measure applies to those people in receipt, at the point that data are extracted, of long-term support services funded or managed by social services following a full assessment of need.
% of adult social care users reported having as much social contact as they would like, higher but statistically similar to England average of 37.3% (Productive Healthy Ageing Profile, 2022).
Examining data from 2014/15 to 2021/22, the percentage of adult social care users aged 65 years and over reporting having as much social contact as they would like increased sharply from 41.9% in 2014/15 to 49.1% in 2015/16. This was followed by a decline to 45.9% in 2016/17, followed by a slight increase to 47.5% in 2017/18. In 2018/19, there was a notable decrease to 38.9%. The percentage then increased again to 45.1% in 2019/20. The most recent data available for 2021/22 shows a decline to 38.3%. Trend data based on 5 most recent data points shows no significant change in Bury. England has seen a decline in the percentage of adult social care users aged 65 years and over reporting having as much social contact as they would like from the highest at 44% in 2017/18 to the lowest at 37.3% in the most recent data for the year 2021/22 (Figure 36).
Comparing Bury with England, the proportion of adult social care users aged 65 years and over reporting having as much social contact as they would like has been statistically similar.
Figure 36: Percentage of adult social care users who have as much social contact as they would like (65 plus years) in Bury compared with England from 2014/15-2021/22
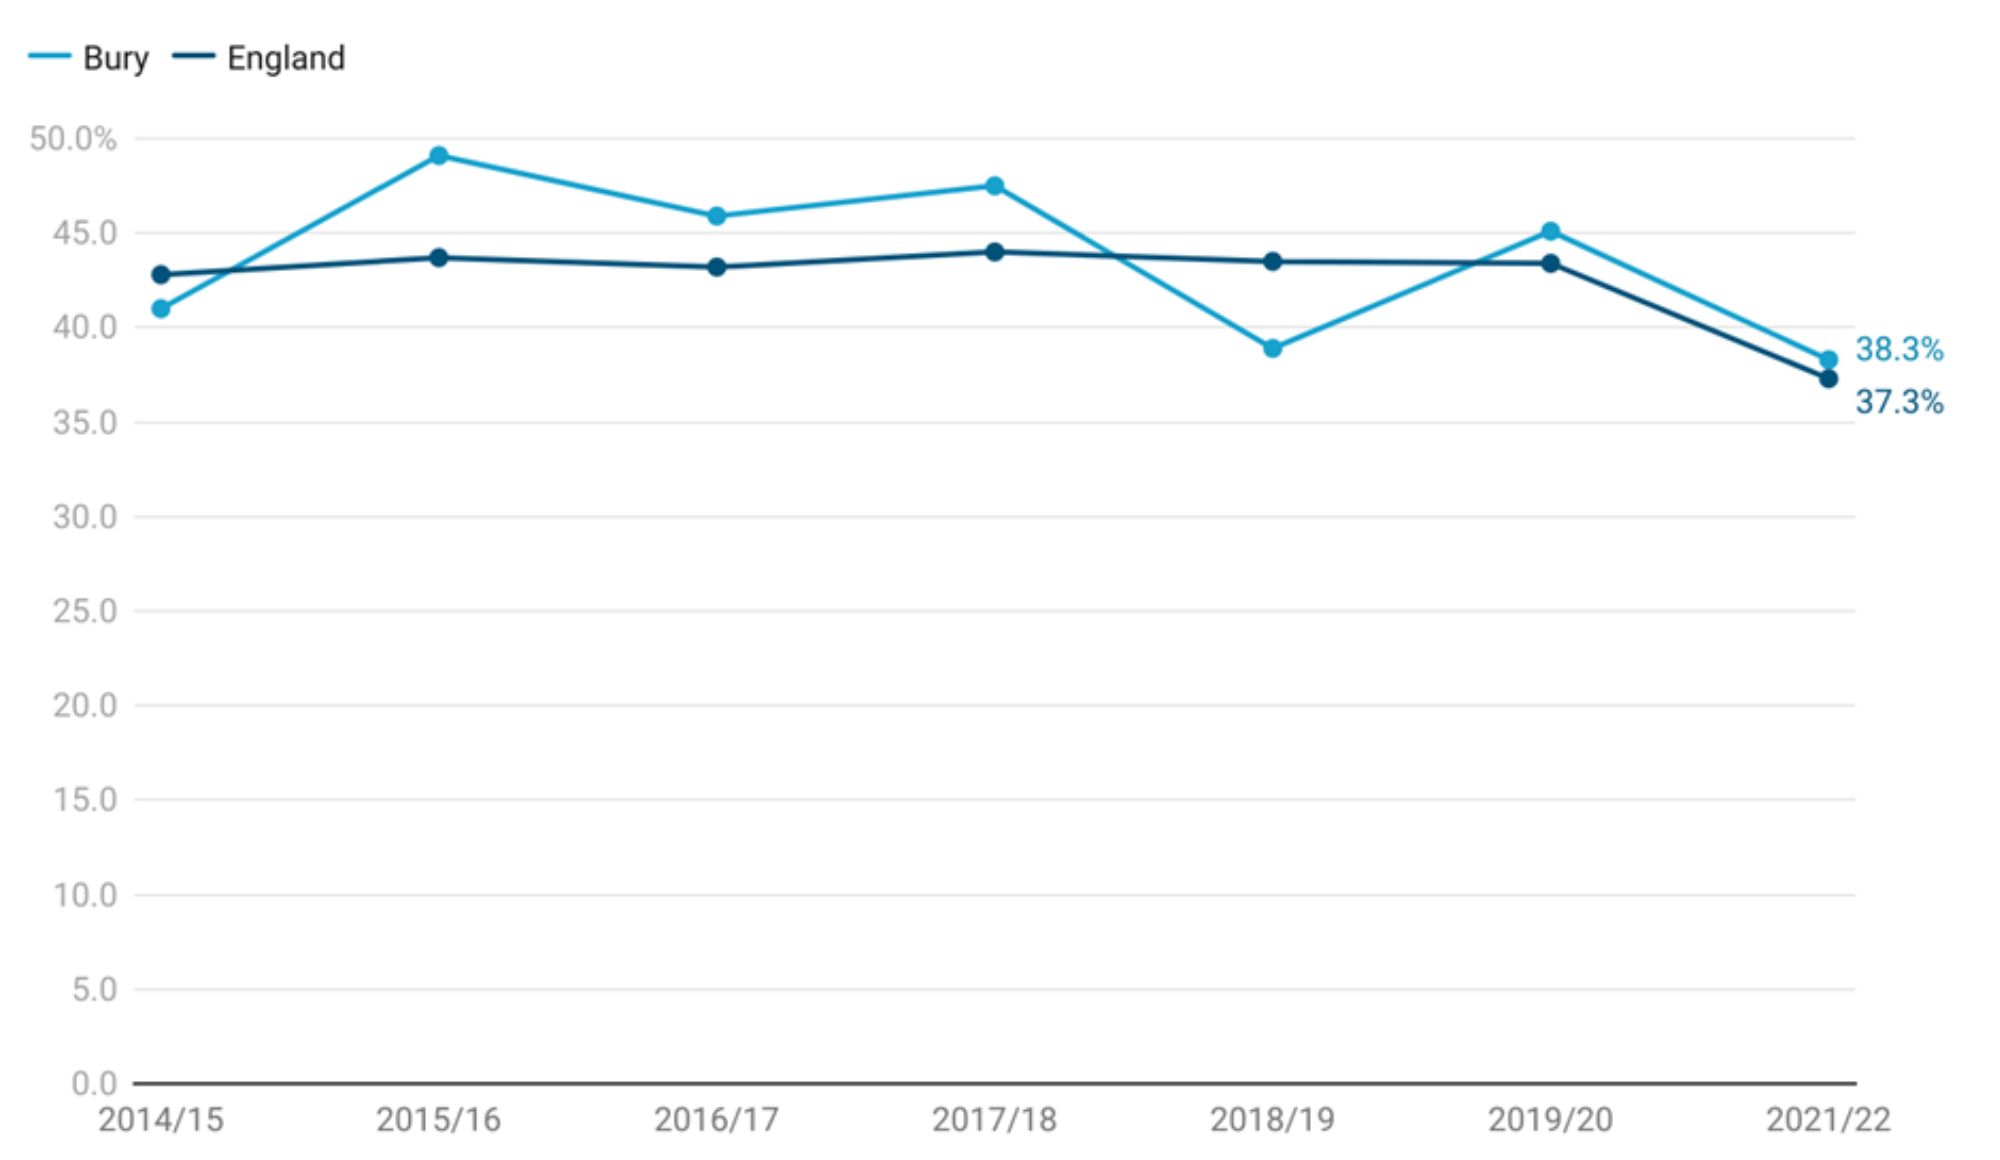
Bury has the 7th highest proportion in its group of 16 similar local authorities, with the highest proportion in St. Helens at 42.6% and lowest in Doncaster at 13.6%.
There are no data on inequalities available for Bury. Data for England are available by deprivation only. The highest proportion of adult social care users aged 65 years and over reporting having as much social contact as they would like is in 4th most deprived decile (84.2%) and 5th less deprived decile (83.8%) and lowest in the second most deprived decile (77.5%) and most deprived decile (80.1%).
Care homes and end of life
Avoiding permanent placements in residential and nursing care homes is a good indication of delaying dependency, and local health and social care services work together to reduce avoidable admissions. Studies indicate that given the choice, individuals generally prefer to remain in their own homes rather than transitioning to residential care.
Permanent admissions to residential and nursing care homes per 100,000 aged 65+
This indicator is measured as a crude rate per 100,000 residents aged 65 years and over. People counted as a permanent admission include: Residents where the local authority makes any contribution to the costs of care, no matter how trivial the amount and irrespective of how the balance of these costs are met; Supported residents in Local authority staffed care homes for residential care, independent sector care homes for residential care and registered care homes for nursing care; Residential or nursing care which is of a permanent nature and where the intention is that the spell of care should not be ended by a set date. For people classified as permanent residents, the care home would be regarded as their normal place of residence.
The crude rate in Bury for the year 2021/22 is at 599 per 100,000 compared with 539 per 100,000 in England. Significance for this indicator has not been calculated.
The trend for permanent admissions to residential and nursing care homes per 100,000 aged 65 and over in Bury has exhibited fluctuations over the specified period but trend based on five most recent data points shows that the rate is decreasing and getting better (statistically significant). In 2006/07, the rate was 1,009, which decreased to 932 in 2007/08 and further declined to 903 in 2008/09. The rate continued to fluctuate in subsequent years, with notable decreases in 2009/10 and 2018/19, reaching lows of 853 and 744, respectively. However, there were also periods of increase, such as in 2016/17 when the rate peaked at 1,012. The most recent data available for 2021/22 shows a decrease to 599.
The rate in England declined gradually from 799 per 100,000 in 2006/07 to 498 per 100,000 in 2019/20. Throughout this period, there were notable variations in the rates. For instance, in 2010/11, the rate was 690 per 100,000, slightly decreasing to 651 per 100,000 in 2013/14. In subsequent years, the rate continued to fluctuate, ranging from 628 per 100,000 in 2015/16 to 539 per 100,000 in the most recent data available for 2021/22 (Figure 37).
Comparing Bury with England, the rate of permanent admissions to residential and nursing care homes per 100,000 aged 65 in Bury has been significantly worse than England average through all years from 2006/07 through to 2020/21 except for 2013/14 and 2014/15.
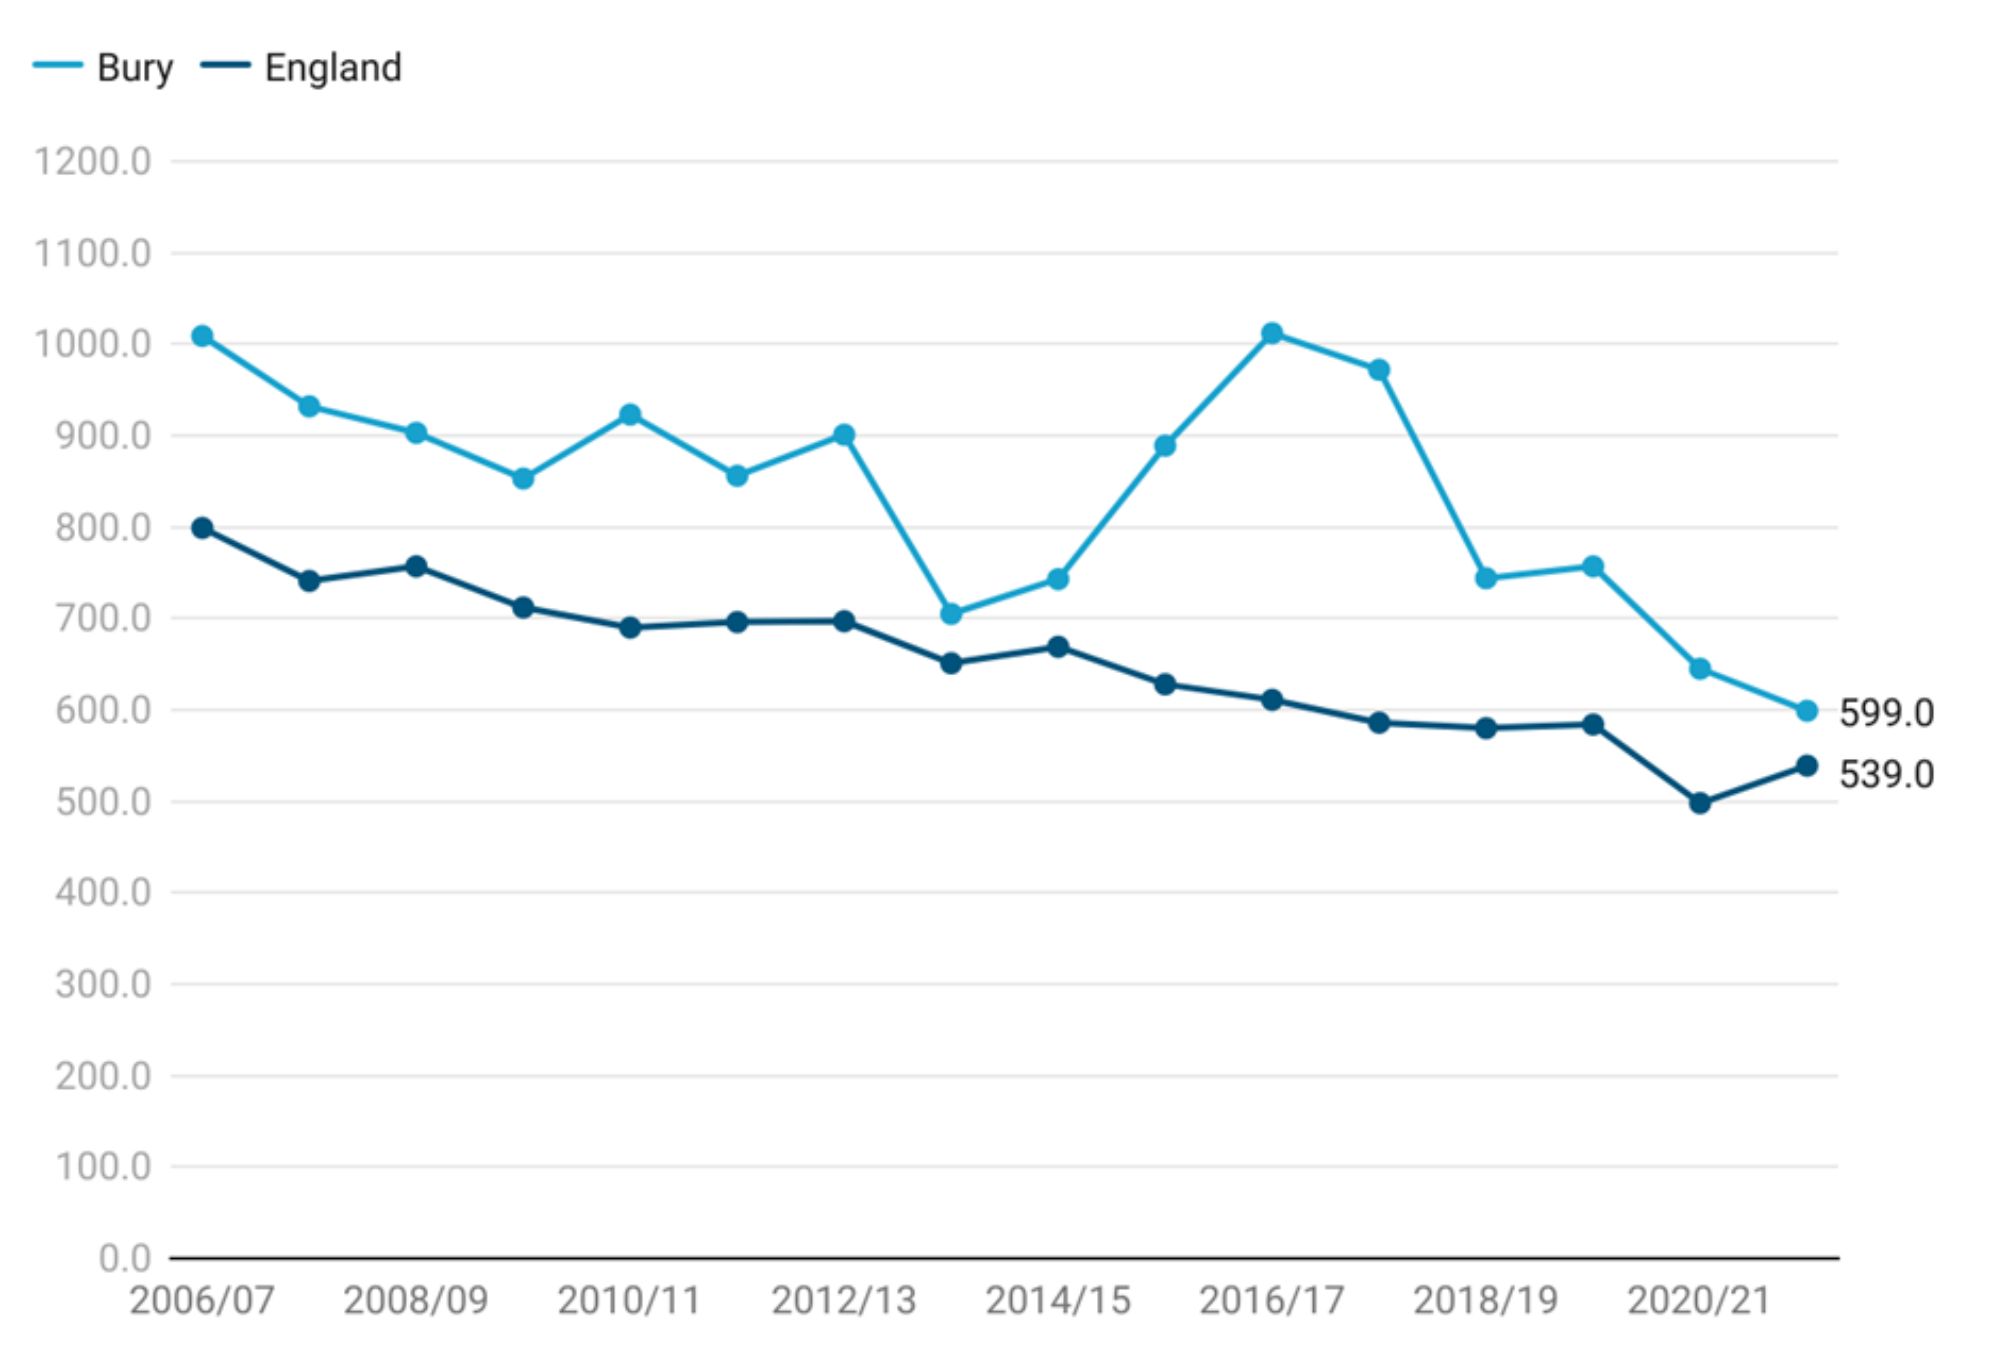
Bury has the 9th highest rate in its group of 16 similar local authorities, with the highest rate in Bolton at 805 and lowest in Rochdale at 366.
There are no data on inequalities available for Bury. Data for England are available by deprivation only. The highest rate is in the 2nd most deprived decile (699) and most deprived decile (633) and lowest in the least deprived decile (490).
Care home beds per 100 people 75+ years
Examining data on care home beds allows us to understand the trends and variations in availability of care home beds in nursing and residential care homes.
This indicator is defined as the annual proportion of beds in care homes (all; nursing and residential) crude rate per 100 population aged 75 and over. This is an all-age indicator because people under 75 years of age can also use care home beds.
The rate for Bury in 2021 was at 11.5 per 100 compared with 9.4 per 100 for England. Significance compared to England average could not be calculated.
Examining data from 2011 to 2021, the crude rate of care home beds per 100 people 75+ years in Bury remained stable from 13.6 in 2011 to 13.5 in 2014. This was followed by a period of gradual decline to 11.5 per 100 in 2021. Similar to Bury, rates in England remained fairly stable with slight fluctuation from 10.8 in 2011 to 10.8 in 2014 and then a gradual consistent decline to 9.4 in 2021. There has been no significant change in trend based on the 5 most recent data points.
Comparing Bury with England, the rates have been higher (statistical significance could not be calculated) than England average throughout the observed period from 2011-2021.
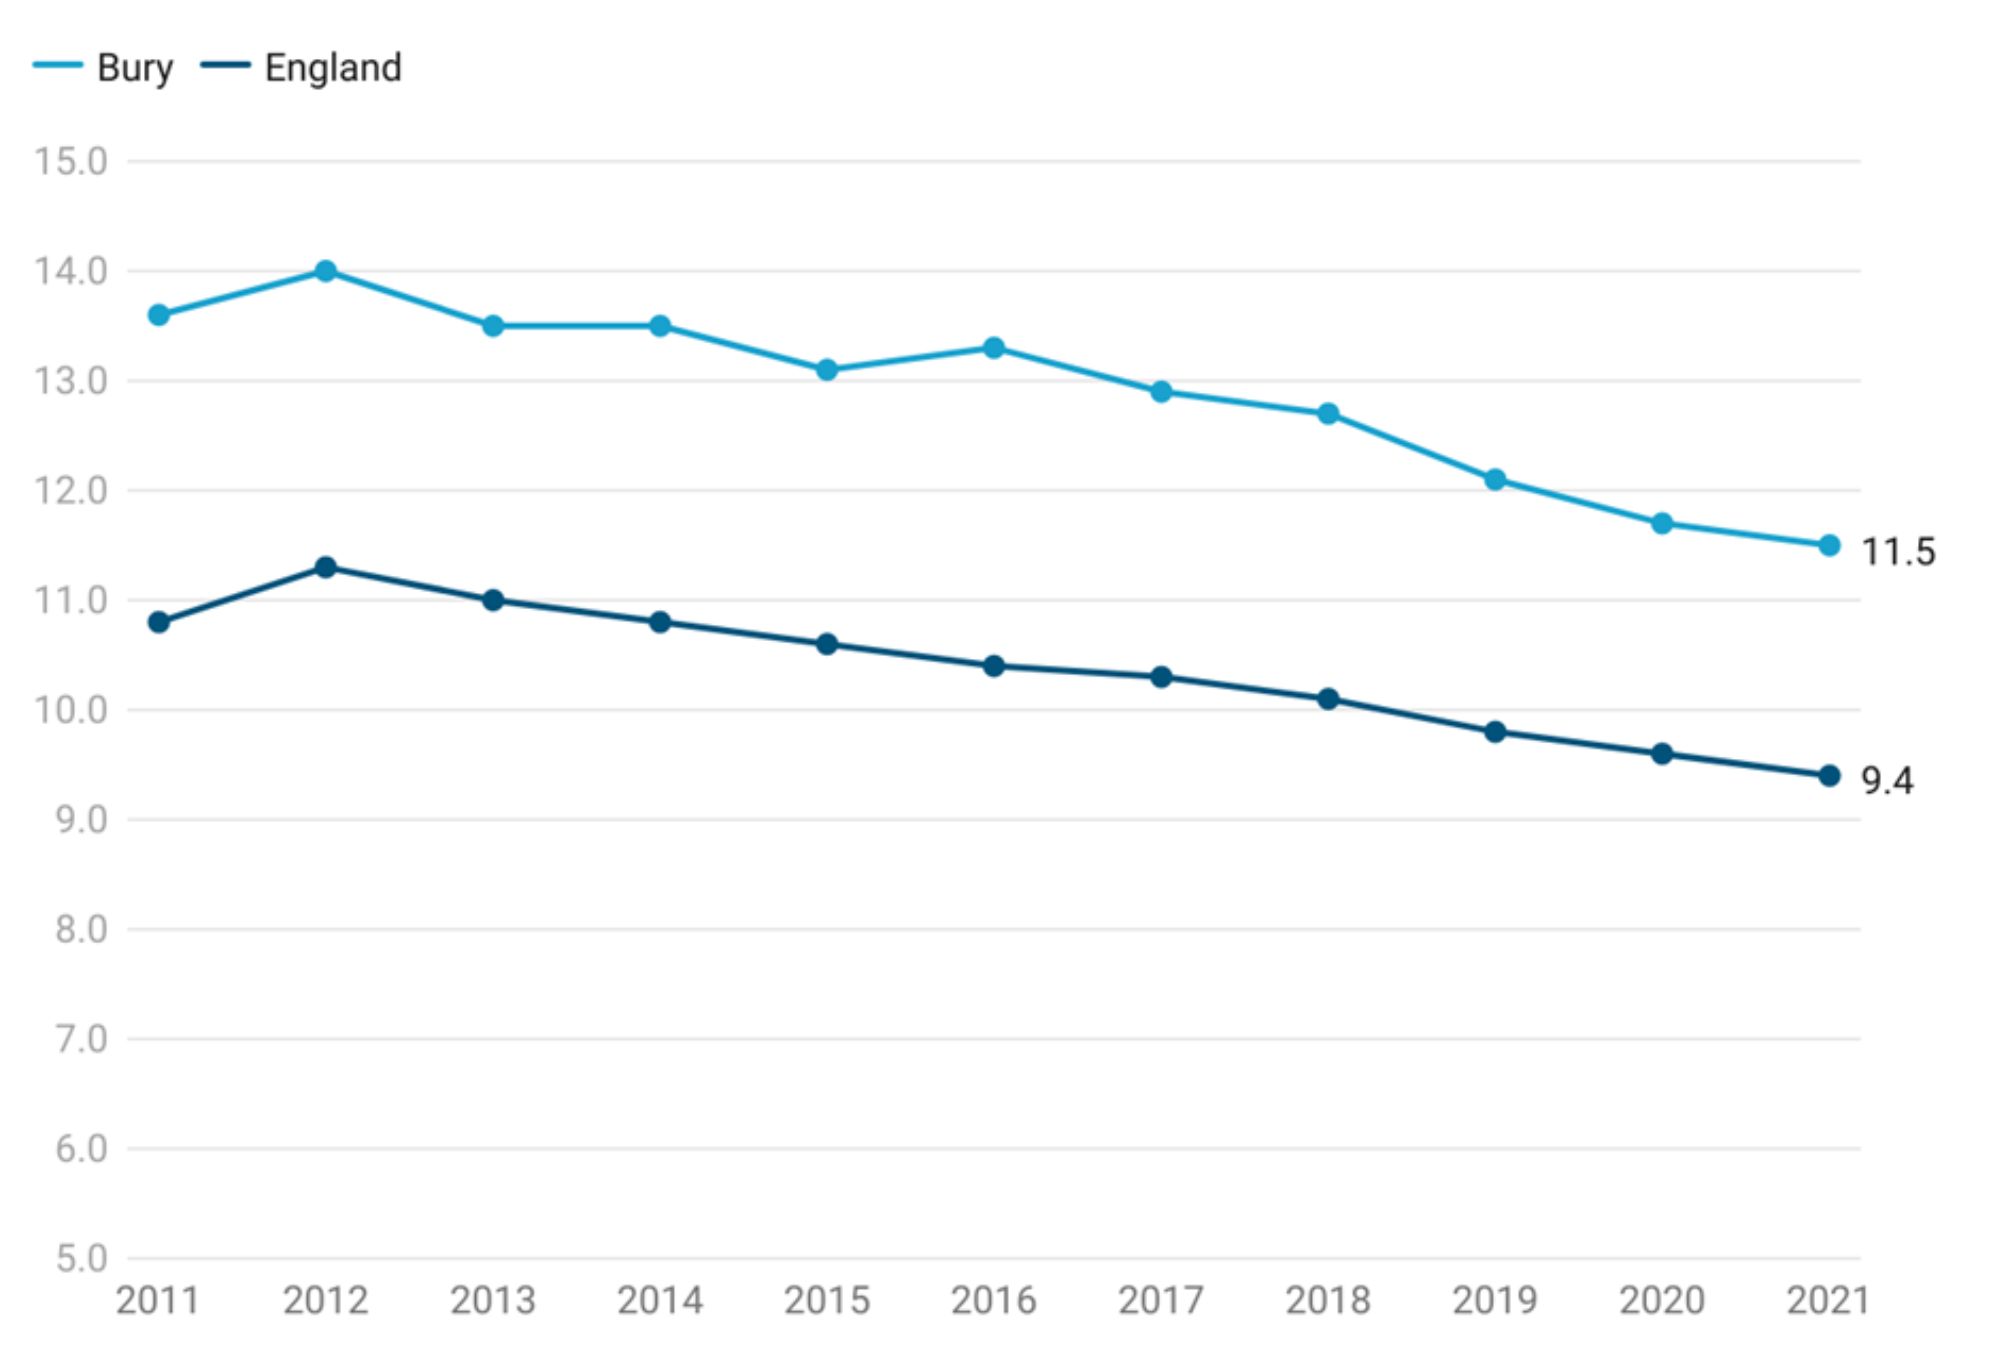
Bury has the highest crude rate of care home beds per 100 people 75+ years in its group of 16 similar local authorities, with the lowest in Dudley at 7.4.
There are no data on inequalities available for Bury. Data for England are available by deprivation only. The highest rate is in the most deprived decile (10.6) and lowest in the least deprived decile (490).